My Account     Contact Us     Cart

New Transformation Method for World Maps in Geographic Imager 3.2

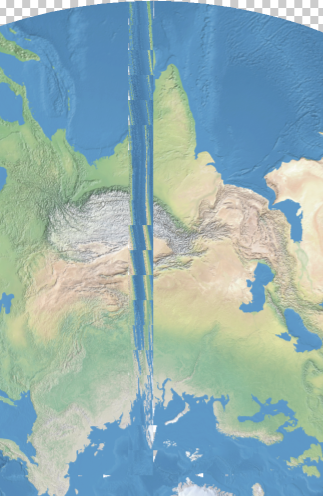
When transforming a world image, there may be artifacts created by the Geographic Imager transformation engine. Below are the results of a WGS84 world image transformed into a Stereographic projection.

Geographic Imager 3.1 transformation result

When we zoom into the problematic area, you can see up close how some artifacts affect the image after the transformation was performed.

Geographic Imager 3.0 transformation result 2

To solve this issue, we are introducing a new projection method called Maximum: World Projection in Geographic Imager 3.2.

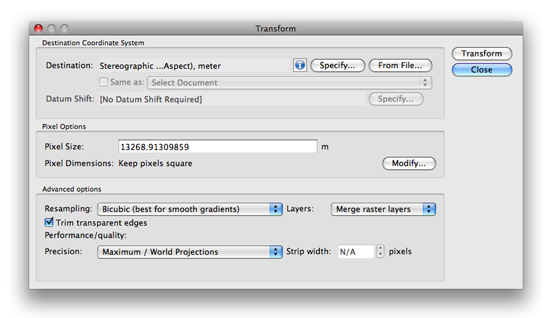
We are going to use the same world image used with the previous example and transform it into the stereographic projection. Take a close look at the Advanced Options.

Geographic Imager 3.2: Transformation Dialog box

Under the Performance/quality section, select Maximum / World Projections from the Precision drop-down list and click OK.

Geographic Imager 3.2: Maximum / World Projections option

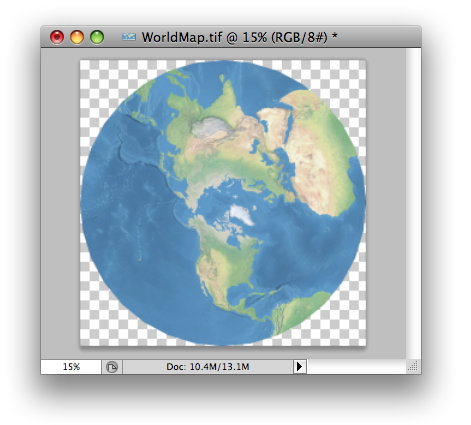
Below is the result of the transformation with the new method available in Geographic Imager 3.2.

Geographic Imager 3.2 transformation result

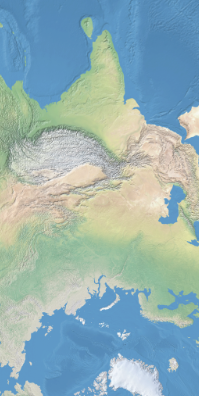
Let’s take a close look at the same area where the problem happened with the previous version of Geographic Imager. Now the transformed image does not contain any artifacts.

Geographic Imager 3.2: result (zoom in!)

This option is available since Geographic Imager 3.2. The official version of Geographic Imager 3.2 is available now.

Creating a Custom Coordinate System from a Predefined Coordinate System

When transforming a world map in a geodetic system (such as WGS84) to a predefined projection (such as Robinson) using MAPublisher, the central meridian of the predefined projection should be set to 0 degree longitude as shown below.

Image 1: world map in WGS84
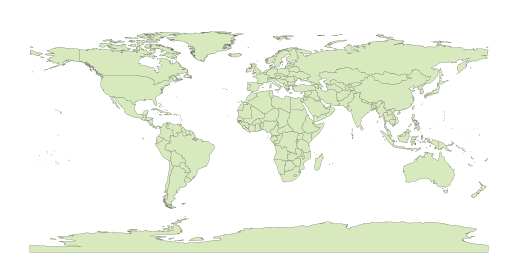
World map in WGS84 geodetic system

Image 2: world map in a predefined Robinson Projection
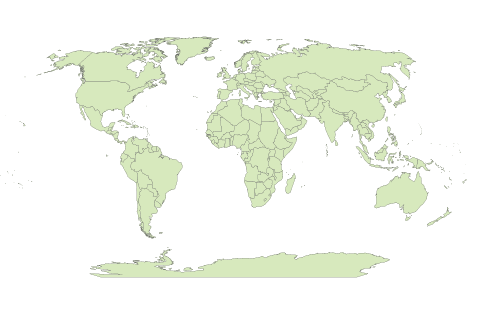
World map with the Robinson Projection with default settings

However, you might want to have a map with a different region centred on your map. For example, Image 3 below shows a world map with a part of Asia centred. In this case, the central meridian was set to 160 degrees East.

Image 3: world map in a custom Robinson Projection with a central meridian value set to 160 degree East
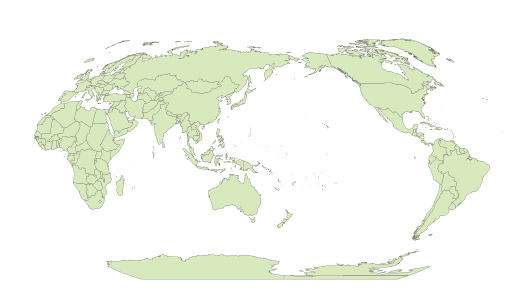
World map in a custom Robinson projection

Today we’ll introduce how to create a custom coordinate system by modifying a predefined coordinate system. We’ll use an example using a GIS dataset world.mif available in the MAPublisher Tutorial folder. We are going to transform a world map to a custom central meridian value with the Robinson projection.

Step 0 : import the “world.mif” file from MAPublisher tutorial folder.

step0:: import World.mif

Step 1 : Open the MAP View Editor window from the MAP Views panel.

In the MAP View Editor window, you can see that the scale of the map, position of the map extent with respect to the current document extent, and most importantly the current coordinate system assigned to the MAP View.
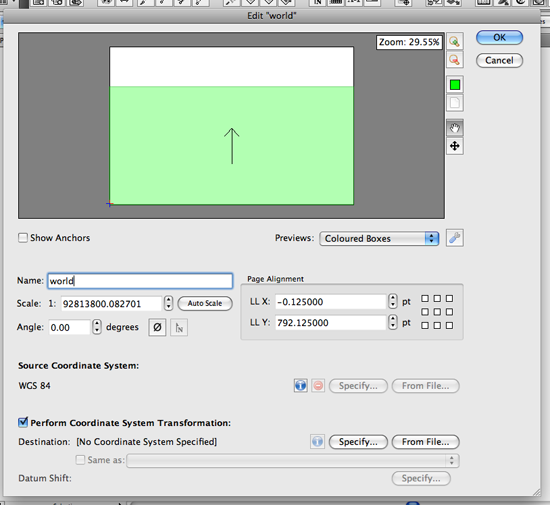
step 1: MAP View Editor window

We are going to transform the MAP View from WGS84 to the Robinson projection with a custom central meridian value. Check the “Perform cordinate System Transformation option.

Click the Specify button under the “Perform Coordinate System Transformation” section. It will open the “Specify Destination Coordinate System” dialog box.


Step 2: Creating a custom coordinate system with the Robinson projection

We are going to create a custom coordinate system based on the Robinson projection by modifying the existing Robinson projection. Find the existing Robinson projection from the list.

On the left side, navigate to Coordinate system > Projected > World. Highlight the folder “World”. You will see the list of the predefined coordinate systems available on the right side of the window. Find the “Robinson” and highlight it.
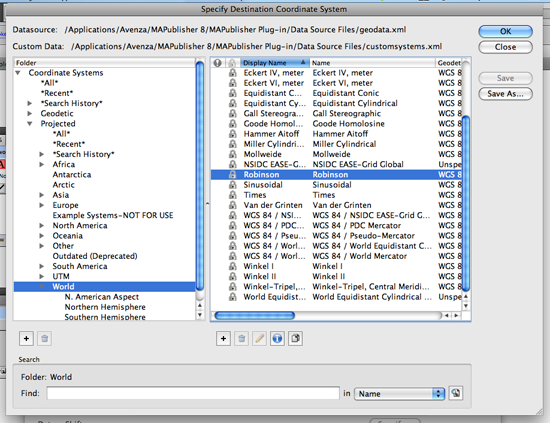
Step 2: Finding the predefined Robinson Projection

Once the predefined Robinson projection is highlighted, click the Copy button copy button at the bottom. It will duplicate the existing coordinate system and will open the “Projected Coordinate System Editor” dialog box for the duplicated coordinate system.

In the Projected Coordinate System Editor dialog box, there are two tabs: Identification and Definition. In the Identification tab, enter a new name for this customer coordinate system. This name will be used when you are searching the object.
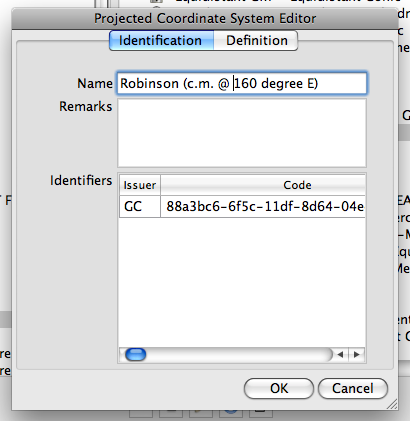
Step 4: Projected Coordinate System Editor

Click the Definition tab. Change the value of central_meridian from 0 (default) to 160. Click OK to apply this new setting. You have just made a custom coordinate system based on the existing Robinson projection.
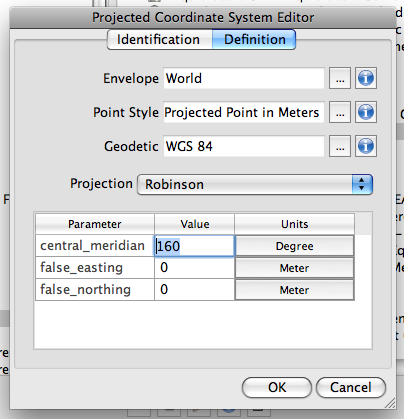
step 5: Projected Coordinate System Editor (Definition)

Step 3: Complete the Transformation

Under the “Perform Coordinate System Transformation”, the new custom coordinate system just created is indicated. Now you are ready to transform your map.
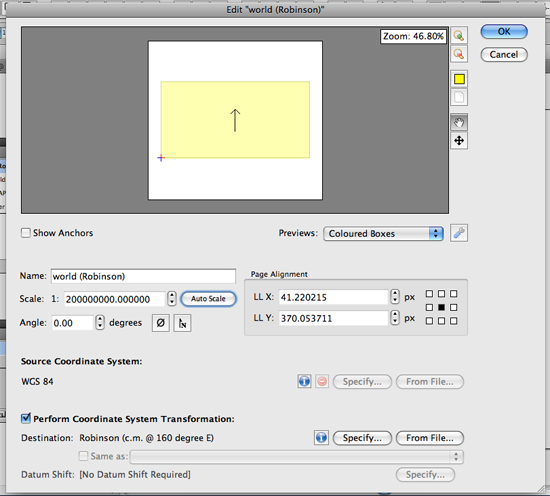
step 6: MAPView Editor with a transformation option

Now the world map is successfully transformed into the custom coordinate system (Robinson with the central meridian set to 160 degree East).

Transformed Robinson

You might want to take a look at this other blog about the new transformation engine implemented in MAPublisher 8.3.

Transforming an image into a custom coordinate system with Geographic Imager

You can use the same approach to transform your image into a custom coordinate system.

First, we open a world image that has a WGS84 coordinate system.
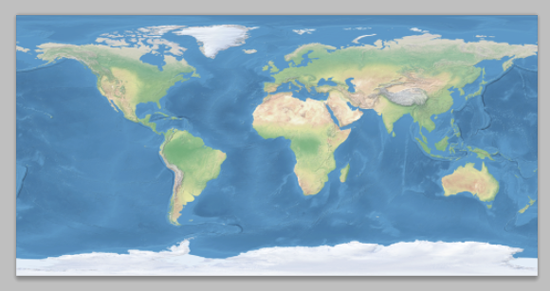
a world image in WGS84

Click the Transform button in the Geographic Imager main panel. It will open the Transform dialog box.

Click the Specify button. Now repeat Step 2 illustrated above to create a custom coordinate system. Once you select the custom coordinate system in the “Specify Coordinate System” dialog box, it will be indicated in the Transformation dialog box (in the example below, a custom coordinate system “Robinson cm @ 160 degree East” is selected as a destination coordinate system).
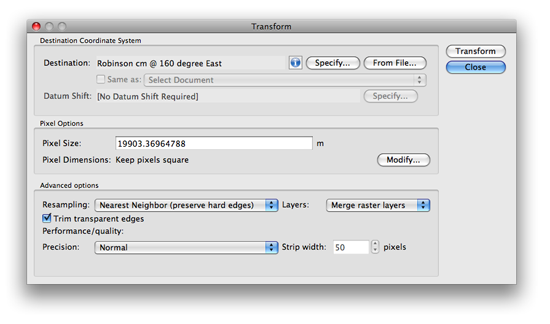
Geographic Imager: Transform dialog box

As soon as you click the Transform button, the transformation process will start. Once the transformation process is completed, the Geographic Imager main panel will indicate the new custom coordinate system name.
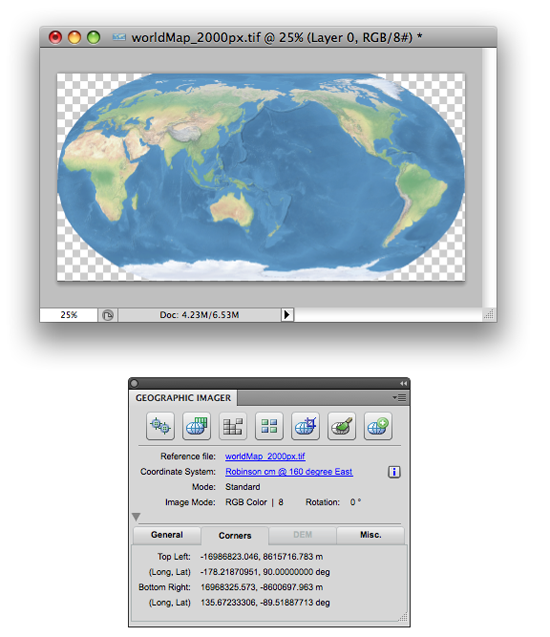
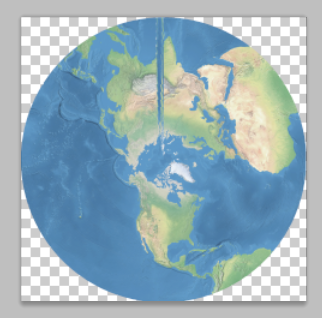
Transform completed.

Geographic Imager 3.2: Introduction to Terrain Shader, Part 3 – Applying Terrain Shader to multiple DEM files

If your workflow involves Terrain Shader, specifying a DEM schema is an important step, especially when dealing with mulitple DEM files.

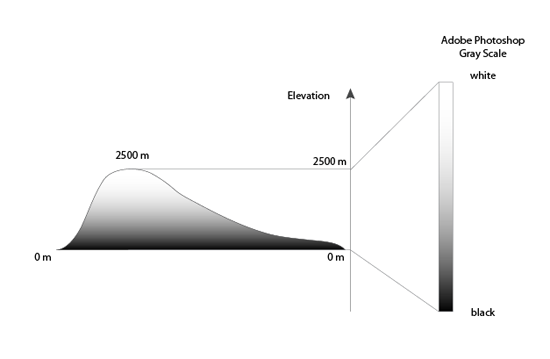
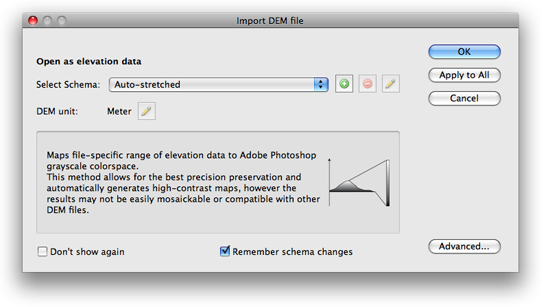
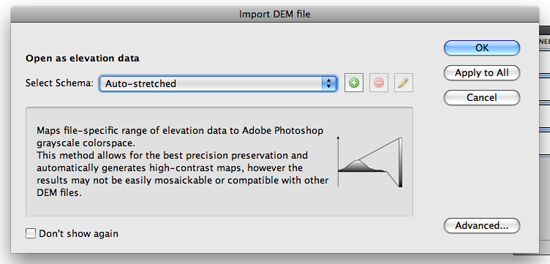
When importing a single DEM file, Geographic Imager converts elevation values to gray scale values. For example, if the elevation range in your DEM file is between 0 and 2500 meters and the “Auto-stretched” option is selected, this range will be converted to the Adobe Photoshop gray scale range between black and white. As shown below, the black color is assigned to the lowest elevation value (0 meter) while the white color is assigned to the highest elevation value (2500 meters). For elevation values between 0 and 2500, Geographic Imager calculates and converts them into gray scale.
Import DEM File - Auto-stretched

In this example, we’ll use six DEM files of one geographic region. Many datasets are distributed as tiled DEM files. Each of them is next to each other and the goal is to create a colorized DEM image from those six files.

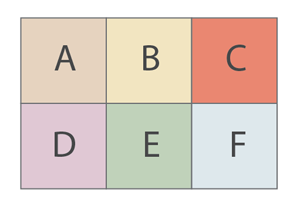
Collected 6 dem files

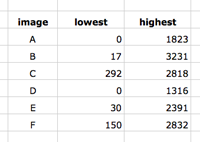
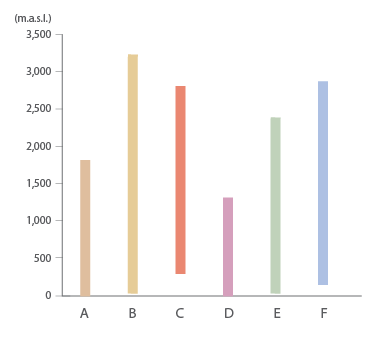
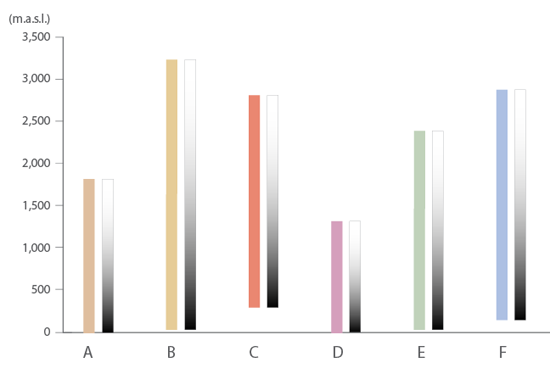
When dealing with multiple DEM files, you will need to consider the elevation range of the each DEM file. In other words, the elevation range in each DEM file will be slightly different.

table: elevation range in each DEM file Chart: Elevation range in each DEM files

Option 1: Using the “Auto-Stretched” option for multiple DEM files

When importing multiple DEM images and using the “Auto-stretched” option, click “Apply to All”…

Dialog window: Import DEM file - auto stretched

Every one of the DEM images will be converted to the gray scale between black and white.

graph: stretching the gray scale to every image file

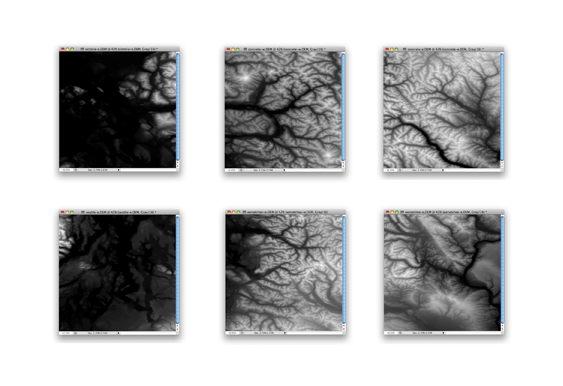
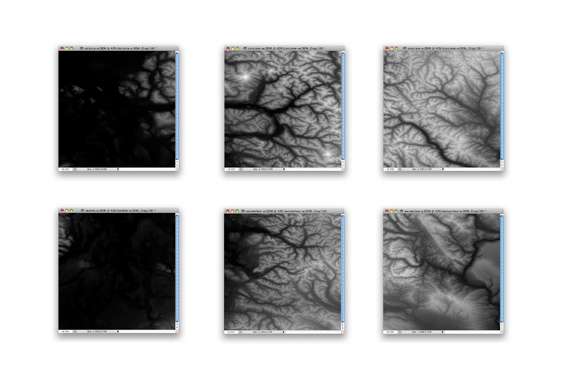
As a result, you can get the maximum contrast in each image. However, you will not be able to mosaic or apply Terrain Shader to those six images because each DEM has slight differences in elevation and an all encompassing schema like the”Auto-stretched” option will not work.

DEM images opened with Auto-stretched

Option 2: Creating a DEM schema by specifying a range

In order to apply Terrain Shader to multiple DEM files, you will need to assign one DEM schema to each DEM image you would like to share the same schema.

Step 1: Identify the elevation range amongst multiple DEM files

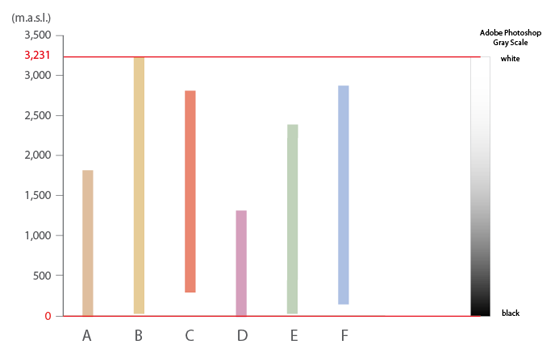
Explore the DEM files and find out what the elevation range is for each one. Then note which are the lowest and highest values among all DEMs. For this example, the lowest elevation is 0 m and the highest is 3,231 meters.

Finding the range among multiple DEM files

Step 2: Create a new DEM schema for your dataset

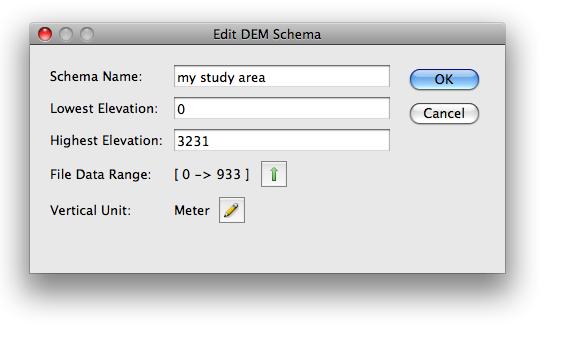
Choose File > Open and select multiple DEM files. Once the Import DEM file dialog box is open, click the Add button to open the “Edit DEM Schema” dialog box.

Create a new Schema name (e.g. “my study area”). Simply enter the lowest and highest elevation value found in Step 1.

Dialog window: Edit DEM Schema - specifying the range for the DEM schema

Step 3: Apply the DEM schema to your datasets

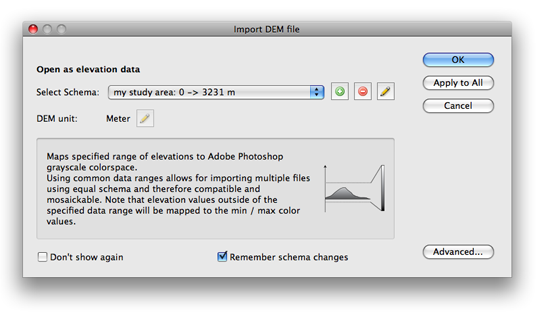
When you’ve created a new DEM schema, it will be available in the “Select Schema” drop-down list. Choose the new schema and click “Apply to All”. This selected schema will be applied to all the DEM files being imported.

dialog window: Importing DEM file with the same schema

After the import process is completed, the images are ready for Terrain Shader.

All the DEM files imported with the same DEM schema

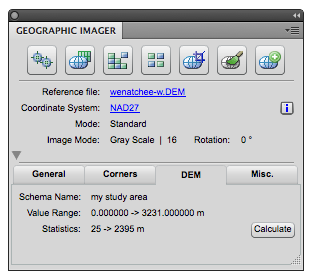
When one of the imported DEM file is the active document, click the “DEM” tab in the Geographic Imager panel. It shows the DEM schema name, the DEM value range, and the actual elevation value available in the currently active document. Click the “Calculate” button if you do not see the statistics (actual elevation value range of the active document).

Geographic Imager Main Panel

Step 4: Apply Terrain Shader to your DEM files

Since each DEM has a schema, a mosaic can be perfomed and then Terrain Shader can be applied to the mosaicked iamge.

DEM files mosaicked and Terrain Shader effect is applied

Geographic Imager: Create shaded relief from a DEM

With Geographic Imager 3.x, you can import DEM files to Adobe Photoshop and can create shaded relief images.

step 12: Shaded relief image completed

There are two methods to achieve this:

Method 1: Run the pre-made JavaScript and apply it to all images

After opening your DEM image, choose File > Scripts > Browse… and select Shaded Relief.jsx from the SampleScripts folder inside the Geographic Imager Tutorial folder. It will generate the shaded relief image for the opened DEM image based on the settings in the JavaScript file.


Method 2: Create shaded relief images manually

We’ll use the DEM file Rocky Mountains.dem available in the Geographic Imager Tutorial folder for this demonstration.

1) Open the Rocky Mountains.dem image from the Geographic Imager tutorial folder. Geographic Imager automatically detects it as a DEM file and provides the option to select the DEM image import method. For this demonstration, choose Auto-Stretched from the Select Schema drop-down list.

Step 1: Import DEM file option

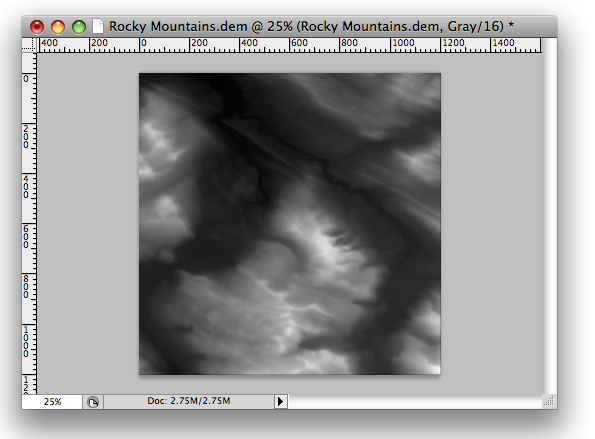
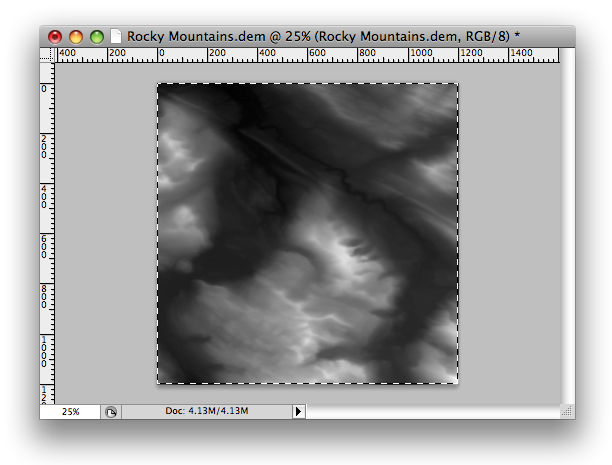
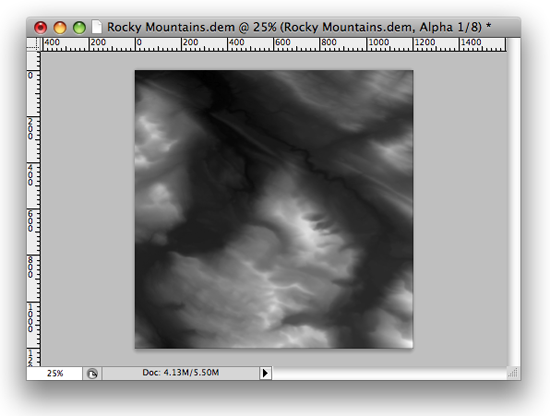
The imported DEM is opened in black and white. Take a look at the header of the image (or tab of the image file). Notice that it displays “Gray/16”. This indicates that the image is in the 16 Bits/Channel Grayscale mode.

step 1: Imported DEM image

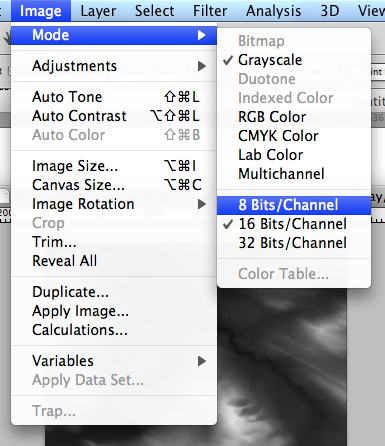
2) Now, change the image mode from 16 Bits/Channel Grayscale to 8 Bits/Channel RGB. From the top menu bar, choose Image > Mode and then 8 Bits/Channel. Once again, go to Image > Mode, this time choose RGB Color.

step 2: Changing the color mode

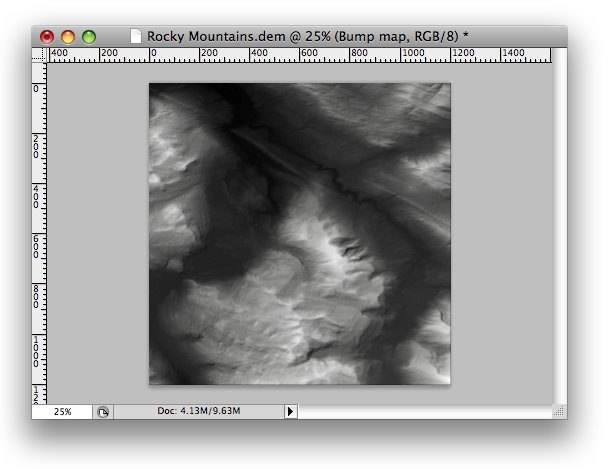
Once completed, take a look at the image header again (or file tab). Now “RGB/8” is indicated in the header, meaning that the image is now in the 8 Bits/Channel RGB color mode.

step 2: Color mode changed

3) Select the entire canvas (use the Rectangular Marquee Tool) and copy the selected area to the clipboard (Edit > Copy).

step 3: Select the entire canvas

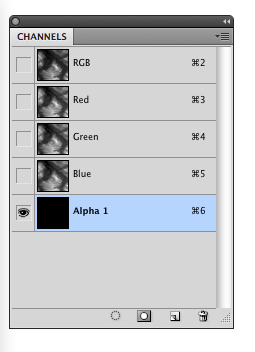
4) Open the Channels panel (Window > Channels) and add one Alpha channel by clicking the Create new channel button at the bottom of the panel or go to the panel option menu and choose New Channel. Leave the channel name as “Alpha 1”.

step 4: create a new channel

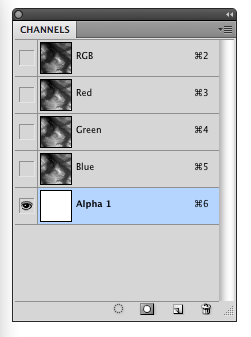
5) Select the “Alpha 1” in the Channels panel and fill it in white using the Paint Bucket Tool.

step 5: Filling Alpha channel

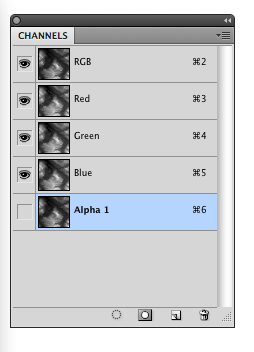
6) In step 3 we copied the selected area (the entire canvas) to the clipboard, now we’re going to paste it to the new channel. Select “Alpha 1” in the Channels panel, and paste it (Edit > Paste). You can see that the same image is displayed for all the channels when the copied area is successfully pasted. Make the Alpha 1 channel invisible and make sure the RGB channels are visible.

step 6: pasted canvas

7) Deselect the area (Select > Deselect from the top menu bar).

step 7: deselected area

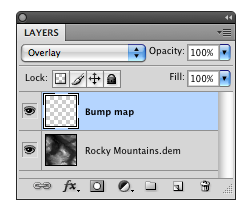
8) In the Layers panel (Window > Layers), create a new layer named Bump map. Change the Blending mode to Overlay. step 8: New Layer "Bump map"

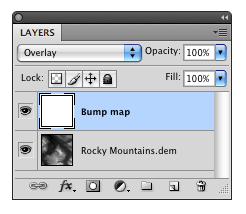
9) Using the Paint Bucket Tool again, fill the new “Bump map” layer with white.

step 9: fill white

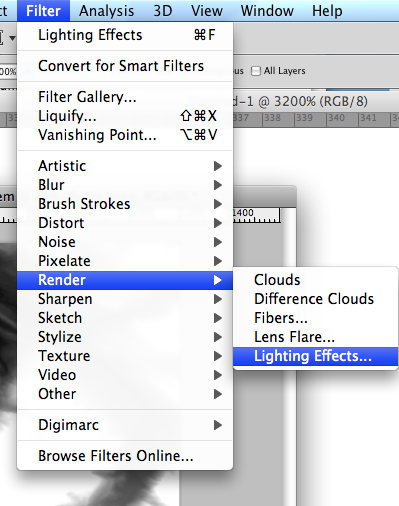
10) From the menu bar, choose Filter > Render > Lighting Effects…

step 10: Menu Filter > REnder > Lighting Effects ...

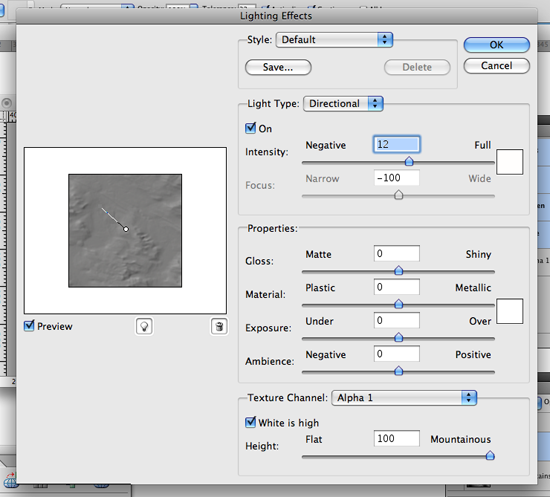
11) Adjust the settings in the Lighting Effects dialog window.

step 11: adjusting the light effect

12) The shaded relief image is completed! You can use this image to overlay with other georeferenced images with Geographic Imager or with vector datasets with MAPublisher.

step 12: Shaded relief image completed

Creating a false-color composite image with Geographic Imager for Adobe Photoshop

One of the powerful remote sensing tools available in Adobe Photoshop is to detect the land surface information by creating a false color composite image. Multispectral images contain the reflectance information from the visible and invisible electromagnetic spectrum. Using this information, we can detect many kinds of land surface information. For this example, we will detect the green area using Landsat images imported by Geographic Imager for Adobe Photoshop, which ensures all the georeference information is maintained.

Landsat images consist of several gray scale images, with each image containing one of the bands of the electromagnetic spectrum. For example, in the Geographic Imager tutorial folder, there are a set of Landsat images available. Those gray scale images are from Band 1, 2, 3, 4, 5, 7, and 8.

Landsat Images available in the Geographic Imager tutorial folder

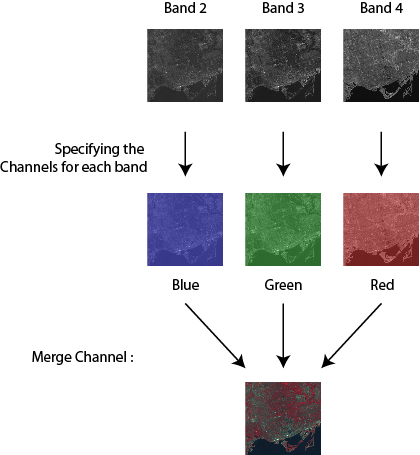
These images need to be combined into one image. The Adobe Photoshop function called “Merge Channels” produces one image by combining mulitple gray scaled images. With this example, those gray scale images from Band 2, 3, and 4 will be merged into one image by assigning a color for each band.

Image analysis trick

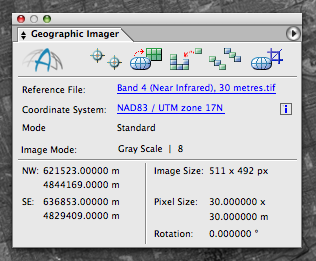
1) Open the Landsat image from Band 2, 3, and 4. Note that the Geographic Imager panel shows the information on the coordinate system and image extents.

Georeference information on the Geographic Imager panel

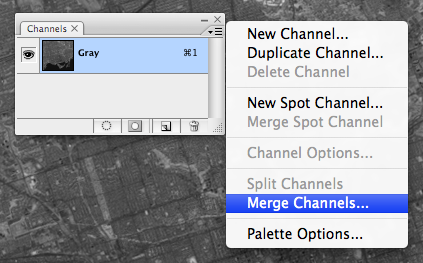
2) Open the Channel panel (Window > Channels). Choose “Merge Channels” from the panel options menu.

Merge Channels

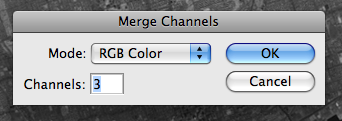
3) In the Merge Channels dialog box, select RGB color as the mode.

Merge Channels - RGB

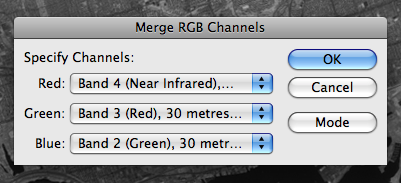
4) In the Merge RGB Channels dialog box, specify the band for each channel: band 4 for the red channel, band 3 for the green channel, and band 2 for the blue channel.

Specifying the channels for Merge channels

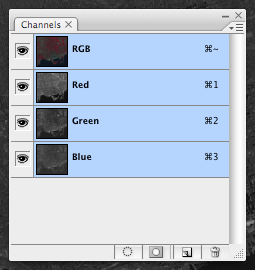
5) As a result, those three images from Band 2, 3, and 4, are assigned to the Blue, Green and Red channels, respectively.

Merge channels result in the Channels panel

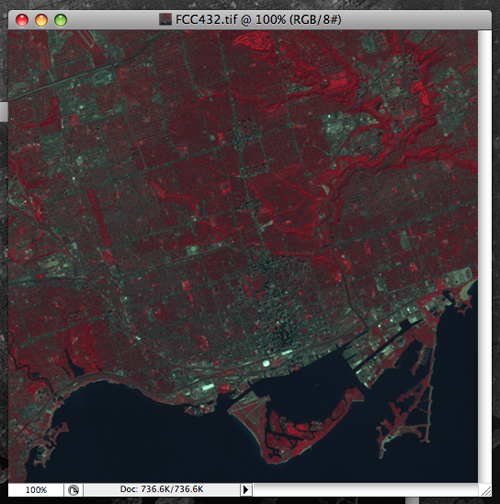
6) Now, let’s take a look at the image!

Merge channels result - false color composite image

This combination of false-color makes vegetation appear as red tones. The bright red color indicates the growing vegtation. Water is displayed in a blue color. When the water contains high sediment concentrations, the color will be lighter blue. Urban areas will appear gray to blue-gray in color.

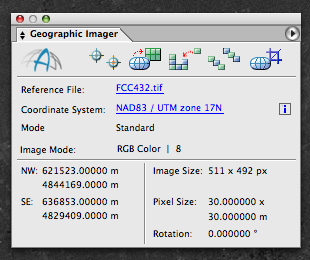
7) All the georeferenced information is inherited by the new image with merged channels from those original images. The georeference information is displayed in the Geographic Imager panel.

The georeference information was maintained from the original georeferenced image.

News Archive