My Account     Contact Us     Cart

Mapping Class: Creating Orthographic Locator Maps with Steve Spindler


We are proud to announce the start of a new video-focused blog series called Mapping Class. This blog series will curate tutorials and workflows created by cartographers and Avenza software users from around the world. We begin with a mapping workflow from Steve Spindler, a longtime MAPublisher user, and expert cartographer. He has shared with us his own take on creating Orthographic locator maps by applying some neat design tricks and utilizing MAPublisher’s powerful projection tools to create a simple, yet effective map.

Steve has produced a short video walkthrough demonstrating his process and has summarized the technique in the written article below.

***

Creating Orthographic Locator Maps
by Steve Spindler

An orthographic map is like a view from space. It’s useful for directing attention to someplace on the planet.
This video shows how an orthographic locator map is made in Illustrator using MAPublisher. The template illustrator file I use in the video is here.


We’ll start off by locating Paris on the map using Find Places. We need the latitude and longitude to create two projections.
Next, get the Latitude and Longitude from Map Attributes. You’ll have to turn MapX and MapY fields on. MapX is longitude. MapY is Latitude.
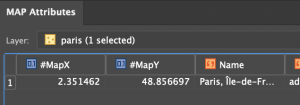
In Map Views, click on the projection, (ne_110m_land), and then select “Perform Coordinate System Projection”.
Select Projected Coordinate Systems and search for Azimuthal Equal Area. Duplicate, rename and set the definitions for the central meridian and the latitude of origin. There might be more than one. Pick one.
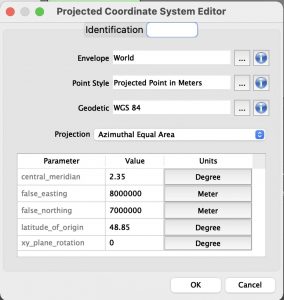
Select Projected Coordinate Systems and search for Orthographic. Duplicate, rename and set the definitions for the central meridian and the latitude of origin. There might be more than one. Pick one.

Select the new azimuthal projection, the one you created, and click OK to use it.
We use the azimuthal projection to crop data before creating the orthographic projection. Otherwise, there will be overlapping imagery. Next, create a buffer for the Paris point that is 10002.5 km around the point. This will be located on a new layer.

Use the path utilities tool to convert the bezier circle into polylines. Then reproject the map to the orthographic projection. Once completed, crop again with your circular buffer layer and delete the water layer. It will be replaced with a gradient.

Finally, add a radial gradient to the circular buffer layer and move the circle below the other layers.
Now you have an orthographic locator map that you can continue to style and label for your purposes.

***

About the Author

Steve Spindler has been designing compelling cartographic pieces for over 20 years. His company, Steve Spindler Cartography, has developed map products for governments, city planning organizations, and non-profits from across the country. He also manages wikimapping.com, a public engagement tool that allows city-planners to connect and receive input from their community using maps. To learn more about Steve Spindler’s spectacular cartography work, visit his personal website. To see the original tutorial article, or view Steve’s other mapping demonstrations, visit cartographyclass.com

Google Web Mercator Still Causes Issues For Map Makers

You would be hard-pressed to find a person living in a developed country who has never used Google Maps, let alone heard of it. In May 2017, Google announced there were over two billion active Android devices and that the Google Maps app had over one billion downloads. Take into account the fact that Google is the runaway leader among search engines, it’s not a stretch to think that Google Maps is one of the most widely utilized desktop and mobile applications in the world.

While Google Maps has been in use since its debut in 2005, few have taken the time to consider the technical cartographic elements under the hood. For most everyday users, they don’t need or care to understand the cartography—it’s a tool to get directions, view their neighbourhood, or scope out a destination for their upcoming trip. However, cartographers and GIS software developers alike have been reluctant to praise Google. This is because Google Maps uses a variant of the well-known Mercator projection known as Web Mercator (also often referred to as Pseudo Mercator or Google Web Mercator).

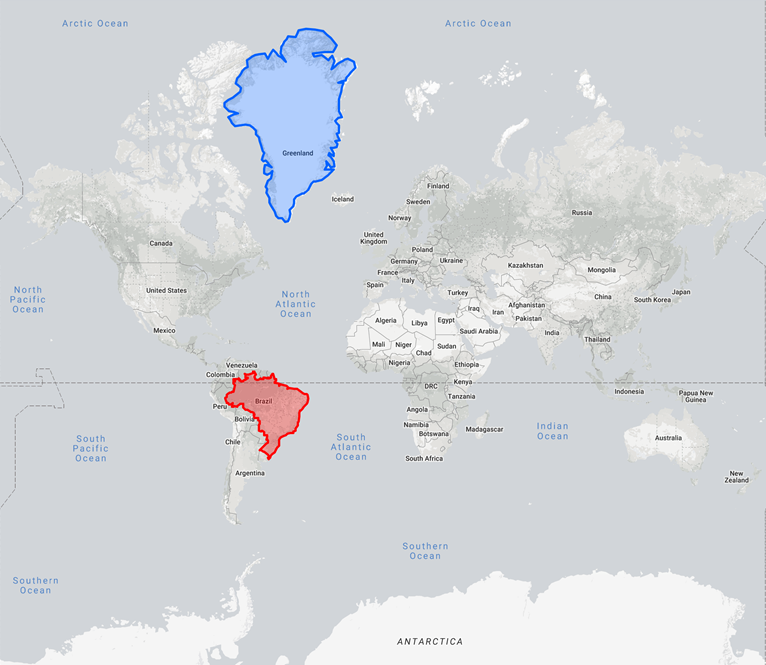
While there are several pros and cons of the Web Mercator projection, it comes under fire mainly due to the fact that locations away from the equator undergo severe stretching and distortion. This can be easily visualized using thetruesizeof.com, which is a tool that allows users to compare the size of countries if they were located at the same latitude. Let’s use Brazil and Greenland as an example. In their normal locations, Greenland appears to be almost four times the size of Brazil.

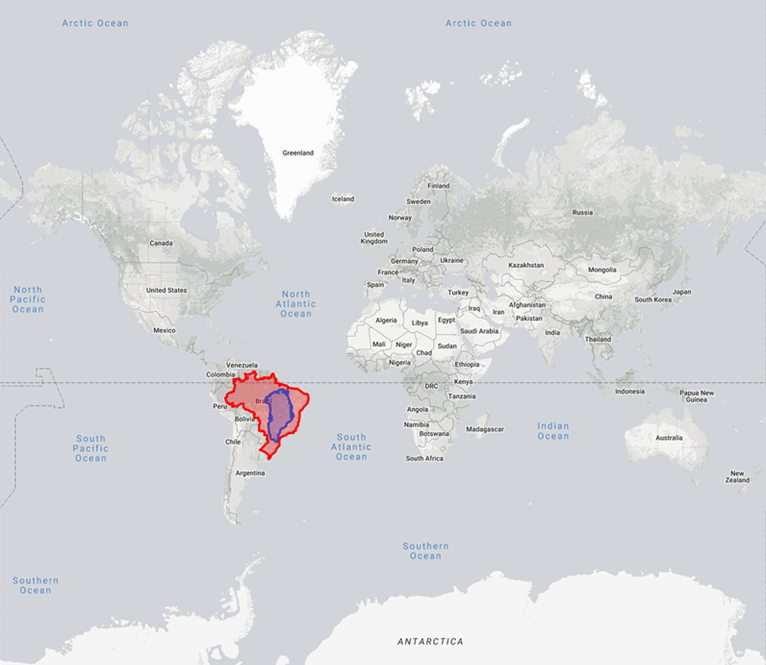
However if we move Greenland down to the equator, it shrinks to nearly a quarter of the size of Brazil, which in reality it is.


A number of publications, presentations and GIS blogs have warned about the “dangers” of mapping using Web Mercator. A lack of understanding between the standard Mercator and Web Mercator projections and the resulting inaccuracies forced the National Geospatial-Intelligence Agency (NGA) to issue an advisory to all internal departments prohibiting the use of Web Mercator. But the popularity of Google Maps has prevented Web Mercator from going away, thus GIS software and third-party mapping applications continue to support it.

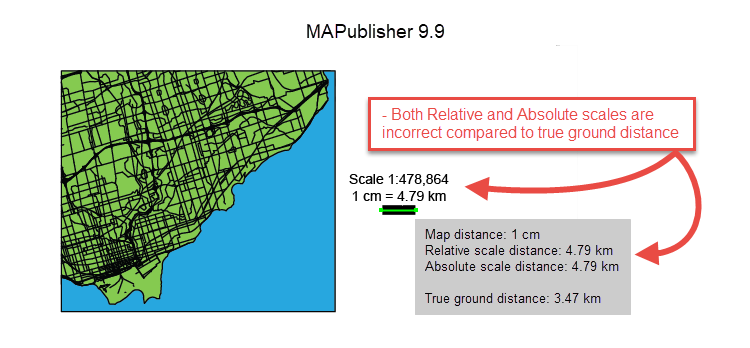
In previous versions of MAPublisher (9.9 and earlier), the absolute scale (e.g. 1:500,000), relative scale (i.e. 1 in = 1 mi), and scale bar length were all calculated based on the projection’s point of true scale. Because Web Mercator’s point of true scale is always along the equator, the scale bar tool did not account for the stretching a map experiences as latitude changes. The scale values conflicted with the actual distance on the Earth.

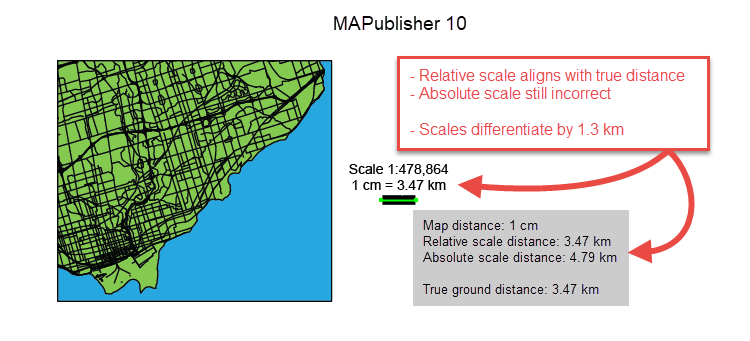
We received numerous feature requests to have the scale bar length calculated based on the latitude at the centre of the MAP View. For MAPublisher 10.0, we made adjustments to our scale calculations to do just that. However, we quickly realized we were still reporting the equatorial absolute scale value.

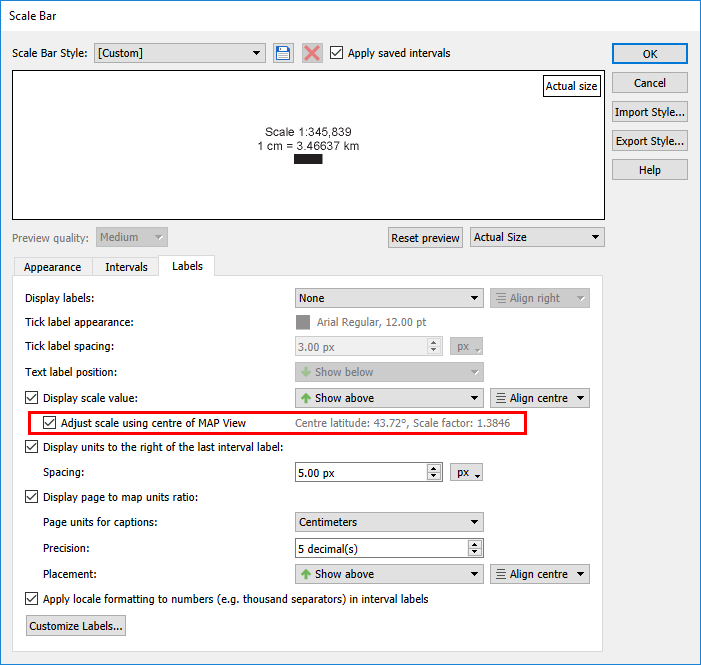
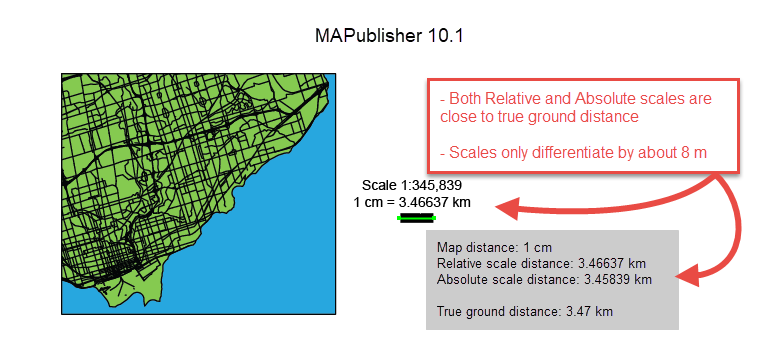
To fix the discrepancy between the two values, MAPublisher 10.1 introduced an option to adjust the absolute scale value by the scale factor, which is calculated based on the MAP View’s centre latitude. This ensures all three scales are in agreement. It should be noted that this feature is best suited for medium to large scale maps. Small scale maps cover too great a distance for the scale to be consistent across all areas.

So let’s recap. Google Maps is great for the beginner and amateur cartographers, providing an easy to use tool for spatial data visualization. However, the Web Mercator projection should be avoided, especially if performing data analysis or if mapping for military, surveying, or geodesy purposes. But what happens when you absolutely need a Google-friendly web map? Do not include the absolute or relative scale values because as the zoom level or location changes, the scale value is no longer correct (in some cases a scale bar is okay). Additionally, Google and Bing web tiles display dynamic scale bars that update based on map location and zoom level. However if you really want to include a scale graphic to give the reader some perspective, MAPublisher provides the tools necessary to ensure your map is as accurate as possible.

News Archive