My Account     Contact Us     Cart

Mapping Class: Work with Sentinel-2 Imagery in Geographic Imager – Part Two, with Tom Patterson

***

Welcome back to Mapping Class! The Mapping Class tutorial series curates demonstrations and workflows created by professional cartographers and expert Avenza software users. Today Tom Patterson is sharing with us part two of his demonstration of editing Sentinel-2 Imagery Data using Geographic Imager and Adobe Photoshop. Continued from Part One, Tom shows how to take his newly crafted true-color image to make water regions really pop! He will show you how you can use the mosaic tool in Geographic Imager to work with elevation data to create layer masks that make adjusting water areas easy.

If you missed last month’s edition of Mapping Class, check out Part One of Tom’s demonstration.

We have also compiled supplementary video notes below.

***

Work with Sentinel-2 Imagery in Geographic Imager: Part Two
by Tom Patterson (Video notes adapted from original)

The vegetation brightening technique from part one also influences the color of water bodies. In part two, we will shift water bodies to a more attractive blue and diminish reflections, wind riffles, and sediment plumes. The technique involves adding a flat blue layer with an accompanying water layer mask in Photoshop.

Create a Water-Layer Mask

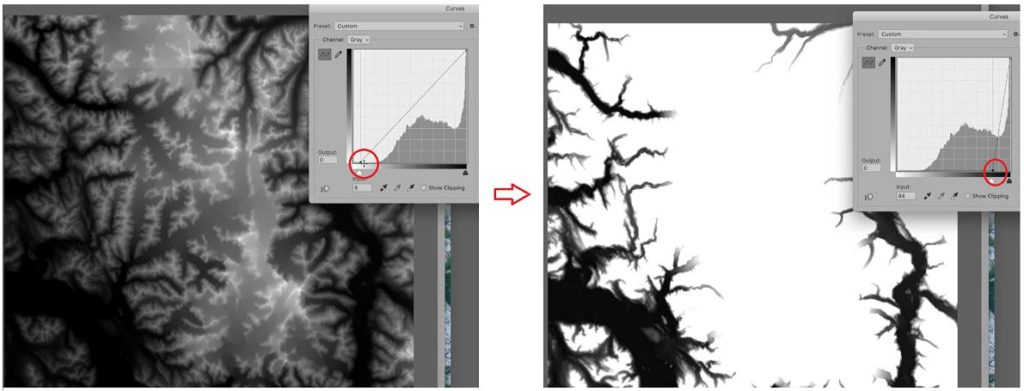
We will create the water layer mask from band 8. It contains data from the near-infrared section of the spectrum that clearly delineates water and land areas. Applying a steep curves adjustment to band 8 will compress the tonal range, which when inverted, results in a high-contrast land-water mask.
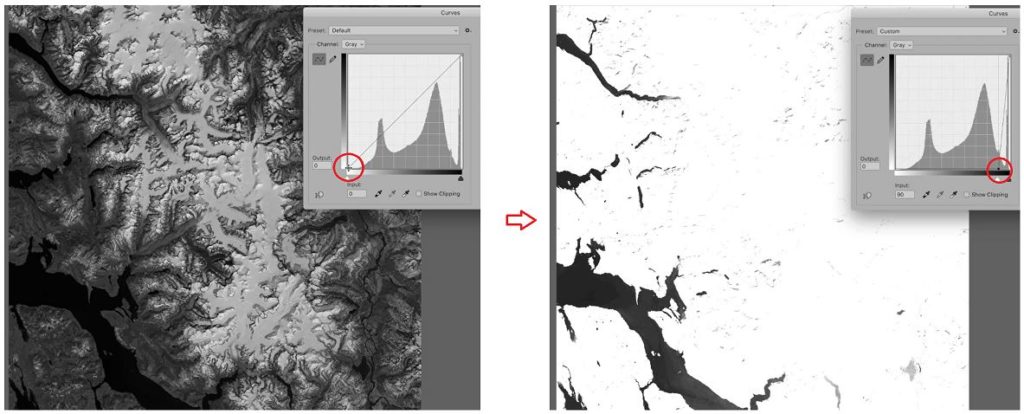
The trick is to adjust the curve in such a way so that it minimizes blemishes in the water and shadows on the land. Unfortunately, with this dataset, mountain cast shadows can still be seen as noise, even with the strong curve adjustment. Obviously, this would create challenges if we were to use this as our water mask, so we need to do a few more steps to get rid of that “noise”.

Clean-up the Water Layer Mask

I’ve grabbed a 30m SRTM DEM for this area. I can use this as a mask to get rid of those pesky mountain shadows. The tricky part is that we are now working with mixed projections and different datasets.

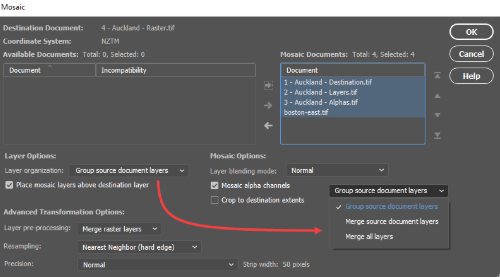
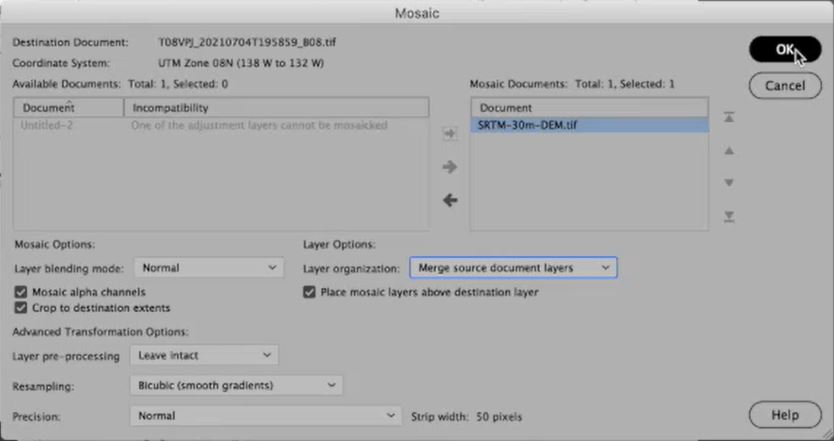
I can use the nifty Mosaic tool in Geographic Imager to bring these two datasets together. The really important part is to specify the “crop to destination extents” option. Doing this will not only apply an on-the-fly projection transformation but also crop the large DEM dataset automatically down to match my water mask layer. Also, be sure to select the “merge source document layers” option – this really helps clean up the layer management, while still keeping the important stuff separate.
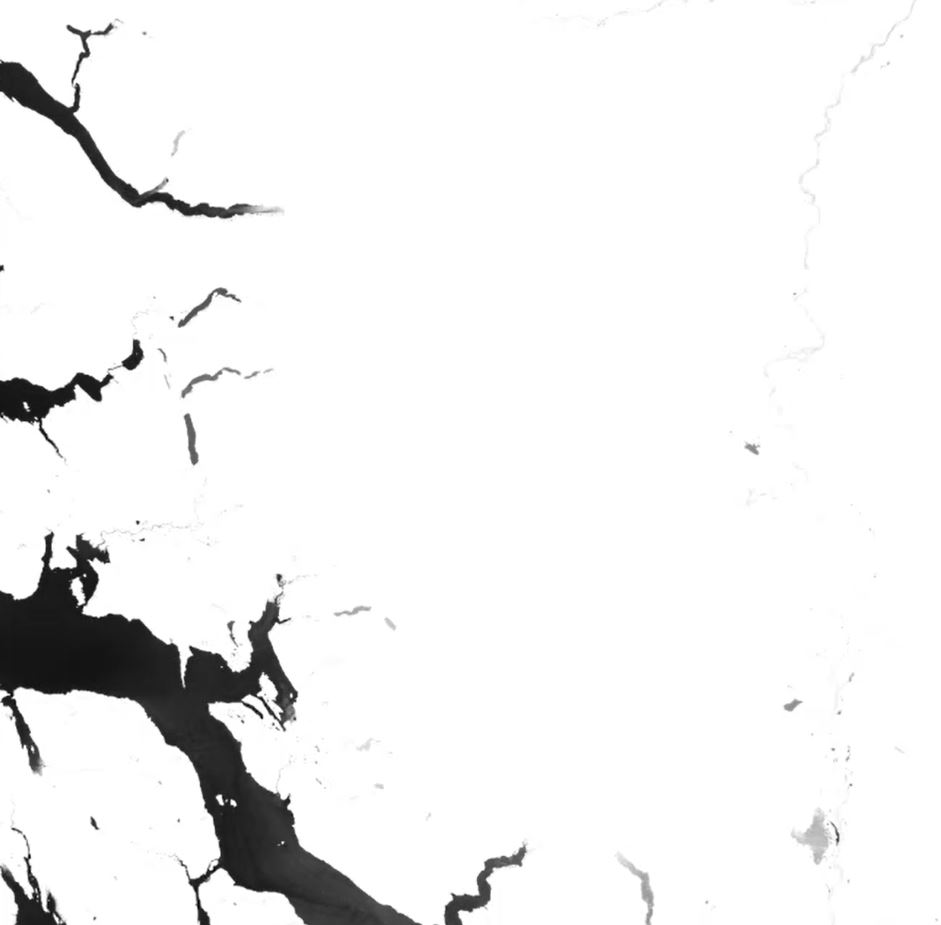
To get rid of those mountain shadows, we apply another linear curves adjustment. Similar to before, the idea is to compress that tonal range until only the regions at or near sea level are visible (most of the water in our image is at sea level).
Select the layer, apply the “Screen” blending mode, and then “flatten” the image to create the final water mask layer (now with removed mountain shadows!).
Apply the Water-mask layer

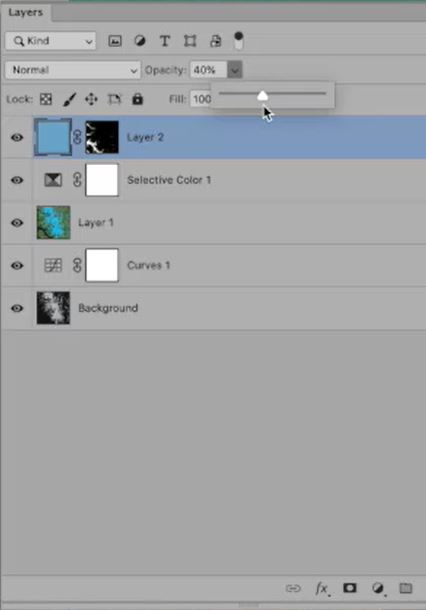
When the water mask is ready, copy it to the computer clipboard. Next, go back to the true color image and create a new topmost layer and add a layer mask. Then paste this into the layer mask (be sure to invert it!). You can then fill the water layer with whichever flat blue that you like. Finally, partially decrease the opacity of the flat blue layer to reveal any sediments or reflections that may exist in the satellite images. You might need to do a bit of manual touch-up with the brush tool on your mask layer to completely remove all mountain shadows.
Mosaic Multiple Images

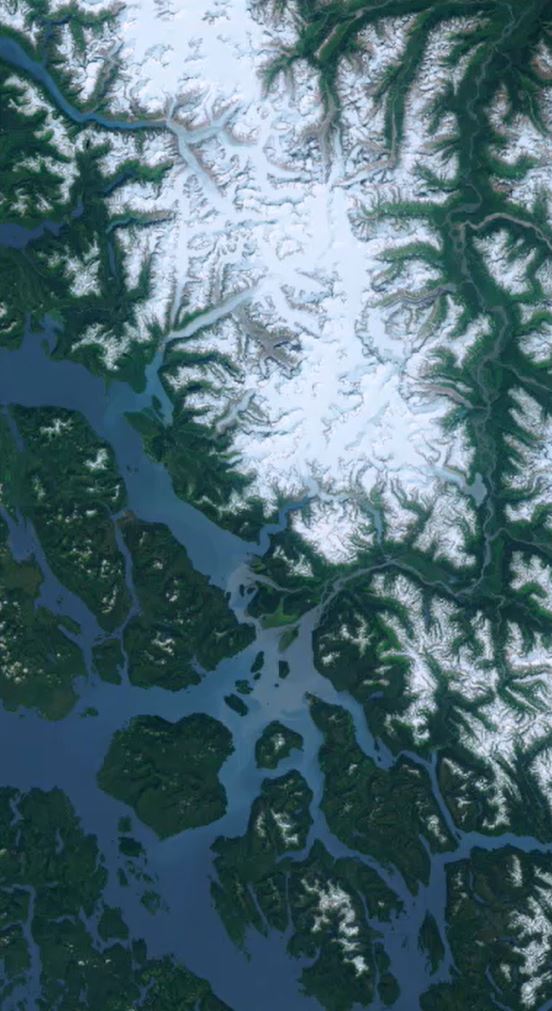
I did almost the exact same technique on another image directly south of this one, and I’ve decided I would like to mosaic both of these images together into a single composite. Again, I use the mosaic tool (this time uncheck the “crop” option), and voila! Both images are mosaiced together in less than a second!
Finishing Touches

A few more touch-ups with the gradient tool to blend the images at their border, and some final adjustment layers to boost the saturation a bit and we are basically done.

The very last thing that I do is to apply sharpening, which is irreversible. You will need to experiment to determine the amount that is best. As a starting point, try these settings (Filter/Sharpen/Unsharp Mask). Amount = 100%, Radius = 0.5 pixels, Threshold = 0 levels
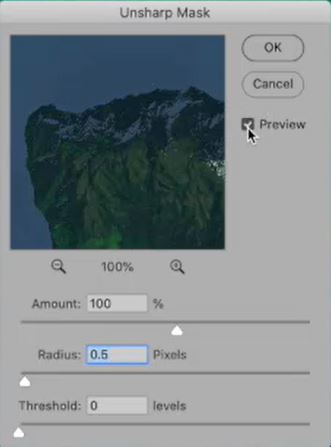
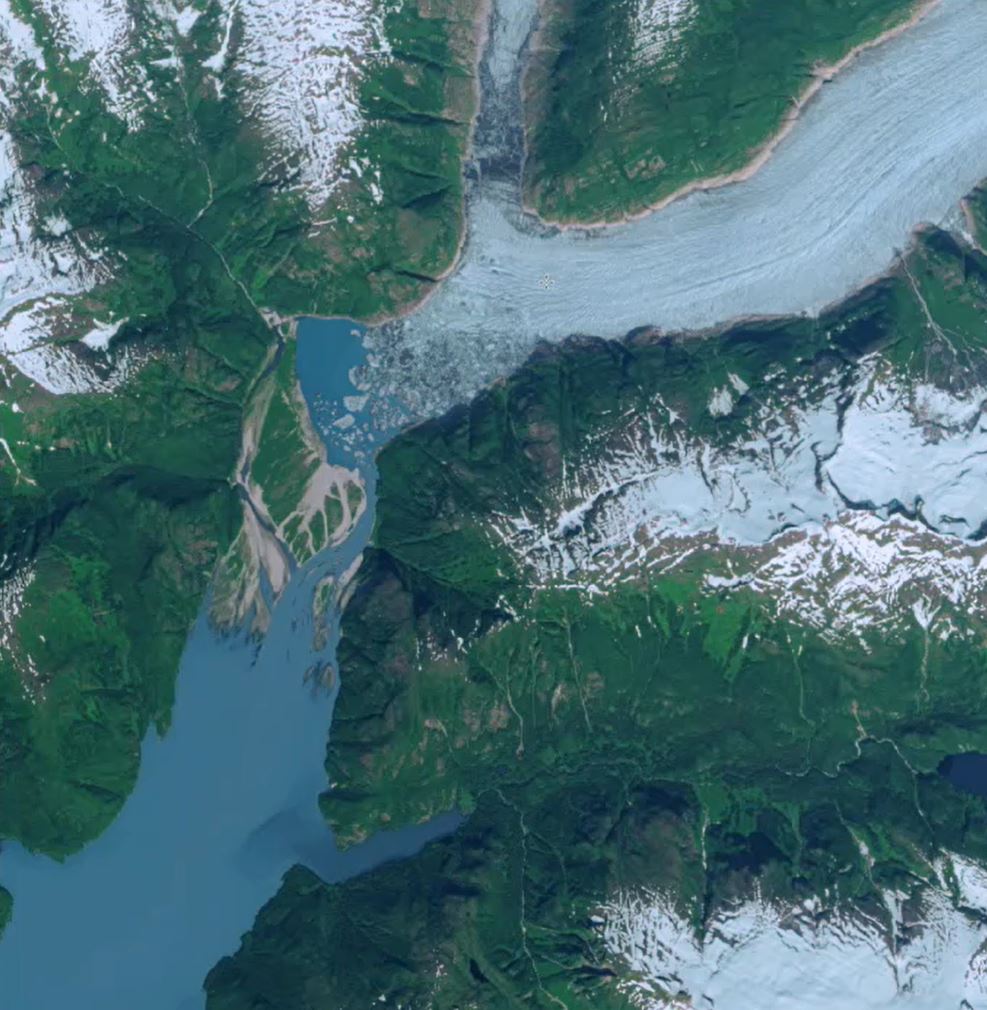
That’s it! We took some really nice multispectral Sentinel-2 Imagery, some great tools in Geographic Imager, and used some of the nice native Photoshop tools to create a really vibrant, true-color image that’s ready to be draped over some 3D relief or used to create another nice map!

A note on Exporting Images

Before exporting the final image as a GeoTIFF using Geographic Imager, go to Image/Mode and reduce the bit depth from 16 to 8 bits per channel, and then flatten the image. This will significantly reduce the file size.
***

About the Author

Tom Patterson worked as a cartographer at the U.S. National Park Service, Harpers Ferry Center until retiring in 2018. He has an M.A. in Geography from the University of Hawai‘i at Mānoa. Presenting terrain on maps is Tom’s passion. He publishes his work on shadedrelief.com and is the co-developer of the Natural Earth dataset and the Equal Earth projection. Tom has served as President and Executive Director of the NACIS. He is now Vice-Chair of the International Cartographic Association, Commission on Mountain Cartography.

Exploring Shaded Relief Techniques in Geographic Imager and Adobe Photoshop 3D

PLEASE NOTE: As of Photoshop 22.5, Adobe has discontinued support for the program’s 3D features. This may affect some or all elements of this blog. For more information, see Adobe’s FAQ page about this change and the Geographic Imager compatibility information page.

In the world of map-making, shaded relief refers to a visual technique that gives the illusion of three-dimensional terrain on an otherwise flat map. Cartographers use shaded relief to draw the viewer’s eye to prominent topographic features such as mountains, valleys and canyons. Using imaginary illumination sources and digital elevation data to cast directional light on a map, the cartographer can give the illusion of depth, casting shadows into valleys and lowlands, and highlighting ridgelines and peaks as if they are bathed in sunlight. 

Historically, this technique was achieved entirely by hand and was extremely labour intensive. Now, with modern graphical software and digital mapping technologies, relief shading can be accomplished right on the desktop. 

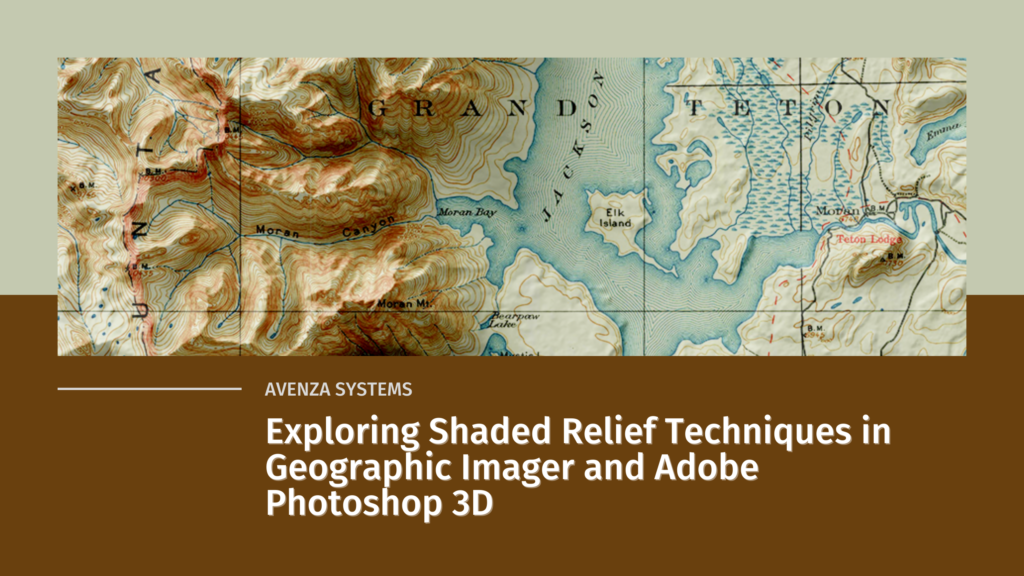
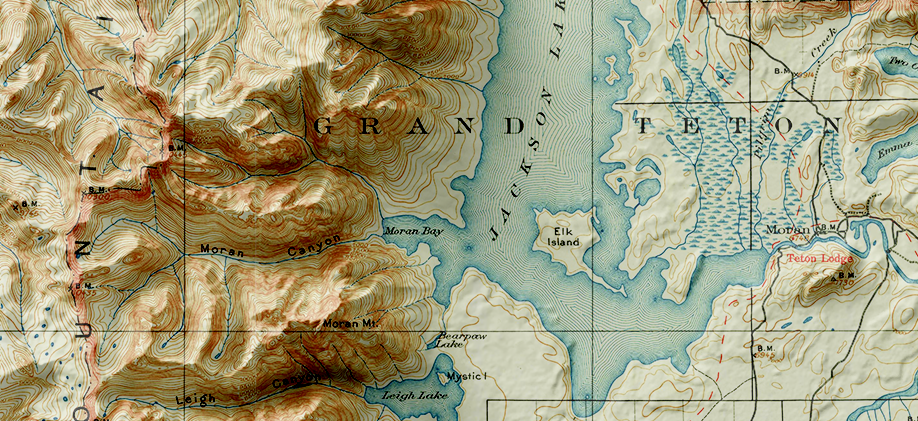
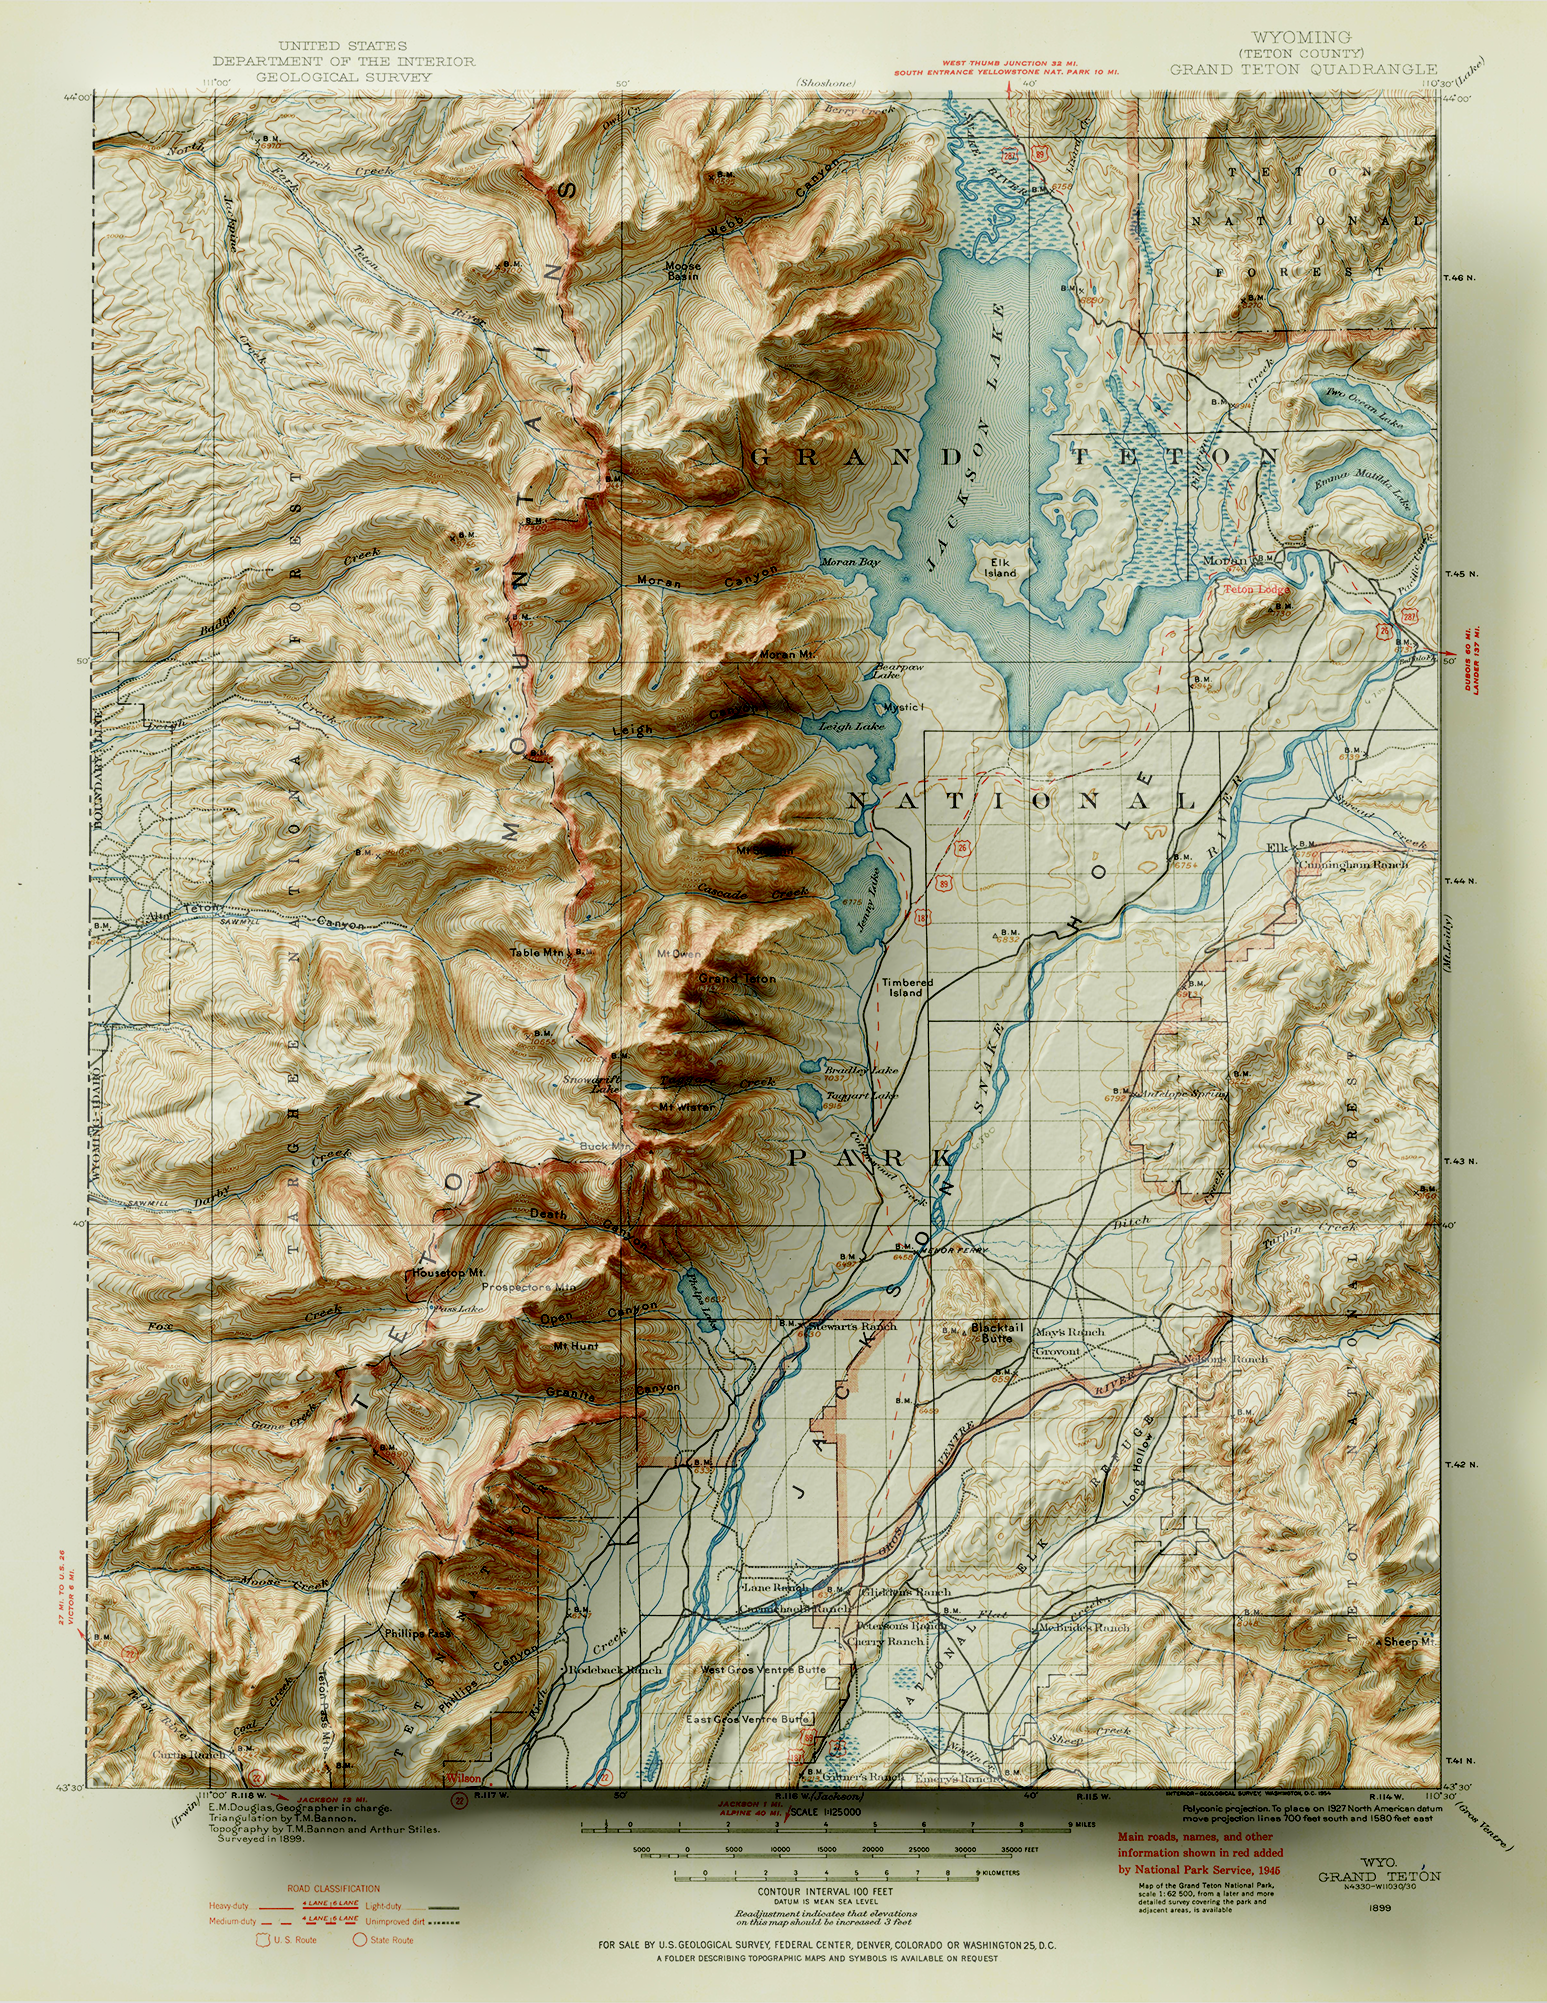
To demonstrate this, we are going to use the powerful spatial imagery tools and graphical design capabilities of the Geographic Imager plug-in for Adobe Photoshop to explore relief shading using a really interesting 19th-century historical map. Here is a sneak peek to show what the final product will look like.

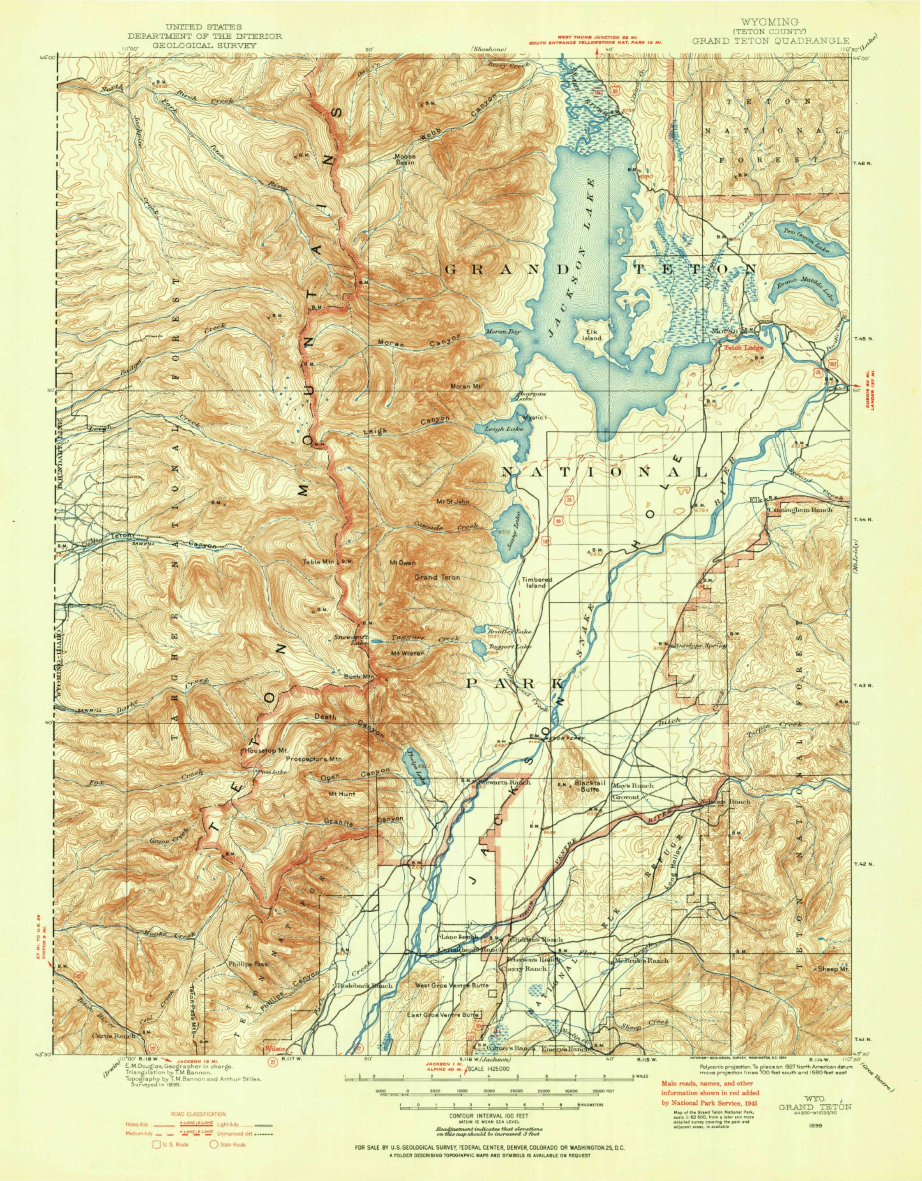
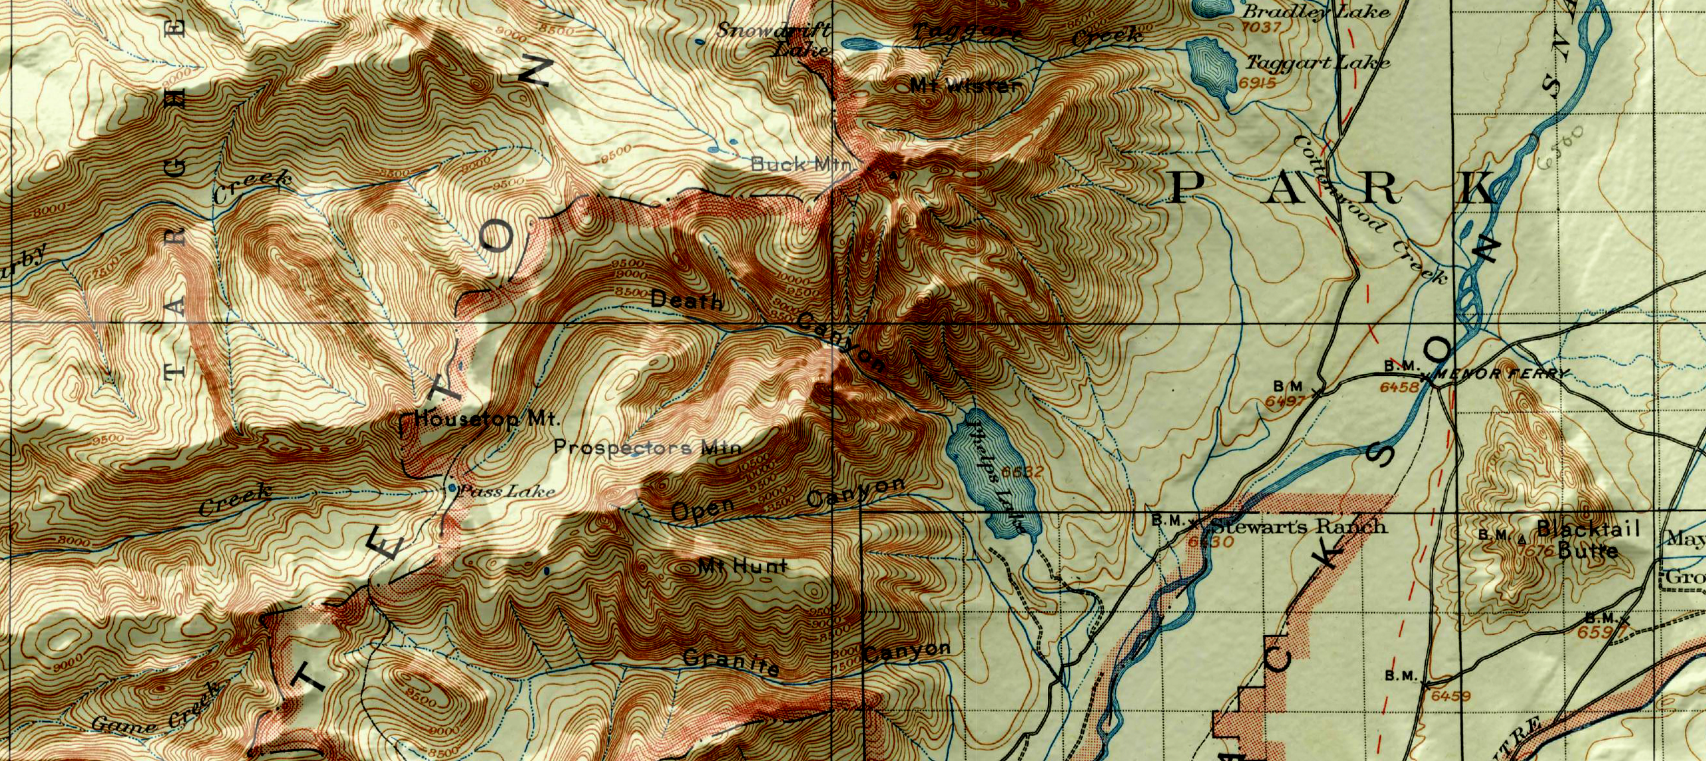
Let’s start with our original map. We have taken an absolutely stunning United States Geological Survey Map of the world-renowned Grand Teton National Park in Wyoming. Originally drafted by hand in the year 1899, the map features beautifully drawn contour lines and colour work showing the mountainous topography of the park and its surrounding area. The map, and thousands of others like it, are available in full-resolution on the USGS Historical Map Catalogue. Our goal will be to bring the map to life using three-dimensional (3D) relief shading techniques available with Geographic Imager and Adobe Photoshop.

First, we need to bring in some elevation data. Elevation data is critical for creating shaded relief, as it determines how light and shadows will behave in different parts of the map. We can obtain high-resolution digital elevation models (DEM) for our region from the USGS EarthExplorer.

Those of your familiar with spatial imagery data and DEMs will know that our first challenge will be working with tiled (discontinuous) imagery data products. In its raw form, DEMs are often stored as identically sized tiles, with each tile representing a specific indexed region of the earth’s surface. It is an unfortunate reality that many times the spatial extent of each DEM tile rarely matches the exact extent of the area you are interested in mapping. As a result, map-makers and spatial imagery specialists need to implement tools to import, merge, and crop these tiles to a more useful format and size.

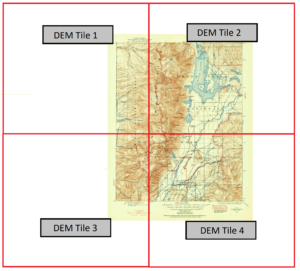
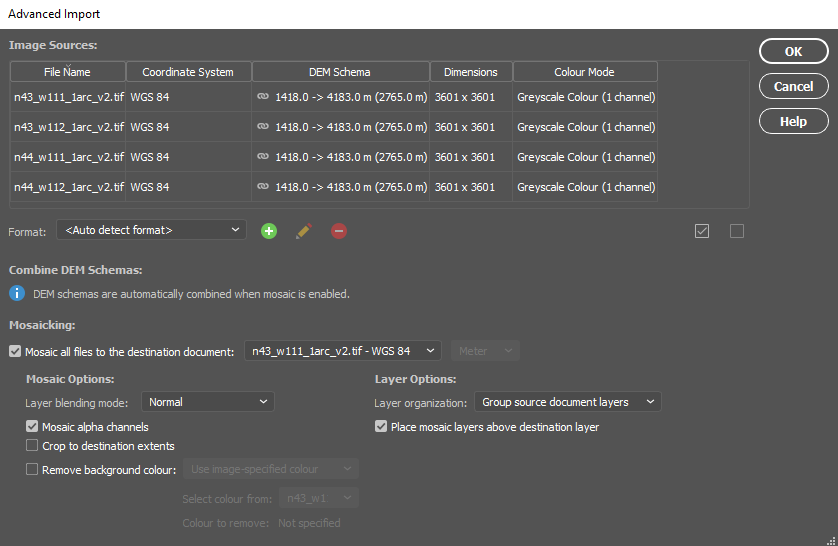
In our case, the elevation data for the area shown by the original 1899 topo-map is now represented by four separate DEM tiles, with roughly one tile for each quadrant of the map. To handle this problem, we can use the powerful Advanced Import tool within the Geographic Imager toolbar. The tool is a one-stop solution to easily import and mosaic our DEM datasets directly into Photoshop, all while retaining the spatial awareness we need to georeference or transform our data layers.

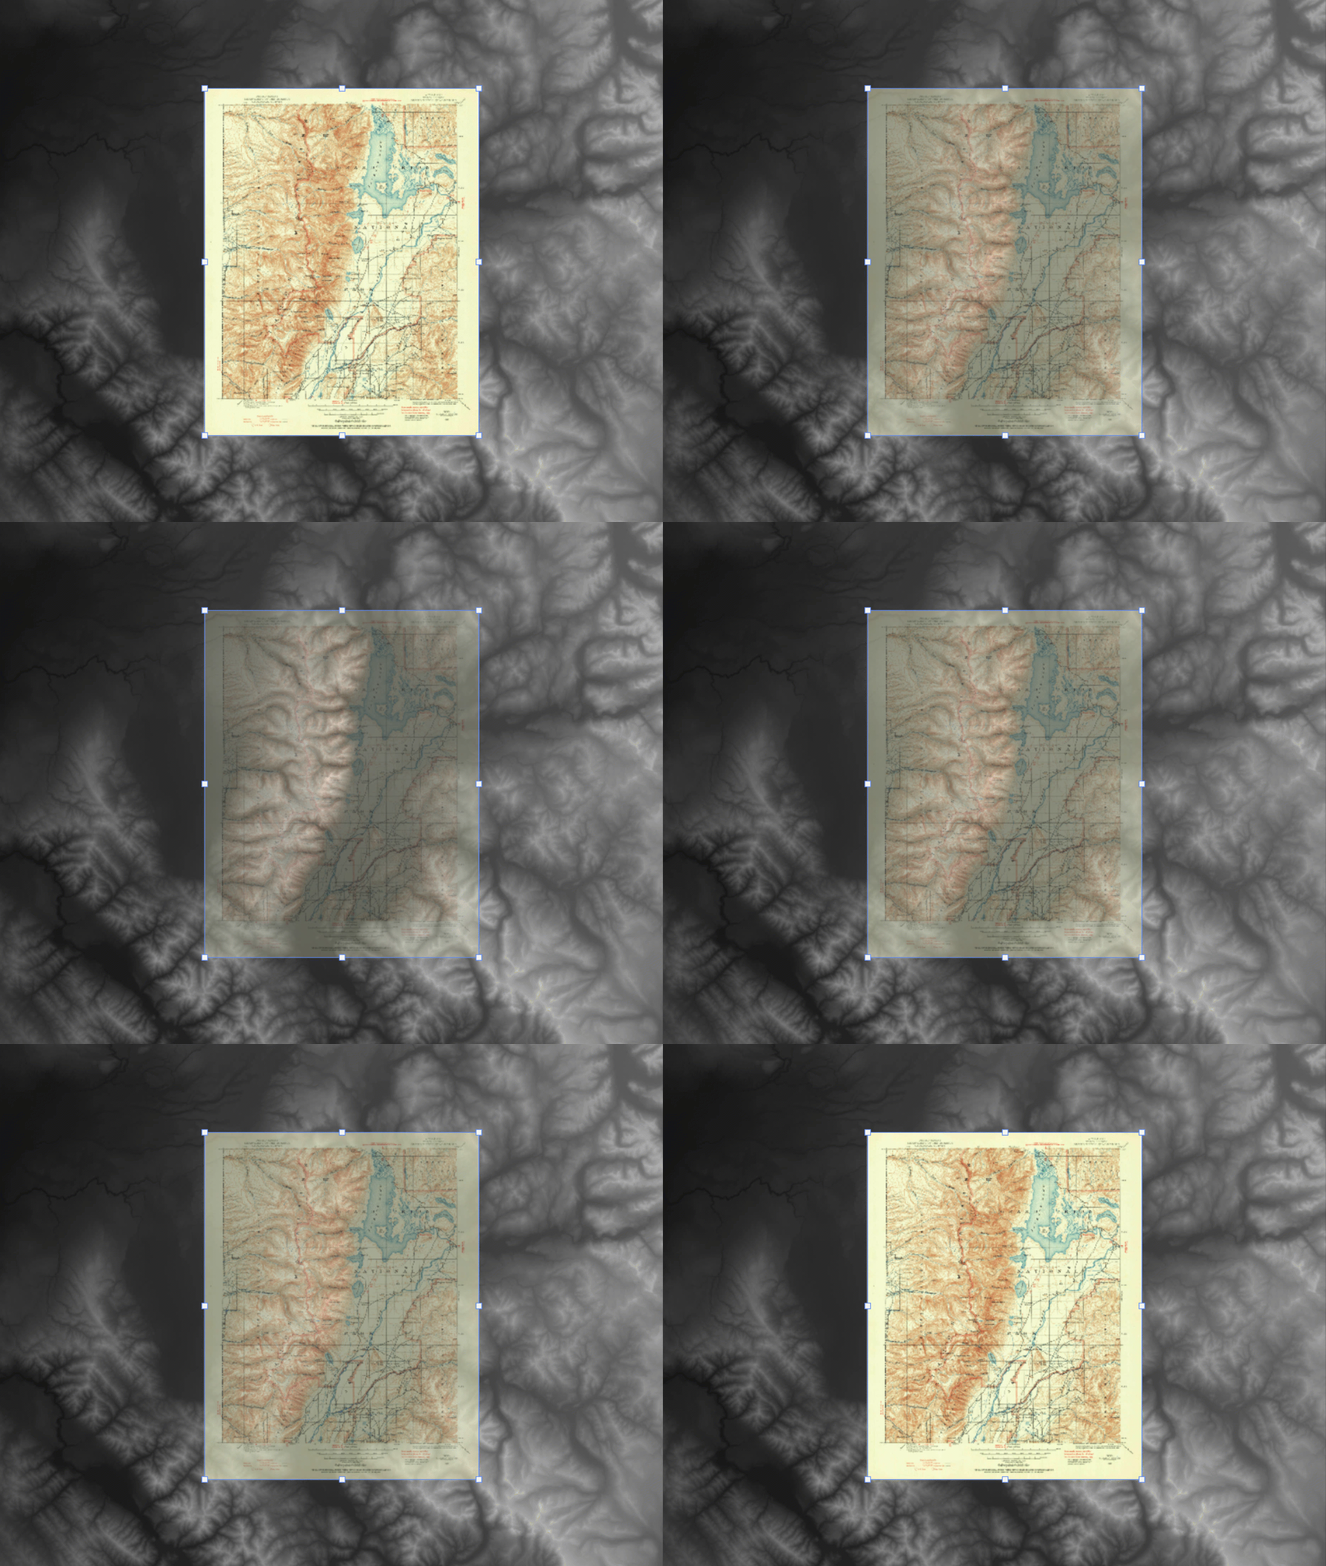
By combining each of the four raw DEM datasets, the tool will mosaic the tiles into a single merged, continuous, and geographically accurate elevation layer covering the entire extent of the map. Even more impressive is that Geographic Imager can use the spatial referencing information in the data to automatically align and overlay the original 1899 topo map onto the elevation layer, removing the need to perform manual georeferencing. (If the imagery data you are using does not have spatial referencing information already, don’t worry – our support team has crafted some excellent, easy to follow georeferencing in Geographic Imager tutorials).

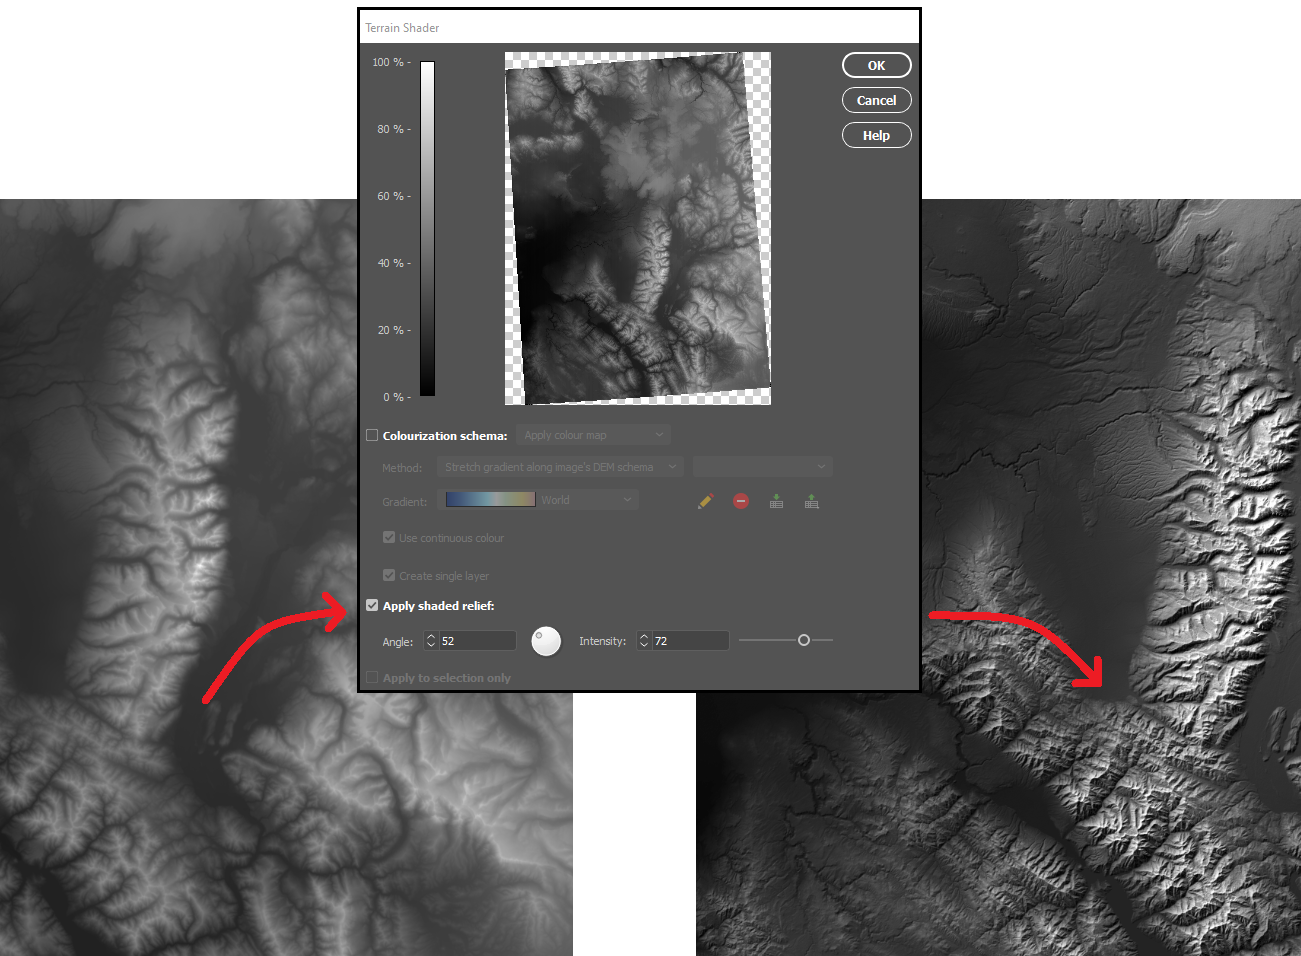
With our DEM data imported into Photoshop, we can start to explore different techniques for creating shaded relief. We will start by using the Terrain Shader tool located on the Geographic Imager toolbar. Terrain shader is a one-click technique to create simple shaded relief instantly. It allows you to configure the angle and intensity of the simulated illumination source to control the prominence and direction of casted shadows. Additionally, you can apply customized colour gradients to easily produce stylized elevation maps or apply hypsometric tints. 

In many situations, the Terrain Shader tool is an all-in-one, quick and easy way to create shaded relief. The output of the tool makes it easy to distinguish topographic features and can be used to quickly produce a shaded-relief backdrop for your map.

One of the greatest benefits of using Geographic Imager is that we retain all the imagery manipulation and spatial referencing capabilities of a GIS while still having access to the massive inventory of powerful image editing tools provided by Photoshop. This allows us to take our shaded relief technique up a notch by incorporating the advanced 3D rendering and lighting tools of Photoshop 3D to truly bring our 1899 Grand Teton survey map to life.

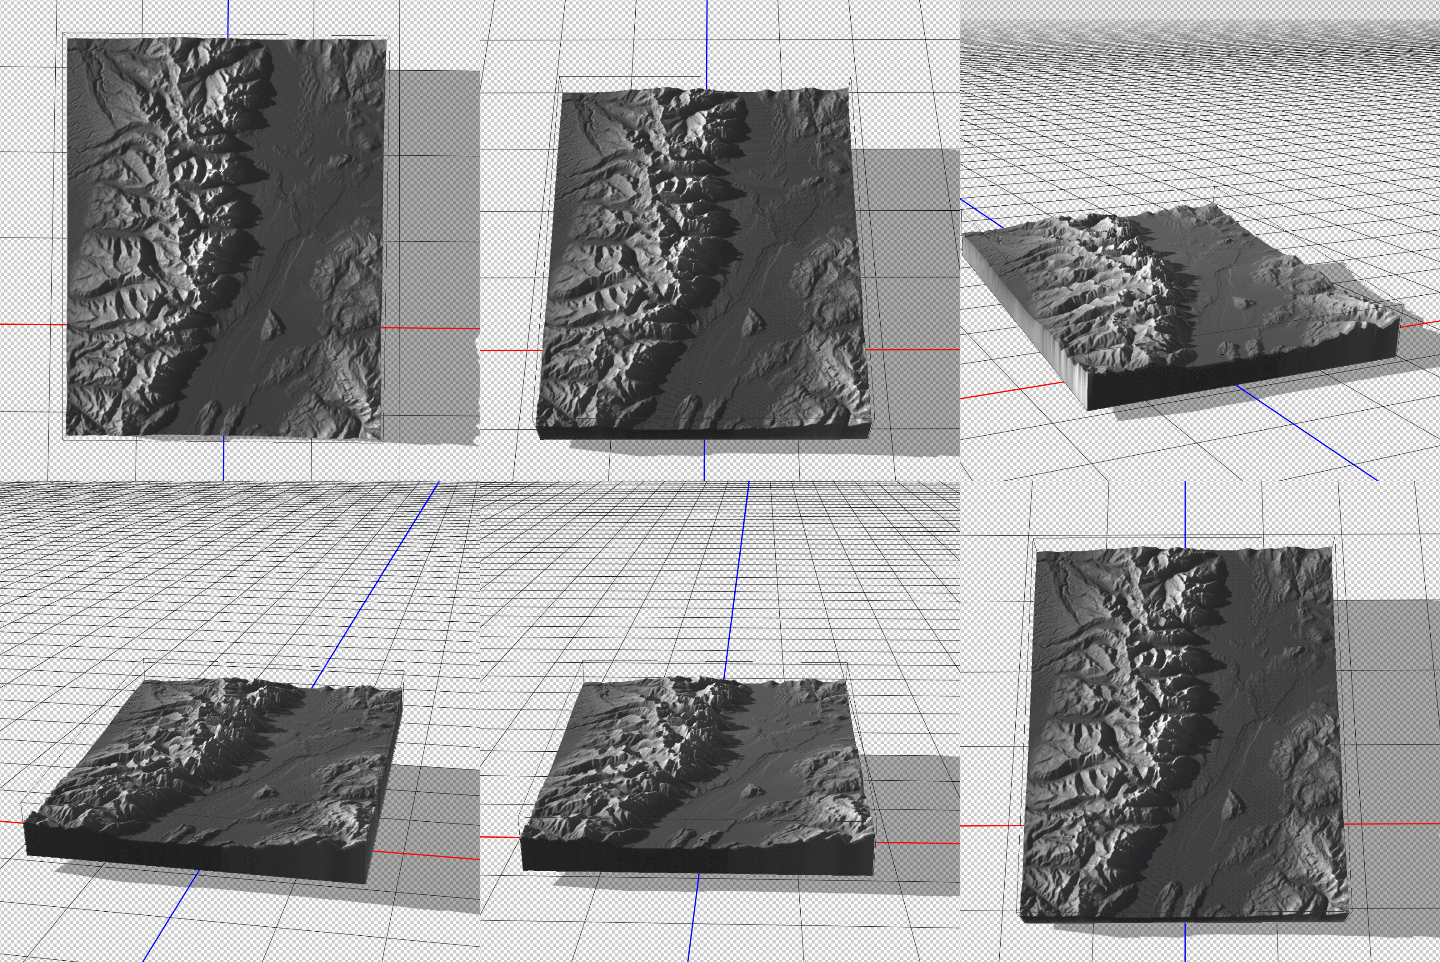
To start, we first need to trim the DEM layer down to our specific area of interest. We used the GeoCrop tool to crop our mosaiced DEM layer down to the exact extent of our topo map (it is important that both layers are the exact same extent – you’ll see why later). Next, we can open up the Photoshop 3D toolbar, and convert our flat DEM into an extruded 3D “Depth Map”. 

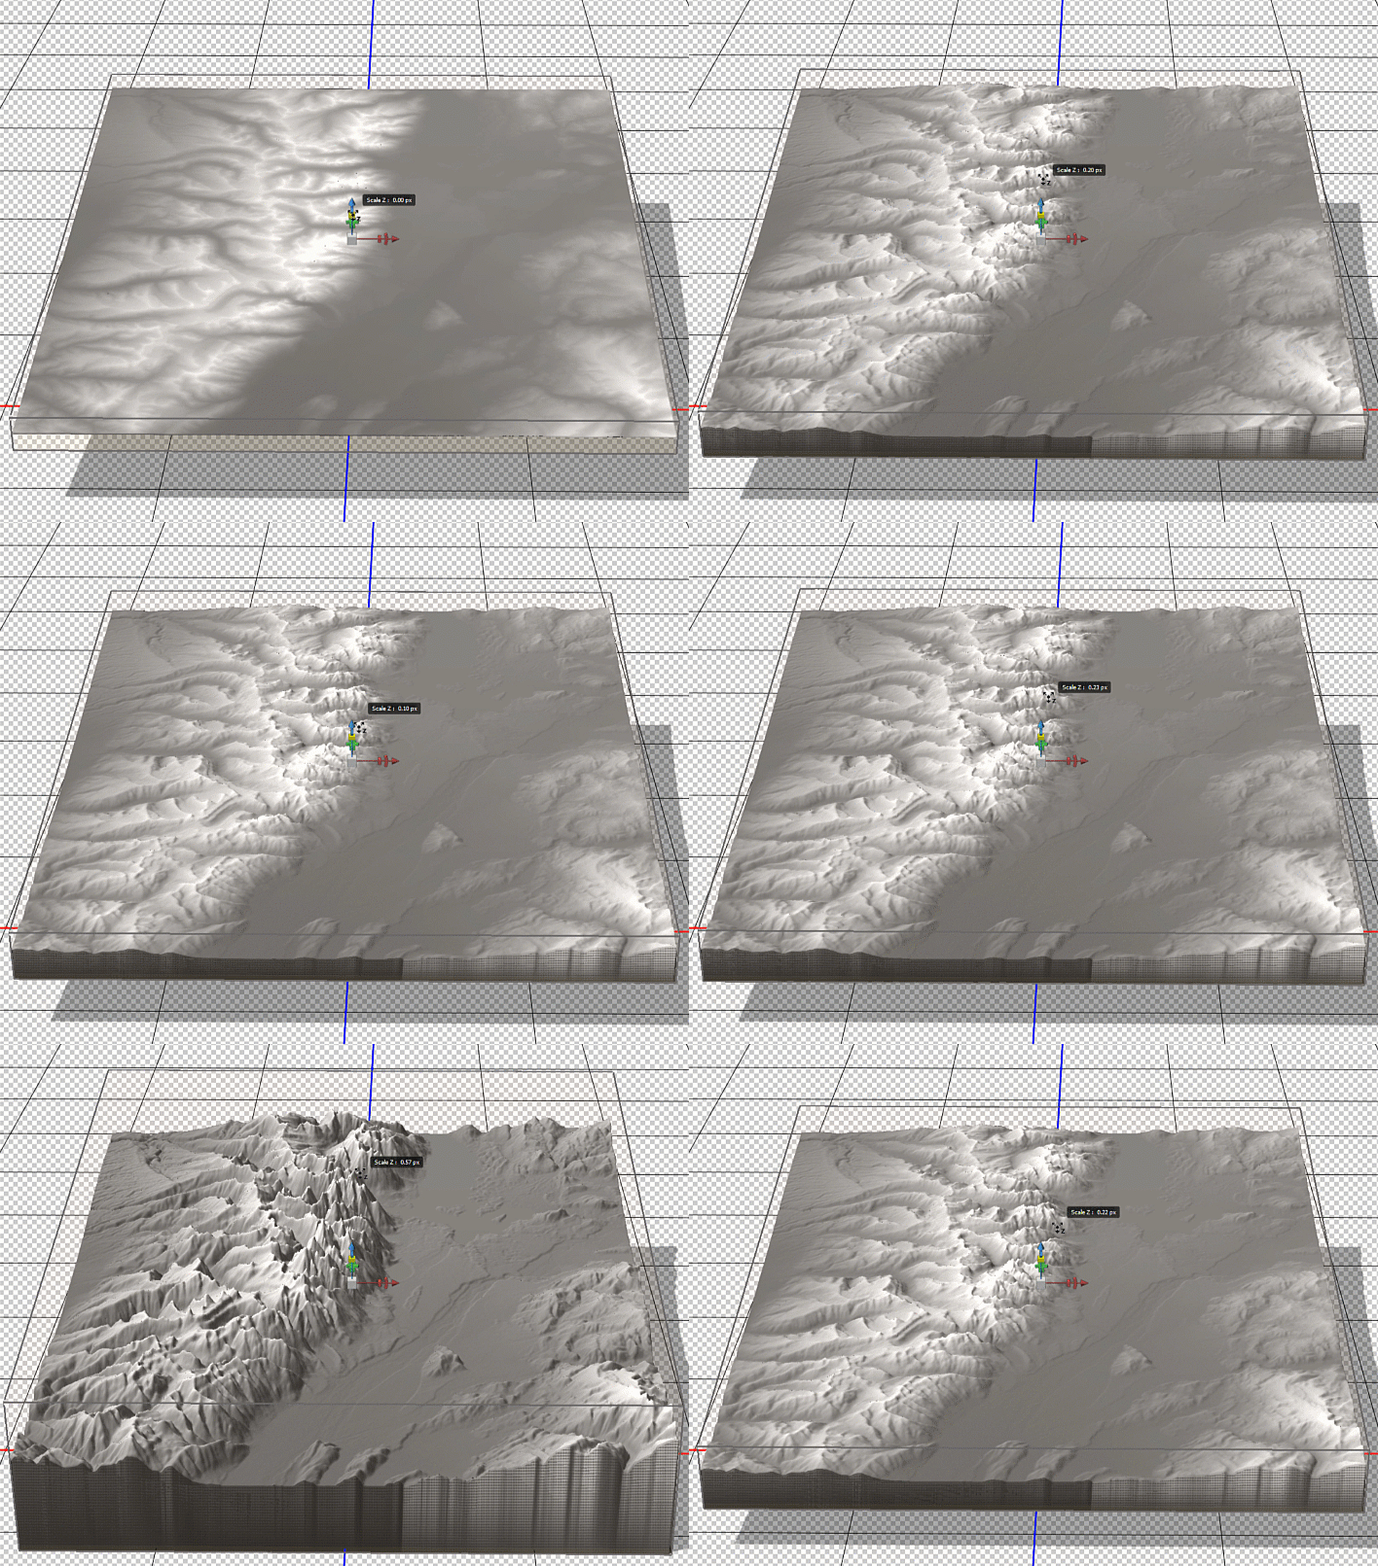
To enhance the shaded relief effect, we need to apply a vertical exaggeration to the model. In 3D mode, we can drag the z-axis scaling slider to exaggerate the prominence of the topographical features in our map. By creating vertical exaggeration, we can create more pronounced shaded relief, as canyons and lowlands will capture shadows more effectively.

In 3D mode, we can use the mouse cursor to pan and rotate our “camera” to get different perspectives of our elevation model. This can be useful for creating orthographic or oblique perspective map styles.

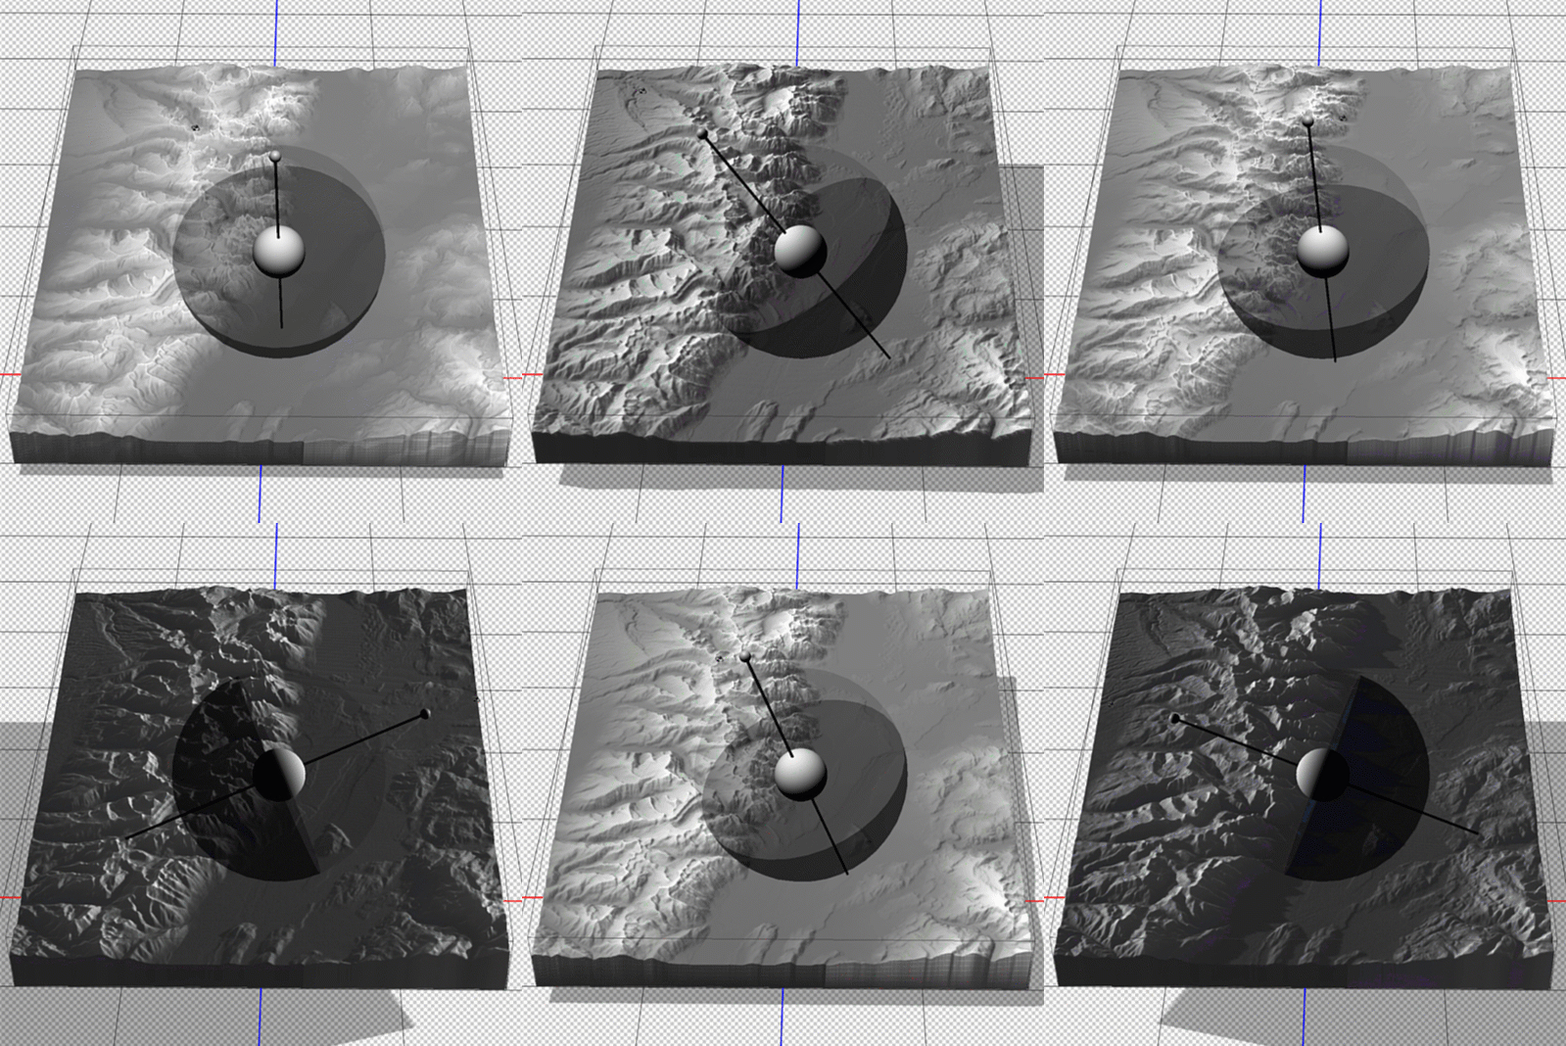
Now that we have a configured 3D model of our map area, we can apply our simulated illumination source. Much like the Terrain Shader tool, we can control the illumination intensity and angle of approach. Since we are working in a 3D environment however, we now have three different axes that control where our light is coming from. Notice how the angle is important for affecting the length and intensity of shadows in our relief map. This includes the prominent mountain silhouettes that can be created when we set the light source to approach from a low angle on the horizon.

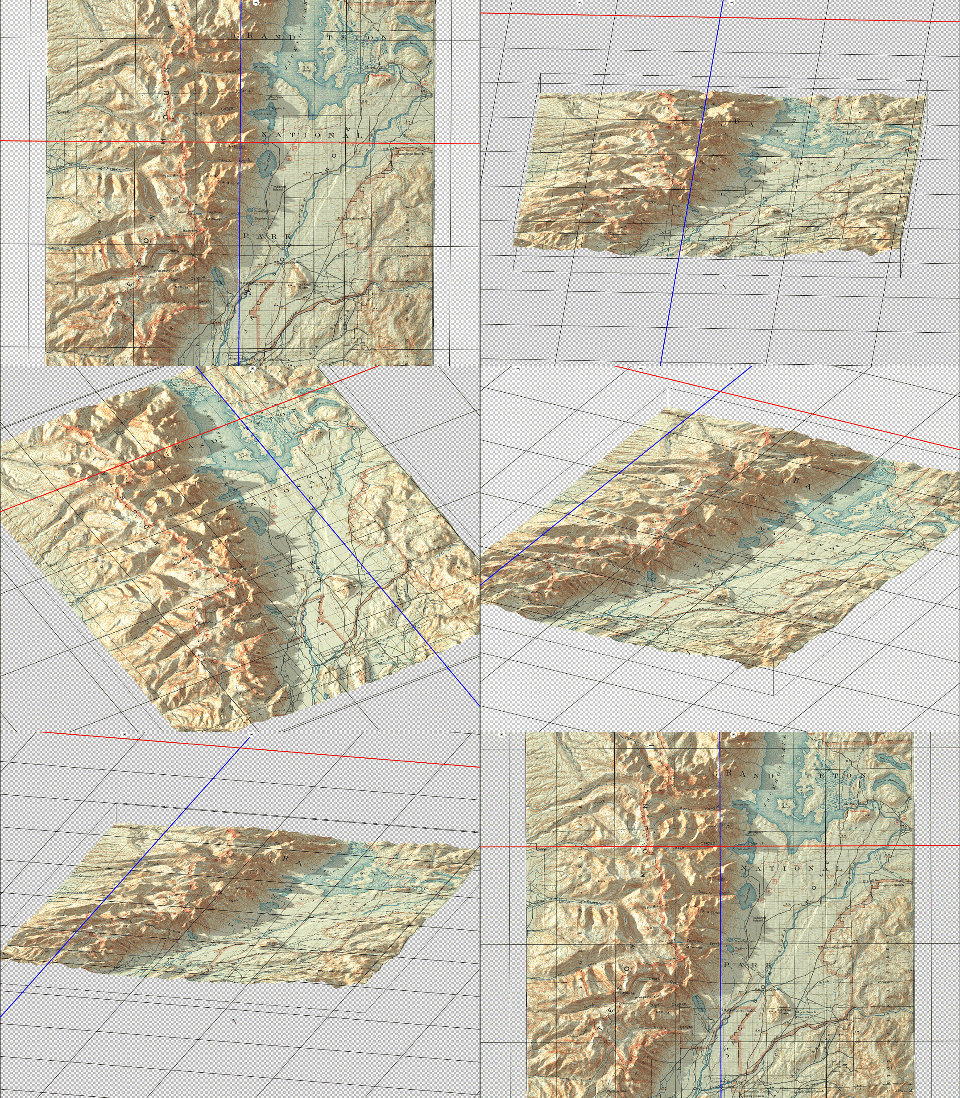
Next, we can configure the surface properties and apply a texture overlay to our 3D model. Experimenting with these settings changes how light interacts with the surface and can be refined to produce different relief shading effects. Using these surface properties, we can also drape the original 1899 Topo map onto our surface model (this is why it is important for both the DEM and the topo-map to share the exact same extent, otherwise the topo map will be distorted once it is draped over the surface).

Fine-tuning the map at this stage can take some time and experimentation. We can add some additional light sources with different casting angles and intensity to help create a multi-directional hillshade effect. We can also configure the light settings to produce softer, less pronounced shadows that look more realistic. After spending some time adjusting the lighting and surface settings, as well as configuring the camera view angle,  we can hit the “render” button and sit back while it creates a full-resolution rendering of our 3D model (this part can be very computationally intensive, and may require a high-performance machine to process efficiently).

Since we are still creating our map entirely within the Photoshop environment, we can immediately fine-tune the brightness, contrast, and colour of our map before exporting the final product. 

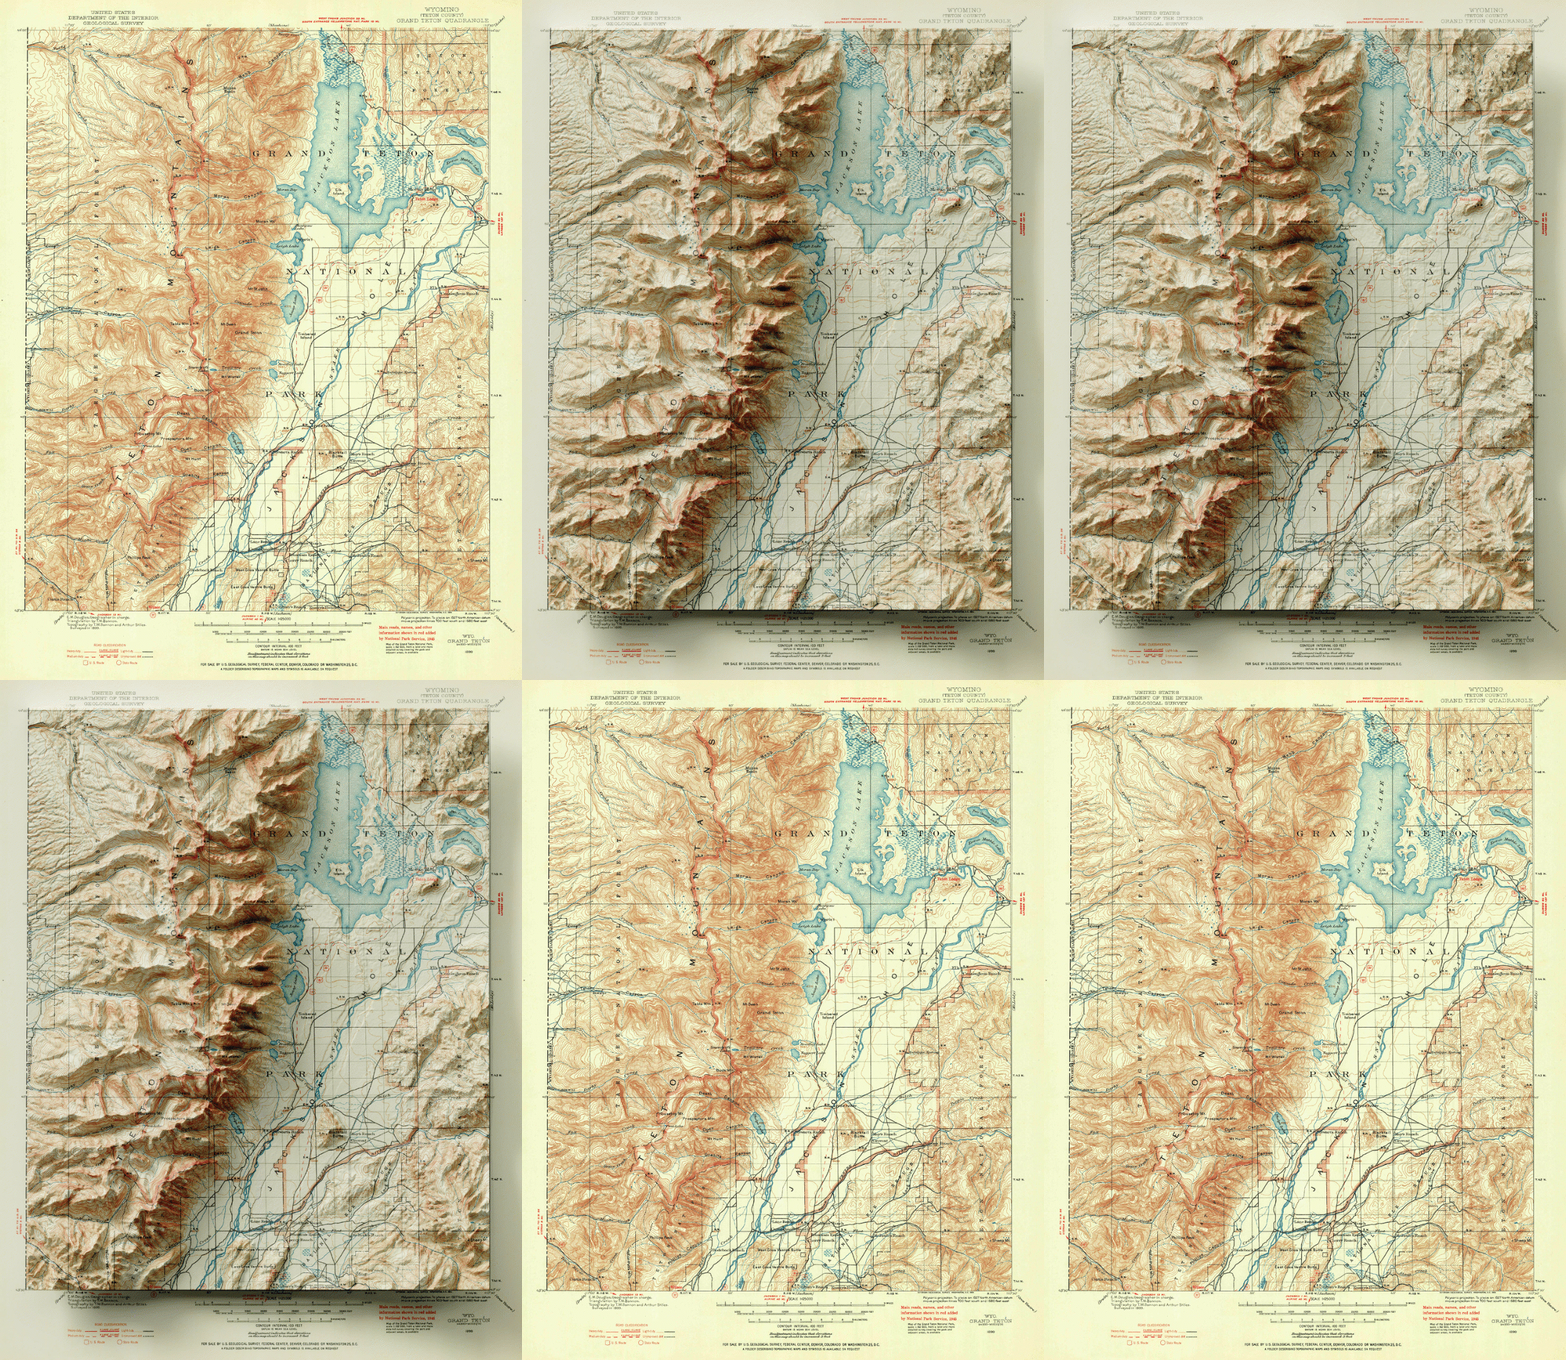
You can see some renders of the final map below. Thanks to the powerful spatial import and manipulation tools of Geographic Imager, and the ability to work entirely within the advanced image editing environment of Photoshop, we were able to create a dramatic 3D shaded relief effect that brings our 1899 USGS Grand Teton Survey map to life.

What’s New? Geographic Imager 6.1

Geographic Imager 6.1 is available now and in addition to full compatibility with Adobe Photoshop 2020, here are the other exciting new features to make working with spatial imagery in Photoshop even easier:

Vector Import from databases

Geographic Imager allows you to import a number of GIS vector formats directly on to your images in Photoshop. Whether performing a check to ensure accurate georeferencing, QA/QC or simply including supplemental data, this functionality allows you to improve the efficiency of your workflow. For a while, it was only possible to import vector data from your own files however we have added the capability to import from databases including PostGIS Spatial Database, and ESRI File and Personal Databases (.gdb and .mdb). Note that importing vector data from databases is only available in the full version of Geographic Imager.

Improved Mosaic Layer organization

When mosaicking documents in Photoshop with Geographic Imager’s Mosaic tools, you previously had the option to either group the layers from each document into folders or merge all layers into one single layer. In this new release, we’ve added a new option to merge source document layers which will flatten each source document into a single layer, but also keep each document separated in the destination, without the use of folders. This helps to keep the individual images separate while minimizing the number of layers and folders you need to deal with.

Improved mosaic layer

Geographic Imager 6.1 Improved mosaic layer

Improve Mosaic By Resampling Images in Geographic Imager

The Mosaic function in Geographic Imager merges multiple georeferenced images together to create a single composite georeferenced image. Though the goal of the mosaic is to create a single and seamless composite image, combining images with the Mosaic tool will often result in a slight shift of the imagery due to differences in the original pixel registration grid. This means that even when images are in the same coordinate system with the same spatial resolution, error can still be introduced because of a difference in the pixel alignment. Due to this, mosaicking processes in general tend to produce results that may be very close, but not exact. With this in mind, the results of your mosaic may be improved by resampling your images beforehand to the smallest unit of the resolution.

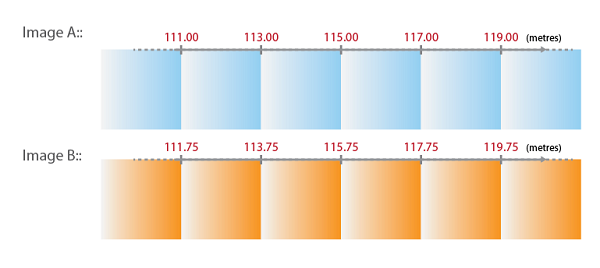
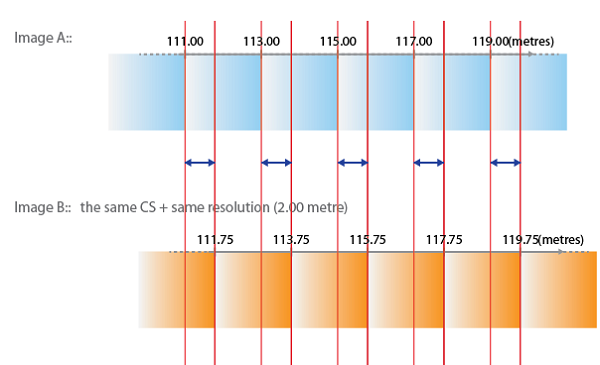
As an example, let’s say we have an image where the pixel size is 2.00 metres. When plotting the X coordinates of every pixel in this image (using the top left corner of the pixel), the X coordinate value will be incremented by the number/distance of the pixel size. For example, if the X coordinate values were to start at 111.00, then the next pixel would be 113.00, 115.00, 117.00, and so on. It’s important to note that these coordinate values are discrete, which means that the values could not be 113.22 or 115.77 because the origin of the coordinate in this case starts at 111.00 metres.

Now, we have another image that we want to mosaic with the first image. In this instance, the first image will be “Image A” and the second image will be “Image B”. Image B has the same coordinate system as well as the same pixel size as Image A.

Take a look at the X coordinates in Image A and Image B below:

We can see that the X coordinate in the top-left corner is different between these two images, and as previously mentioned, we know that the X coordinate values are discrete. When mosaicking Image B to Image A, the X coordinate cannot be 111.75 or 113.75. The coordinates must be 111.00, 113.00, 115.00, and so on, following the pattern of the pixel grid values in Image A.

This means that Image B will need to be “shifted” or “snapped” to the closest coordinates when the mosaic is performed, see below:

As a result, the X coordinate of Image B will be shifted by 0.75 metres (less than half a pixel). The pixel with X coordinate 111.75 is now placed at 111.00 and the next pixel with X coordinate of 113.75 will now be placed at 113.00, and so on.

With this in mind, the results of your mosaic may be improved by resampling your images to the “smallest unit of the resolution”. The smallest unit of the resolution can be determined from the difference in the coordinates (spatial alignment difference) between the two images.

Looking back at our example, we can see that the smallest unit of the resolution (represented by the blue arrow) in this case is 0.75 metres – this is the value we will use to resample our images.

Once the images have been resampled to 0.75 metres, we may go ahead with our mosaic.

The above example demonstrates the possibility of a pixel shift after a mosaic for two images with a different pixel alignment. It should be noted that this example explains the problem in one-dimension (looking at only the X coordinate) when the image in reality is in two-dimension (looking at both X and Y coordinates). The basic principal of the pixel shift in 2D is the same, but it would include the direction of the shift when mosaicking images. In addition, it’s important to keep in mind that although resampling your images to the smallest unit of the resolution will improve the final mosaic, this is not always an efficient process when mosaicking with more than two images. Another thing to remember is that resampling your images will make your file size much larger. However, in cases where high precision is desired, resampling the images beforehand is a process that should be considered.

Geographic Imager 3.2: Introduction to Terrain Shader, Part 3 – Applying Terrain Shader to multiple DEM files

If your workflow involves Terrain Shader, specifying a DEM schema is an important step, especially when dealing with mulitple DEM files.

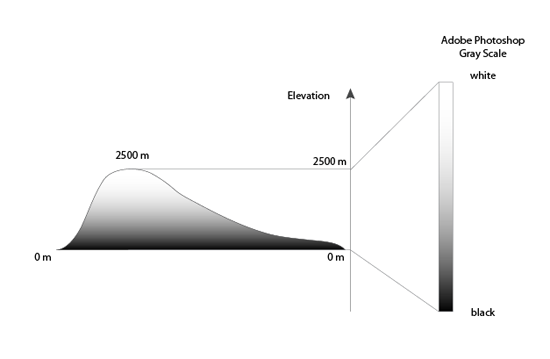
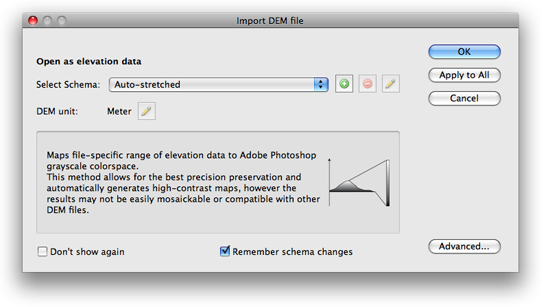
When importing a single DEM file, Geographic Imager converts elevation values to gray scale values. For example, if the elevation range in your DEM file is between 0 and 2500 meters and the “Auto-stretched” option is selected, this range will be converted to the Adobe Photoshop gray scale range between black and white. As shown below, the black color is assigned to the lowest elevation value (0 meter) while the white color is assigned to the highest elevation value (2500 meters). For elevation values between 0 and 2500, Geographic Imager calculates and converts them into gray scale.

Import DEM File - Auto-stretched

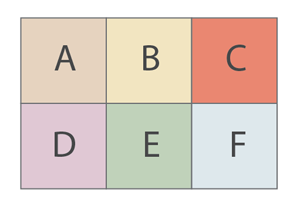
In this example, we’ll use six DEM files of one geographic region. Many datasets are distributed as tiled DEM files. Each of them is next to each other and the goal is to create a colorized DEM image from those six files.

Collected 6 dem files

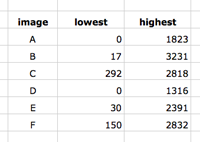
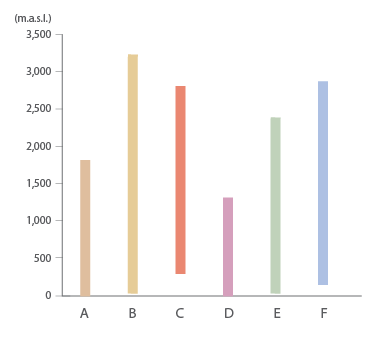
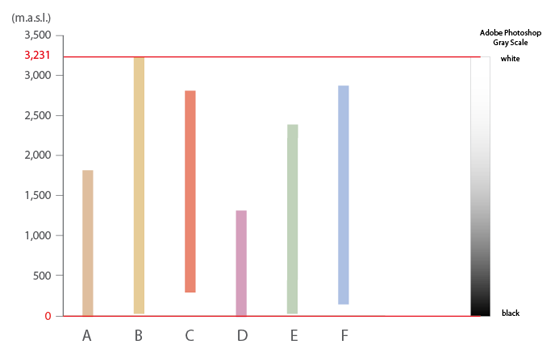
When dealing with multiple DEM files, you will need to consider the elevation range of the each DEM file. In other words, the elevation range in each DEM file will be slightly different.

table: elevation range in each DEM file Chart: Elevation range in each DEM files

Option 1: Using the “Auto-Stretched” option for multiple DEM files

When importing multiple DEM images and using the “Auto-stretched” option, click “Apply to All”…

Dialog window: Import DEM file - auto stretched

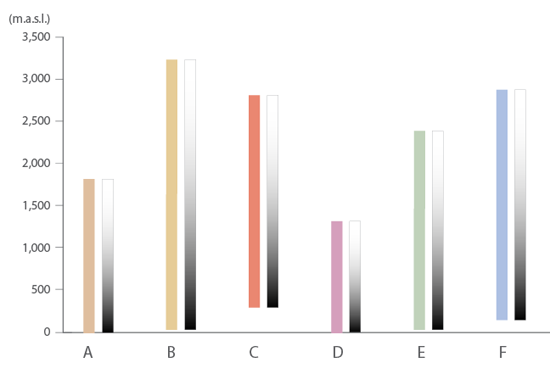
Every one of the DEM images will be converted to the gray scale between black and white.

graph: stretching the gray scale to every image file

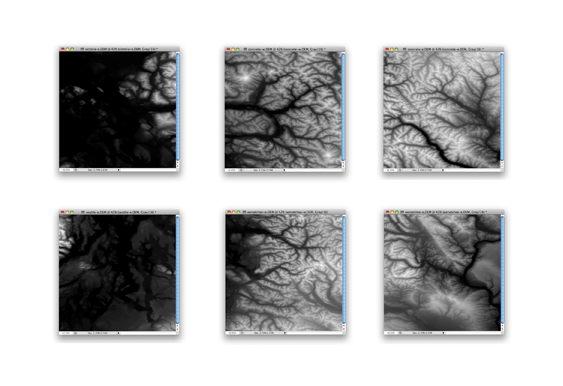
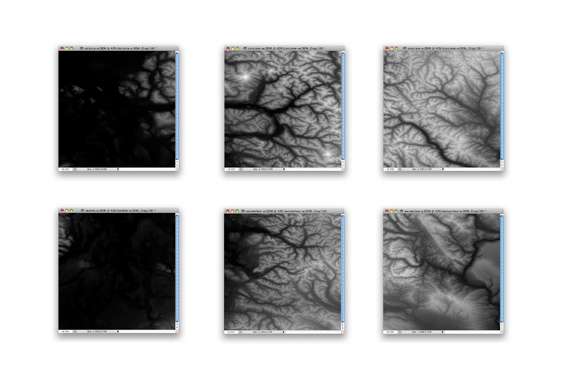
As a result, you can get the maximum contrast in each image. However, you will not be able to mosaic or apply Terrain Shader to those six images because each DEM has slight differences in elevation and an all encompassing schema like the”Auto-stretched” option will not work.

DEM images opened with Auto-stretched

Option 2: Creating a DEM schema by specifying a range

In order to apply Terrain Shader to multiple DEM files, you will need to assign one DEM schema to each DEM image you would like to share the same schema.

Step 1: Identify the elevation range amongst multiple DEM files

Explore the DEM files and find out what the elevation range is for each one. Then note which are the lowest and highest values among all DEMs. For this example, the lowest elevation is 0 m and the highest is 3,231 meters.

Finding the range among multiple DEM files

Step 2: Create a new DEM schema for your dataset

Choose File > Open and select multiple DEM files. Once the Import DEM file dialog box is open, click the Add button to open the “Edit DEM Schema” dialog box.

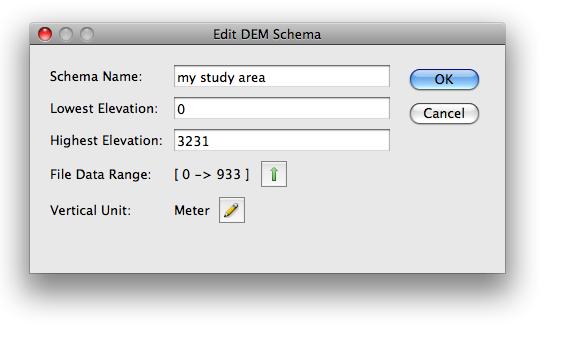
Create a new Schema name (e.g. “my study area”). Simply enter the lowest and highest elevation value found in Step 1.

Dialog window: Edit DEM Schema - specifying the range for the DEM schema

Step 3: Apply the DEM schema to your datasets

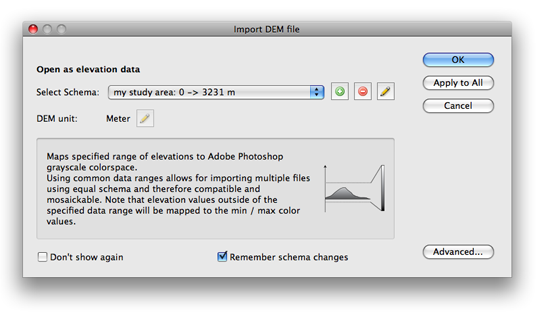
When you’ve created a new DEM schema, it will be available in the “Select Schema” drop-down list. Choose the new schema and click “Apply to All”. This selected schema will be applied to all the DEM files being imported.

dialog window: Importing DEM file with the same schema

After the import process is completed, the images are ready for Terrain Shader.

All the DEM files imported with the same DEM schema

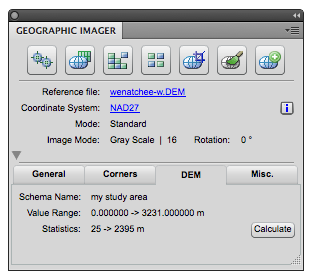
When one of the imported DEM file is the active document, click the “DEM” tab in the Geographic Imager panel. It shows the DEM schema name, the DEM value range, and the actual elevation value available in the currently active document. Click the “Calculate” button if you do not see the statistics (actual elevation value range of the active document).

Geographic Imager Main Panel

Step 4: Apply Terrain Shader to your DEM files

Since each DEM has a schema, a mosaic can be perfomed and then Terrain Shader can be applied to the mosaicked iamge.

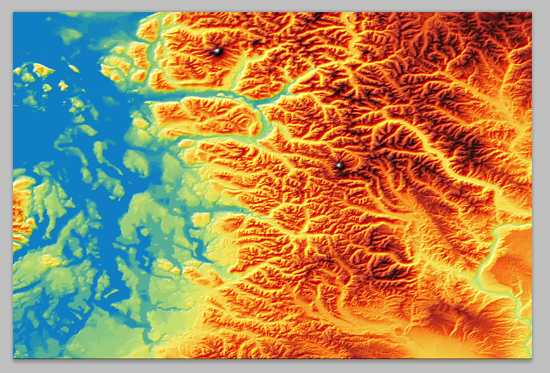
DEM files mosaicked and Terrain Shader effect is applied

News Archive