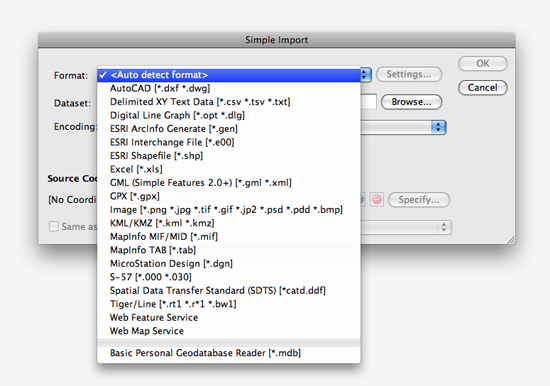
Adobe Illustrator documents with GIS data can be exported to georeferenced PDF files thanks to the MAPublisher Export Geospatial PDF feature. A geospatial PDF is an Adobe Acrobat file that contains geospatial coordinates. With coordinates, users can view and interact with the PDF to find and mark location data. MAPublisher exports all the MAP Attributes data in an Adobe Illustrator document into the geospatial PDF. Attribute values can subsequently be accessed and searched in Acrobat 9 (and 8 with limitations).
In order to ensure the best interoperability and geospatial PDF output results from your MAPublisher documents, the following work practices are recommended:
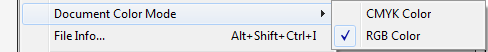
Convert document color mode to RGB
To ensure predictable color results, it is highly recommended to convert the documents color mode to RGB prior to exporting to Geospatial PDF. This is advisable especially if generating geospatial PDF documents to be used in conjunction with the PDF Maps app for IOS devices. The document color mode can be changed in Adobe Illustrator through File > Document Color Mode > RGB Color.
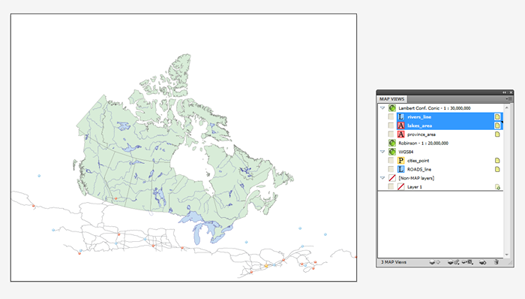
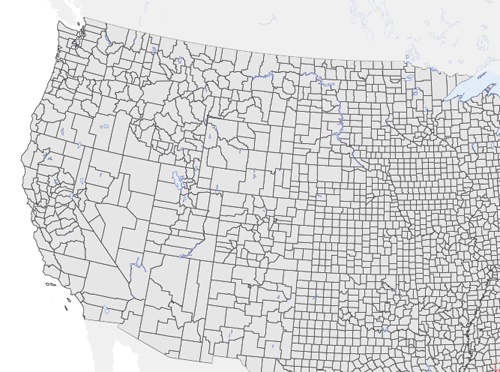
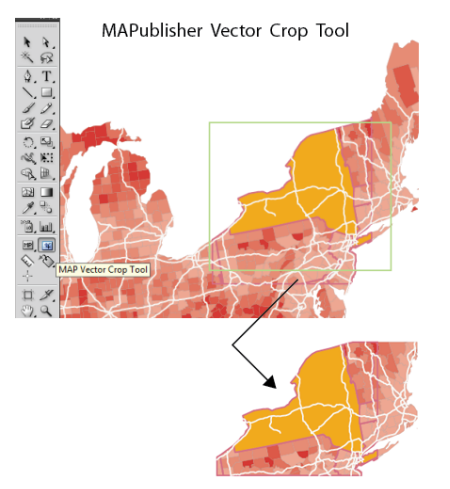
Crop data to the required extents using the MAP Vector Crop Tool
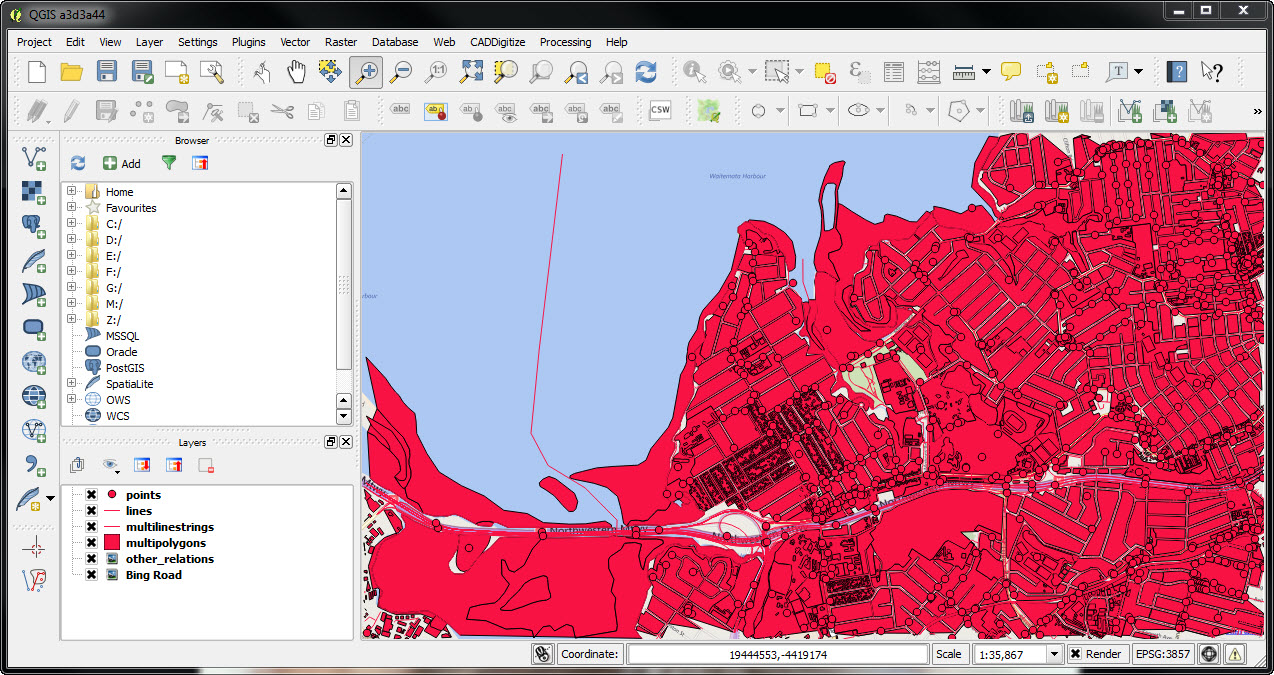
Remove any extraneous data not required for the geospatial PDF document by cropping the map using the Vector Crop Tool (located in the Adobe Illustrator Toolbar). If necessary, exclude data from being cropped by locking the its the appropriate layers.
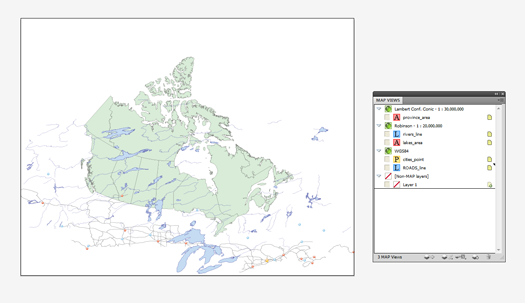
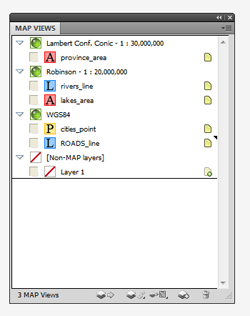
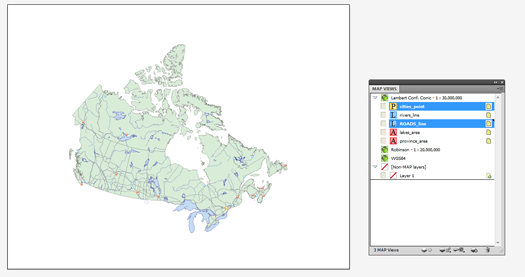
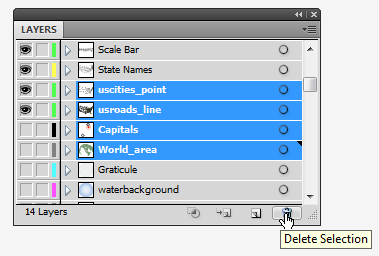
Remove unnecessary layers
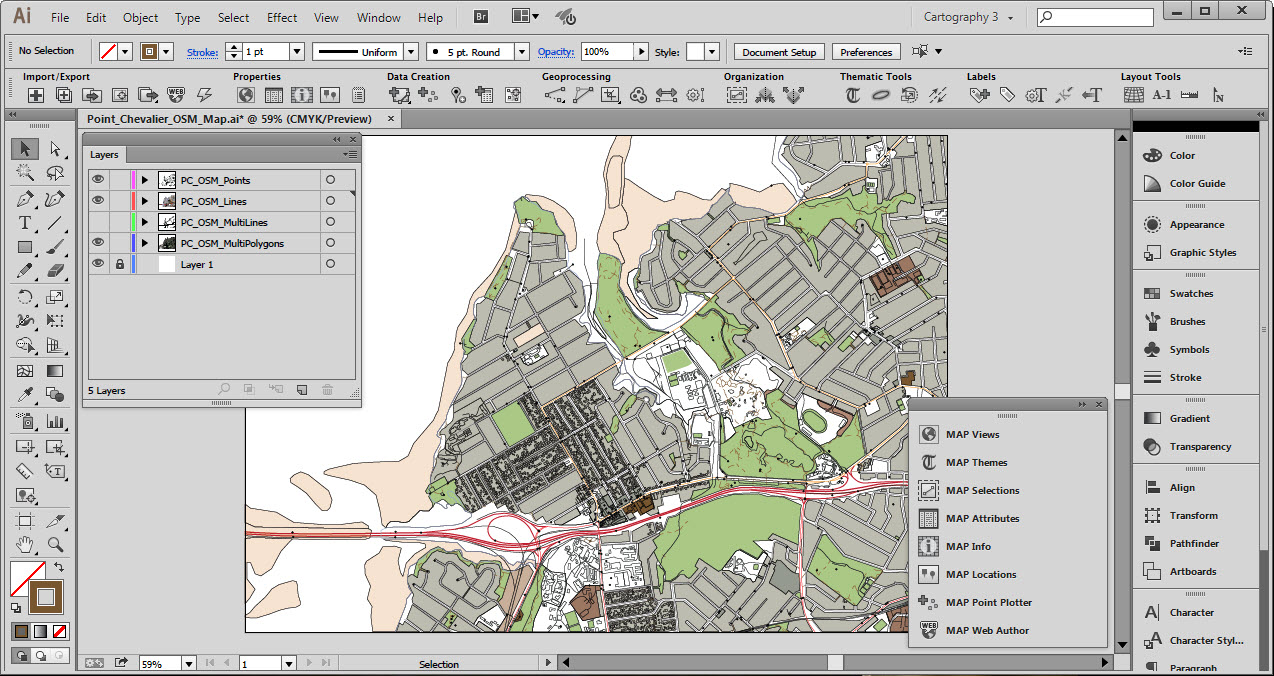
Delete any map layers that are not required for the final PDF map document. This may include raster layers, hidden layers, and layers that are outside the mapping extent or art board. Not only will this decrease file size, it will also simplify your layers list and improve organization. Delete layers in the MAP Views panel or the Layers panel.
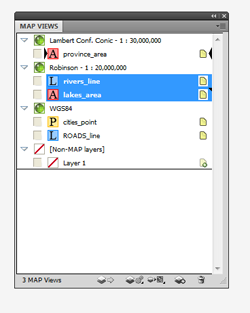
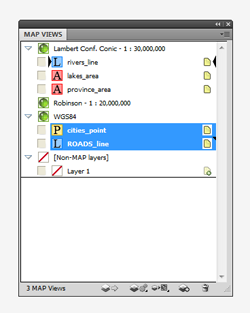
Preserve data contained within sublayers
If your document contains map data organized within sublayers it will be necessary to reorganize/move this data to it’s parent layer if you wish to preserve it when converting to and from geospatial PDF. This is necessary because data contained on sublayers are forced into their parent layer by the Adobe Illustrator PDF exporter. Layers are also required for importing a geospatial PDF back into MAPublisher in order to assign a schema.
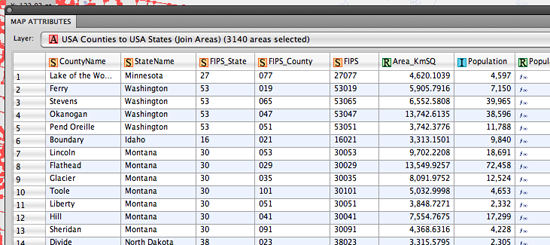
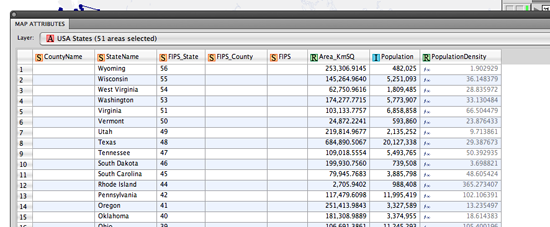
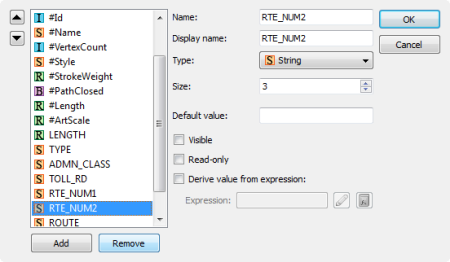
Remove unused attribute information
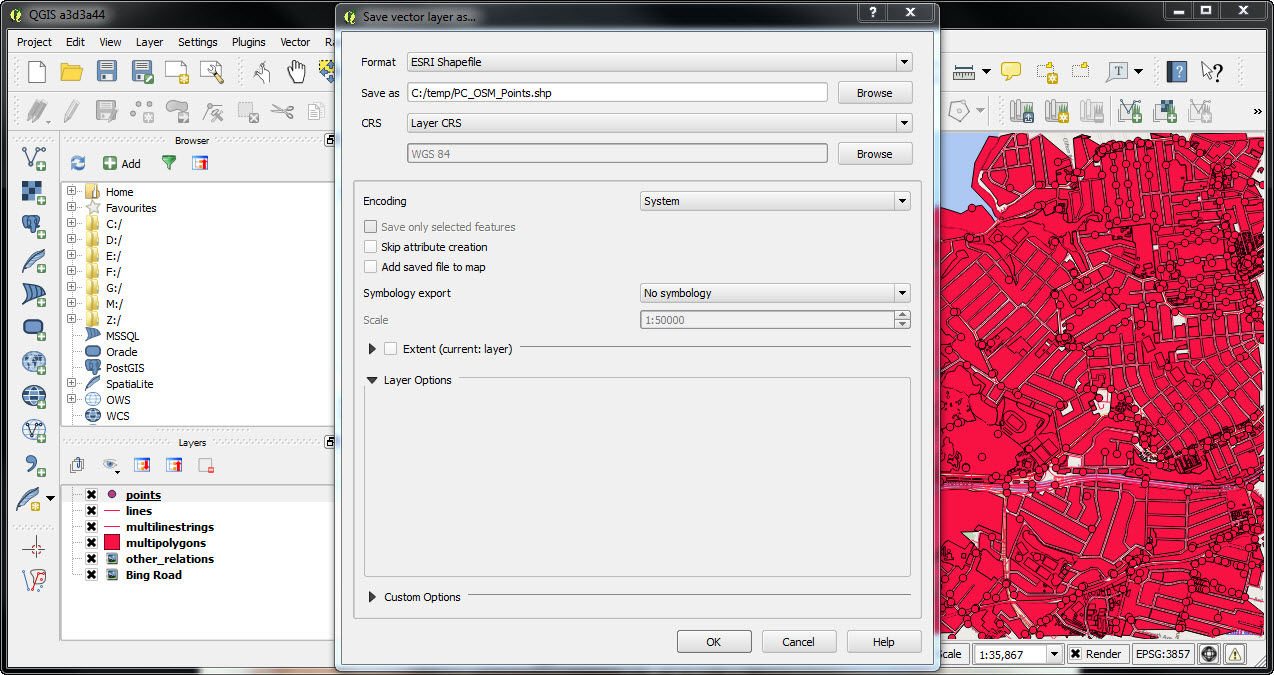
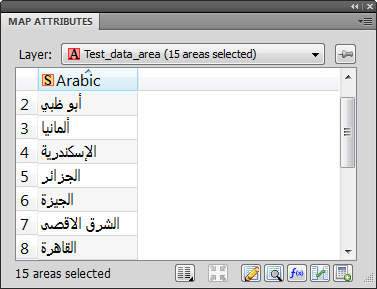
Data sets, especially those available through various data portals and government agencies can contain attribute information not suited or required for our mapping need, or perhaps we are only interested in the geometry of the data for representational purposes. In this case it is advisable to delete any attribute information that does not fulfill a purpose as this will unnecessarily increase the resultant file size. Select your data, open the MAP Attributes panel, and click the Edit Schema button. You may delete and organize your attributes using this panel.
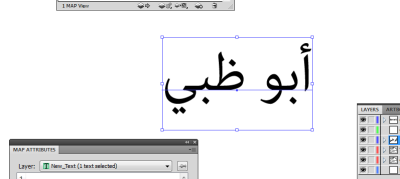
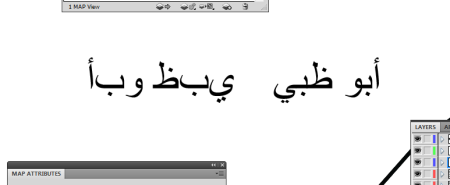
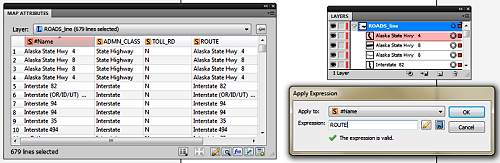
Assign MAPublisher attributes to Adobe Illustrator Object names
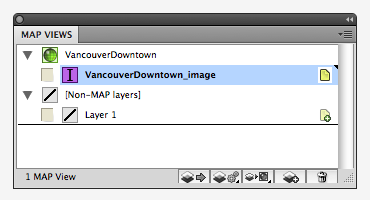
This recommendation is not necessary but may be useful in some cases. In MAPublisher the #Id attribute column is a unique identifier MAPublisher uses internally to associate attributes with unique pieces of art. By default the art will have a name of “path” or “compound path” however it may be desirable to tag the object with a unique identifier from an existing attribute column for the purposes of making it easier to differentiate art objects within the Acrobat tree list, for example.
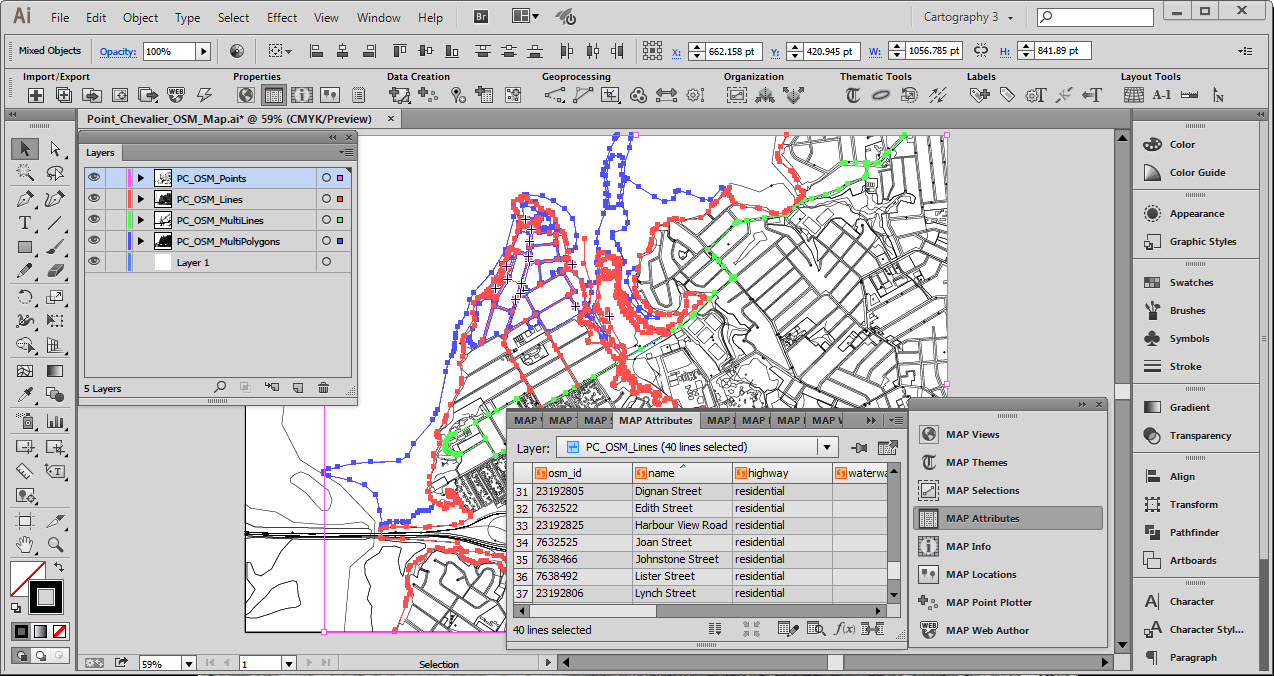
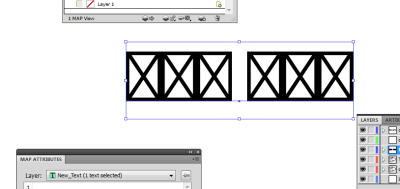
To do this we can use the “Apply Expression” option in the MAP Attributes panel. Simply designate the #Name column as the “Apply to” option while entering the name of the attribute column you wish to derive the attributes from as the “Expression”. For example in the screeshot below we are renaming the art objects contained in the #name column with values stoed in the “ROUTE” column with the results being reflected in the artwork listed in Illustrator Layers panel.
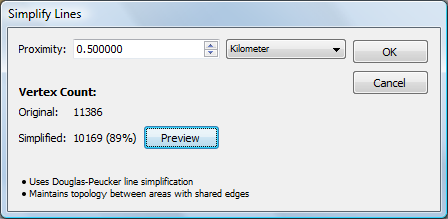
Use the Simplify Line Tool
Reduce the number of vertices available in MAP Line and Area layers by using the Simplify Line tool (located on the MAPublisher toolbar). This differs from the Adobe Illustrator Simplify Path tool because it takes into account X and Y coordinates. The proximity value or simplification tolerance is based on the vertical difference between the begin-end line and points off a line, not the distance between anchor points on the line.
Geospatial PDFs derived from or include images should be generated as 72 DPI
This has particular relevance when dealing with geospatial PDF files, especially those generated with Geographic Imager. When a 200 DPI (dots per inch) georeferenced image is converted to a geospatial PDF, the image will be embedded in the PDF as a 200 DPI image. However, when displayed by PDF viewing applications such as Acrobat or Illustrator it will appear as a 72 DPI image. Due to this, on export, MAPublisher converts the referencing to 72 DPI format since it must be imported back as 72 DPI
Following the above recommendations should help ease the transition of your MAPublisher documents to and from geospatial PDF.