My Account     Contact Us     Cart

Update Your Legends (Even Existing Ones) Using Automatic Legend Update

With the release of MAPublisher 10.1, you no longer have to worry about recreating map legends every time you update them. Automatic Legend Update, available in the latest release, now allows for simple updating of an existing legend. Automatic Legend Update lets you update attribute data, or change the symbology/classification method/attribute field that is linked to a legend, and automatically have the legend update to reflect these changes – no more having to recreate the legend each time you want to change something! This is possible even with MAP Themes and Legends created in older MAPublisher versions once they are brought into the 10.1 environment.

In this blog, we’ll discuss how to open MAP Themes and Legends created in older versions of MAPublisher in the 10.1 environment in order to transform them into Automatic Legend Update. This example classifies populated places in Hawaii based on elevation. We will use the ‘Create MAP Theme Legend’ tool to create a copy of the legend, which by default will be set to automatically update. Any future changes applied to the associated MAP Theme will automatically be applied to the new legend.

Step 1

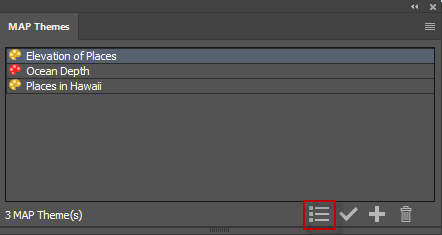
Open the MAP Themes panel from the MAPublisher toolbar. With the ‘Elevations of Places’ MAP Theme selected, click the ‘Create MAP Theme Legend’ button to create an Automatic Legend Update.

Step 2

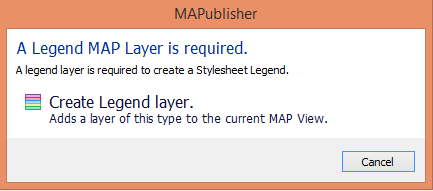
You’ll be prompted to create a Legend layer if you don’t already have one. Click ‘Create Legend Layer’ to continue.

Step 3

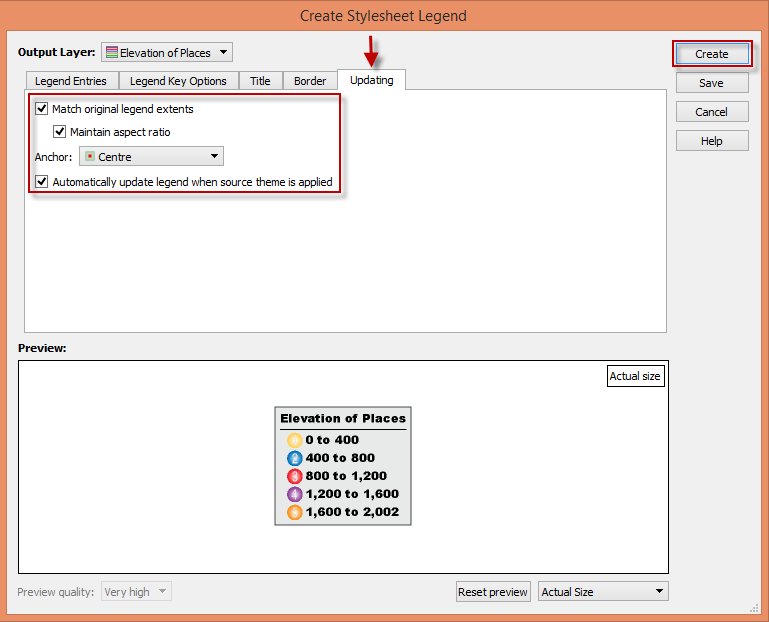
Note the legend in the ‘Preview’ section and how the legend styling and symbology are preserved, thus saving time. Click the ‘Updating’ tab to see or change your Automatic Legend Update settings. The “Automatically update legend when source theme is applied” checkbox is checked by default. In this blog, we’re also going to check the option to “Match original legend extents” to maintain the size and extents of the legend so as to not change the map layout when items are added to the legend. Instead, the legend elements will change size in order to fit within the existing legend extents. “Maintain aspect ratio” is checked to make sure that the legend elements resize proportionally and a ‘Centre’ anchor allows the resizing to start from the centre of the elements. Once you’re satisfied with your settings, click ‘Create’.

This will create a new legend with Automatic Legend Update that can be moved to any location on the map.

Now that you have created a copy of the legend with Automatic Legend Update, your legend will update when changes are applied to the associated MAP Theme.

A legend characterises a map and MAPublisher 10.1 helps to keep it up to date.

MAPublisher MAP Themes: Assign Symbology and Styles upon GIS Data Import

With MAPublisher 8.6 or higher, you can apply styles to GIS data upon import using the MAP Stylesheet Auto Assign feature.

MAP Theme Auto Assign  upon import

You will need to prepare MAP Stylesheet theme(s) and set the Auto Assign settings within every stylesheet. In this example, there is only one stylesheet.

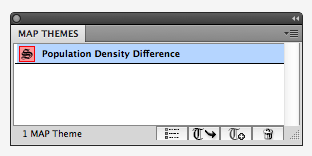
MAP Theme Panel

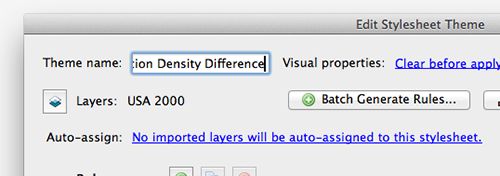
In the “Edit Stylesheet Theme” window, there is a link to click next to the “Auto-assign” right below the layer option. Once you create all the rules for stylization using attribute values, click the link to open the Auto Assign Layers dialog window.

MAPublisher MAP Theme Auto Assign: link

MAPublisher will check the layer name of all the layers being imported if the Auto-Assign Layers settings are made. In this example below, one layer named “USA 2000.shp” will be imported. There may be other layers called “USA 2001.shp”, “USA 2002″…. and so on. There is a pattern in the layer name among the layers to be imported. We will specify here “Start with” for the Type, and “USA” for the Layer Name Match option.

MAPublisher MAP Theme Auto Assign

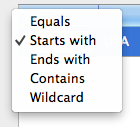
For the Type option, there are five: Equals, Start with, Ends with, Contains, and Wildcard. All my layers start with “USA” in the example above.

MAP Theme Auto Assign: Layer name pattern option

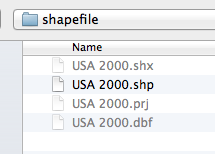
Let’s import one layer called “USA 2000.shp” (you can import mutiple layers at once, of course).

Importing a shapefile for an example

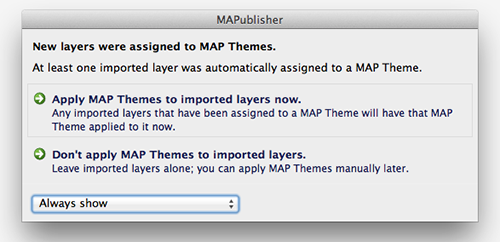
If the Adobe Illustrator document has this Auto-assign setting ready, MAPublisher will detect it and it will give you an option whether or not you would like to apply the styles to the layer(s) being imported. We’ll click the first option “Apply MAP Themes to imported layers now”.

MAP Theme Auto Assign window upon import

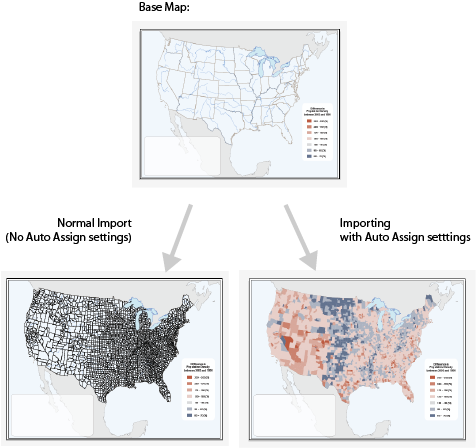
As a result as shown on the very top screencapture image, every polygon in the layer “USA 2000.shp” is stylized with the rules available in the MAP Stylesheet theme upon import.

MAPublisher Dot Density Maps

Dot density themes are sometimes called dot distribution maps because they show where particular data characteristics occur. It uses dots or other symbols to represent the number of occurrences of a given data characteristic in a particular location. Starting at MAPublisher 8.4, the ability to create dot density maps is available through the provision of Dot Density Themes.

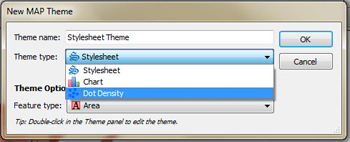
When creating a new MAP Theme simply choose “Dot Density” from the available theme types. The creation of a dot density theme is facilitated through the MAP Themes panel. The dot density theme is an Adobe Illustrator effect applied to an area layer.

Item 2: Coordinate system of the map

As dot density maps are most useful for showing where particular data occur, they may only be generated for MAP Area type layers. Most often, symbols are used to represent data occurring within a bounding polygon such as a census tract, zip code or county polygons.

Item 2: Coordinate system of the map

Dot density effects are created on a per layer basis, based on various user defined settings. Data ranges can be determined from selected attribute columns and then a dot value can be assigned a corresponding symbol at which point MAPublisher will map the appropriate results. Users may apply default symbols or load custom ones based on Illustrator symbol sets

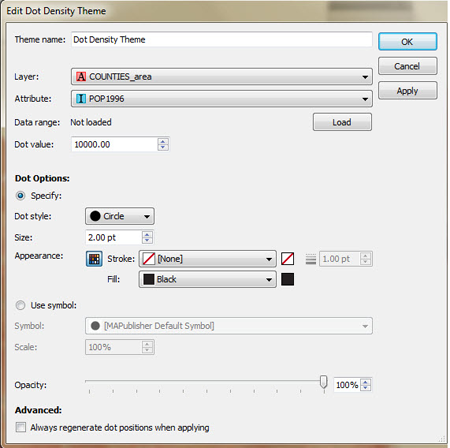
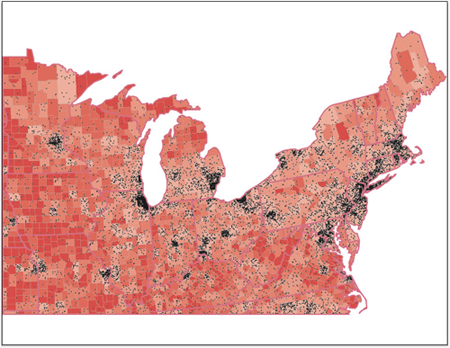
In this example, population tallies per county have been loaded, assigned a dot value of 10,000 with a designated symbol of a 2pt black dot.

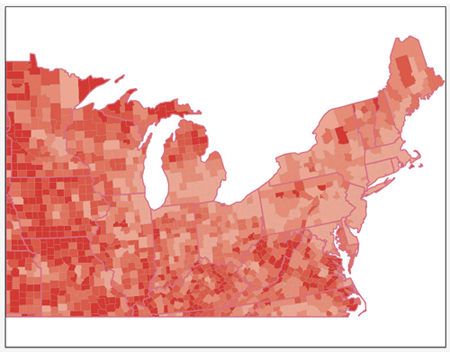
This screenshot displays the map prior to applying the dot density effect.

Item 2: Coordinate system of the map

The screenshot below displays the map after having applied the Dot Density Theme using the parameters displayed within the dialog .

Item 2: Coordinate system of the map

News Archive