My Account     Contact Us     Cart

7 GIS terms To Know: Map Making for Designers

Many of our MAPublisher clients are cartographers and GIS professionals, but a growing number are graphic designers who are tired of the tedious work of making maps without specialized tools. Making a map is part art and part science and while we help bridge the gap between Geographic Information Systems (the science) and graphic design (the art), as a graphic designer, you may not be familiar with the wonderful world of GIS.

So on this GIS Day, we have compiled the definitions to a few common GIS terms that you may encounter; GIS Day, celebrated each year, in November to help educate non-GIS professionals about the importance of geospatial information systems and the benefits that GIS brings to our lives.

1. Spatial Analysis

Any good and useful design involves analysis. This process of stacking layers, inspecting and interpreting model results seeks to solve complex location-oriented problems. This can be used for predictive analysis, estimating the level of suitability and for further understanding of the geographic location. 
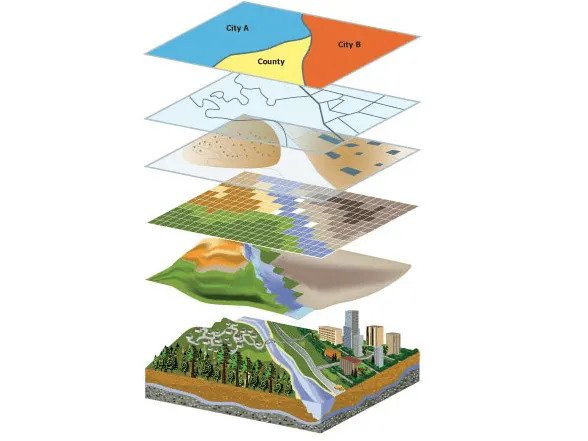
spatial analysis

2. Layer 

Maps contain several layers, each representing a set of spatial features. Layers are laid atop one another for viewing or spatial analysis. This lends itself to working with the map layers in Illustrator, as they can be treated similarly to a layer containing artwork.  

3. Attributes

Attributes denote a geographic feature on a map. The information is typically stored in a tabular format that is linked to the feature. For instance, the attributes of a well-represented point along a river may include the name, the course of the river/ length, sediment load, etc. 
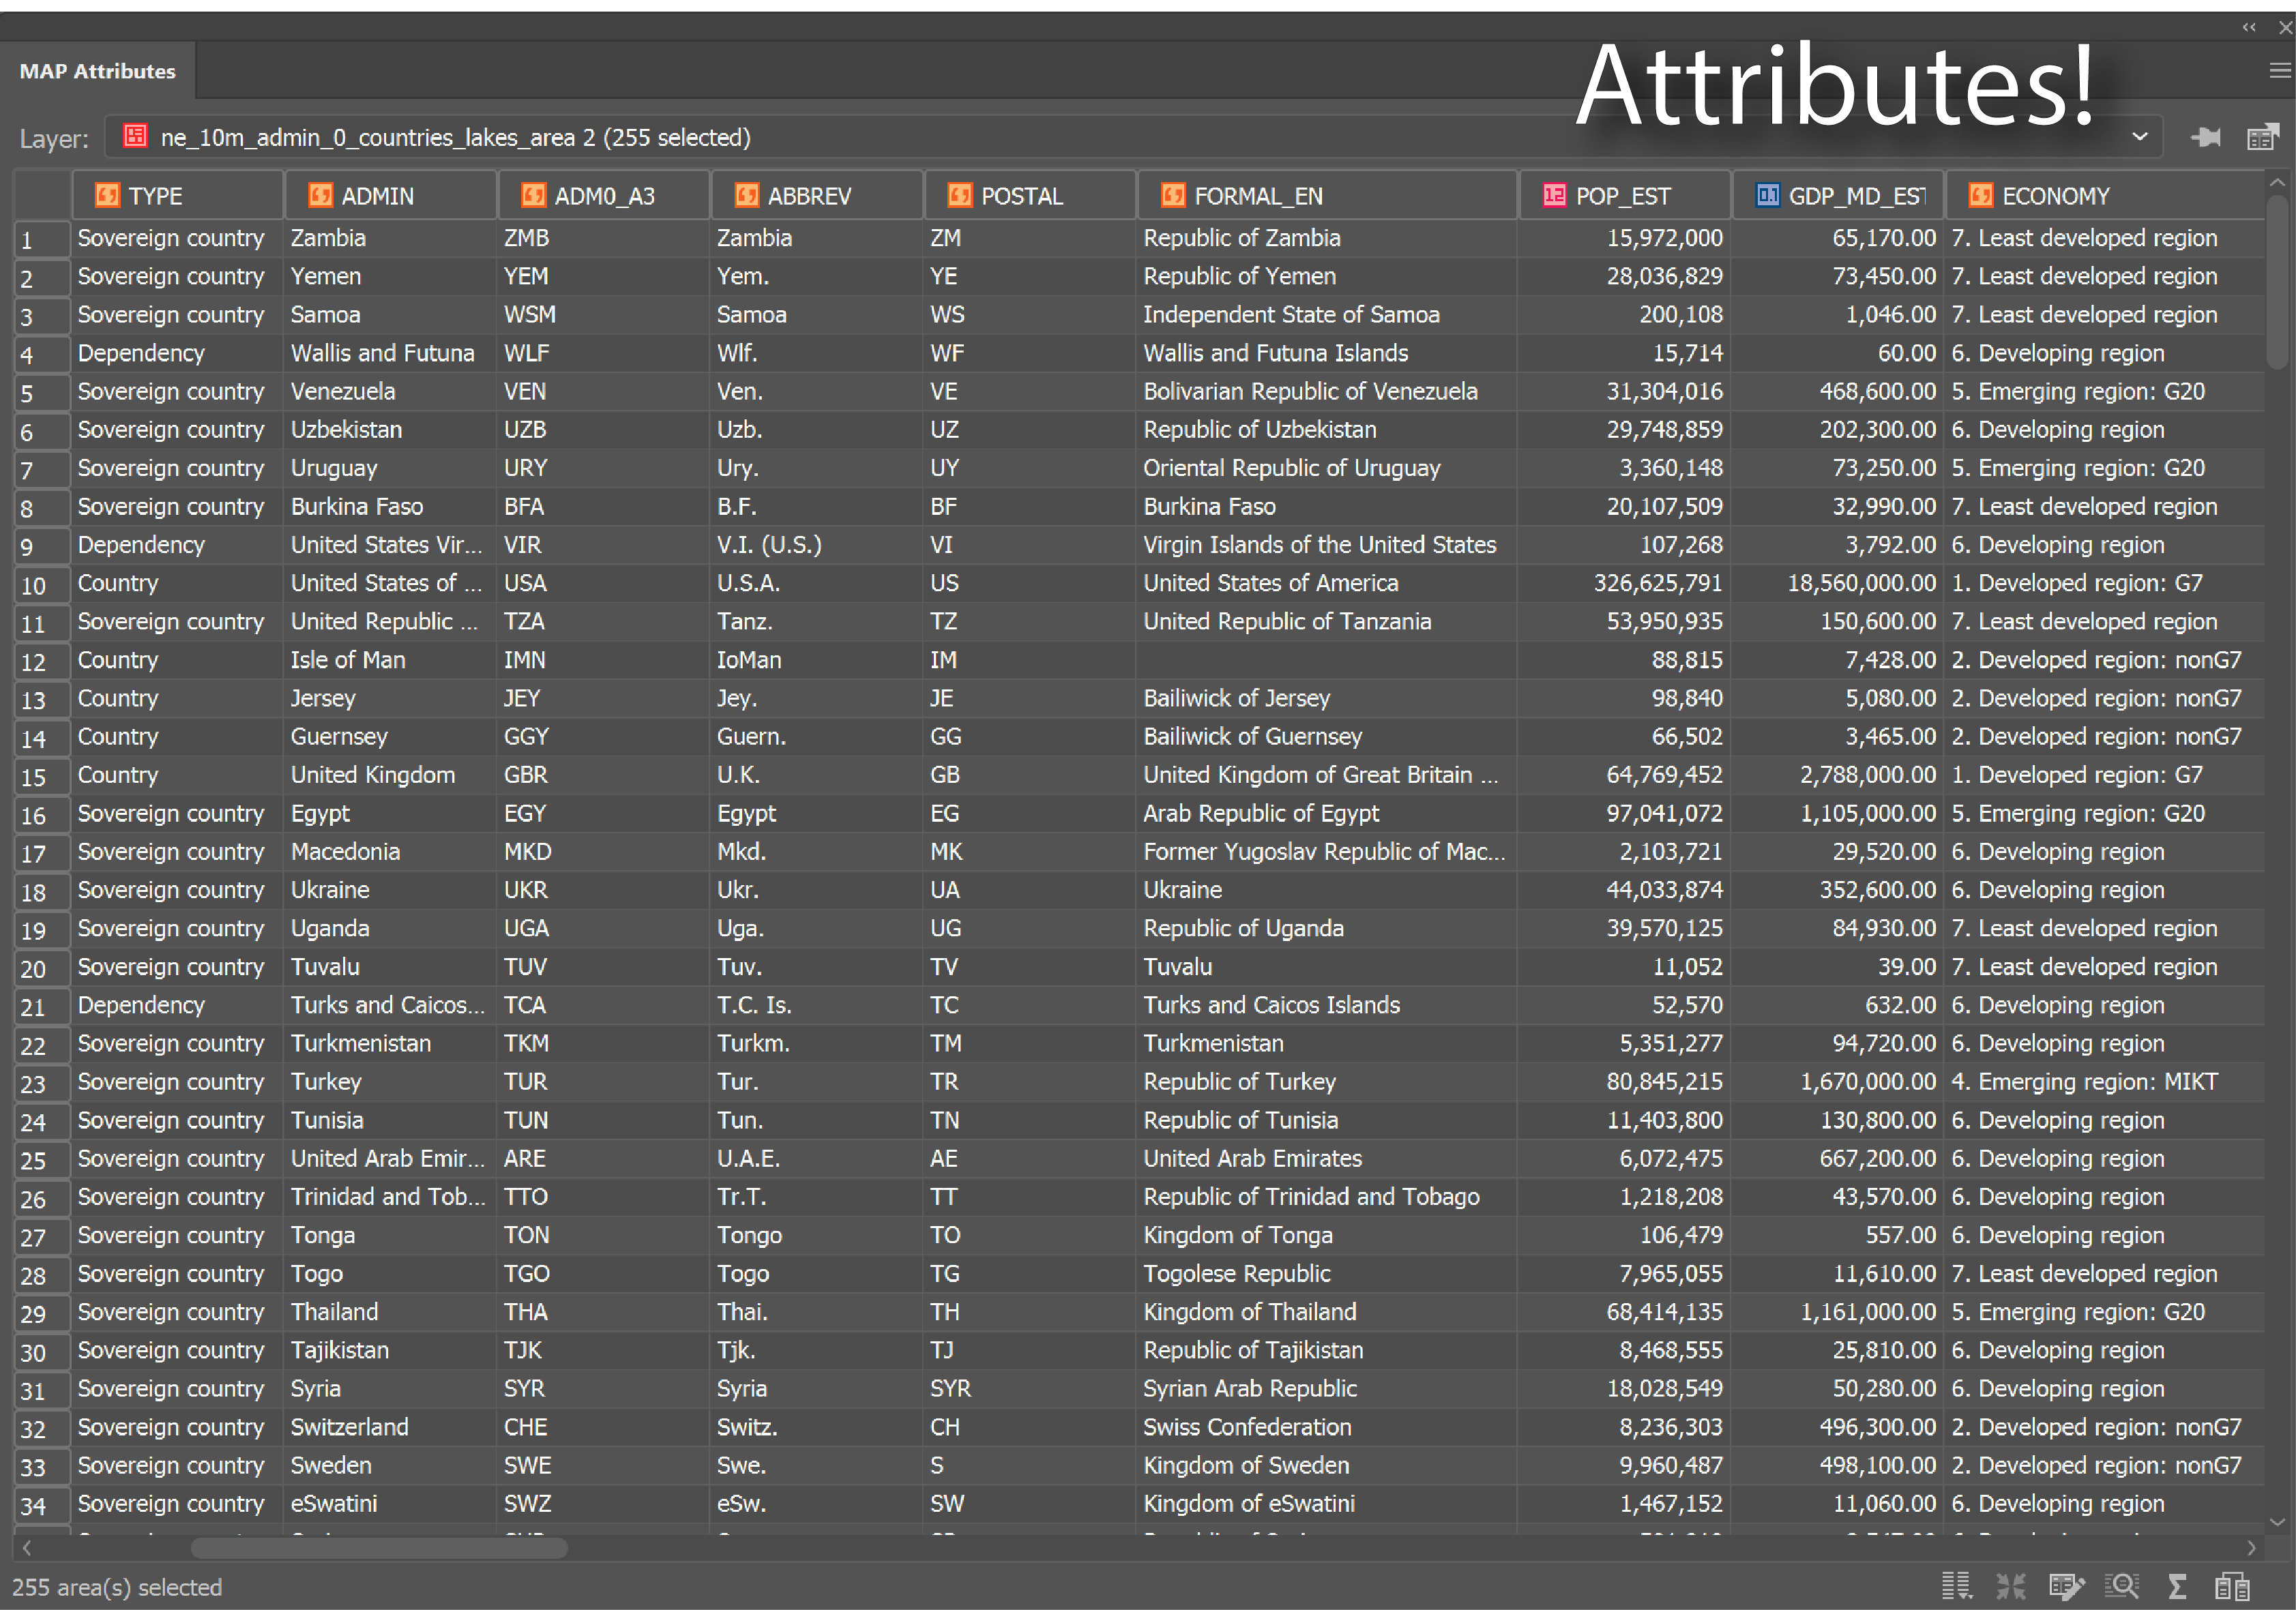
When you are familiar with the attributes associated with the map data, you can do things like applying rules to style your map according to attributes in the table.

4. Geocoding
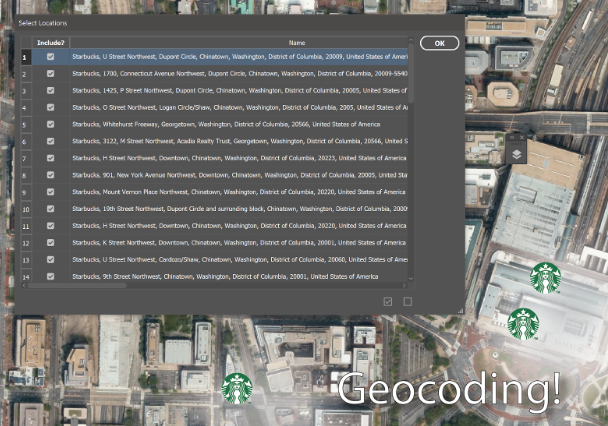
Geocoding

The process identifies a location by its geographic coordinates (latitude and longitude). This is used to position places and features on a map as well as to reference the map itself. 

5. Buffers
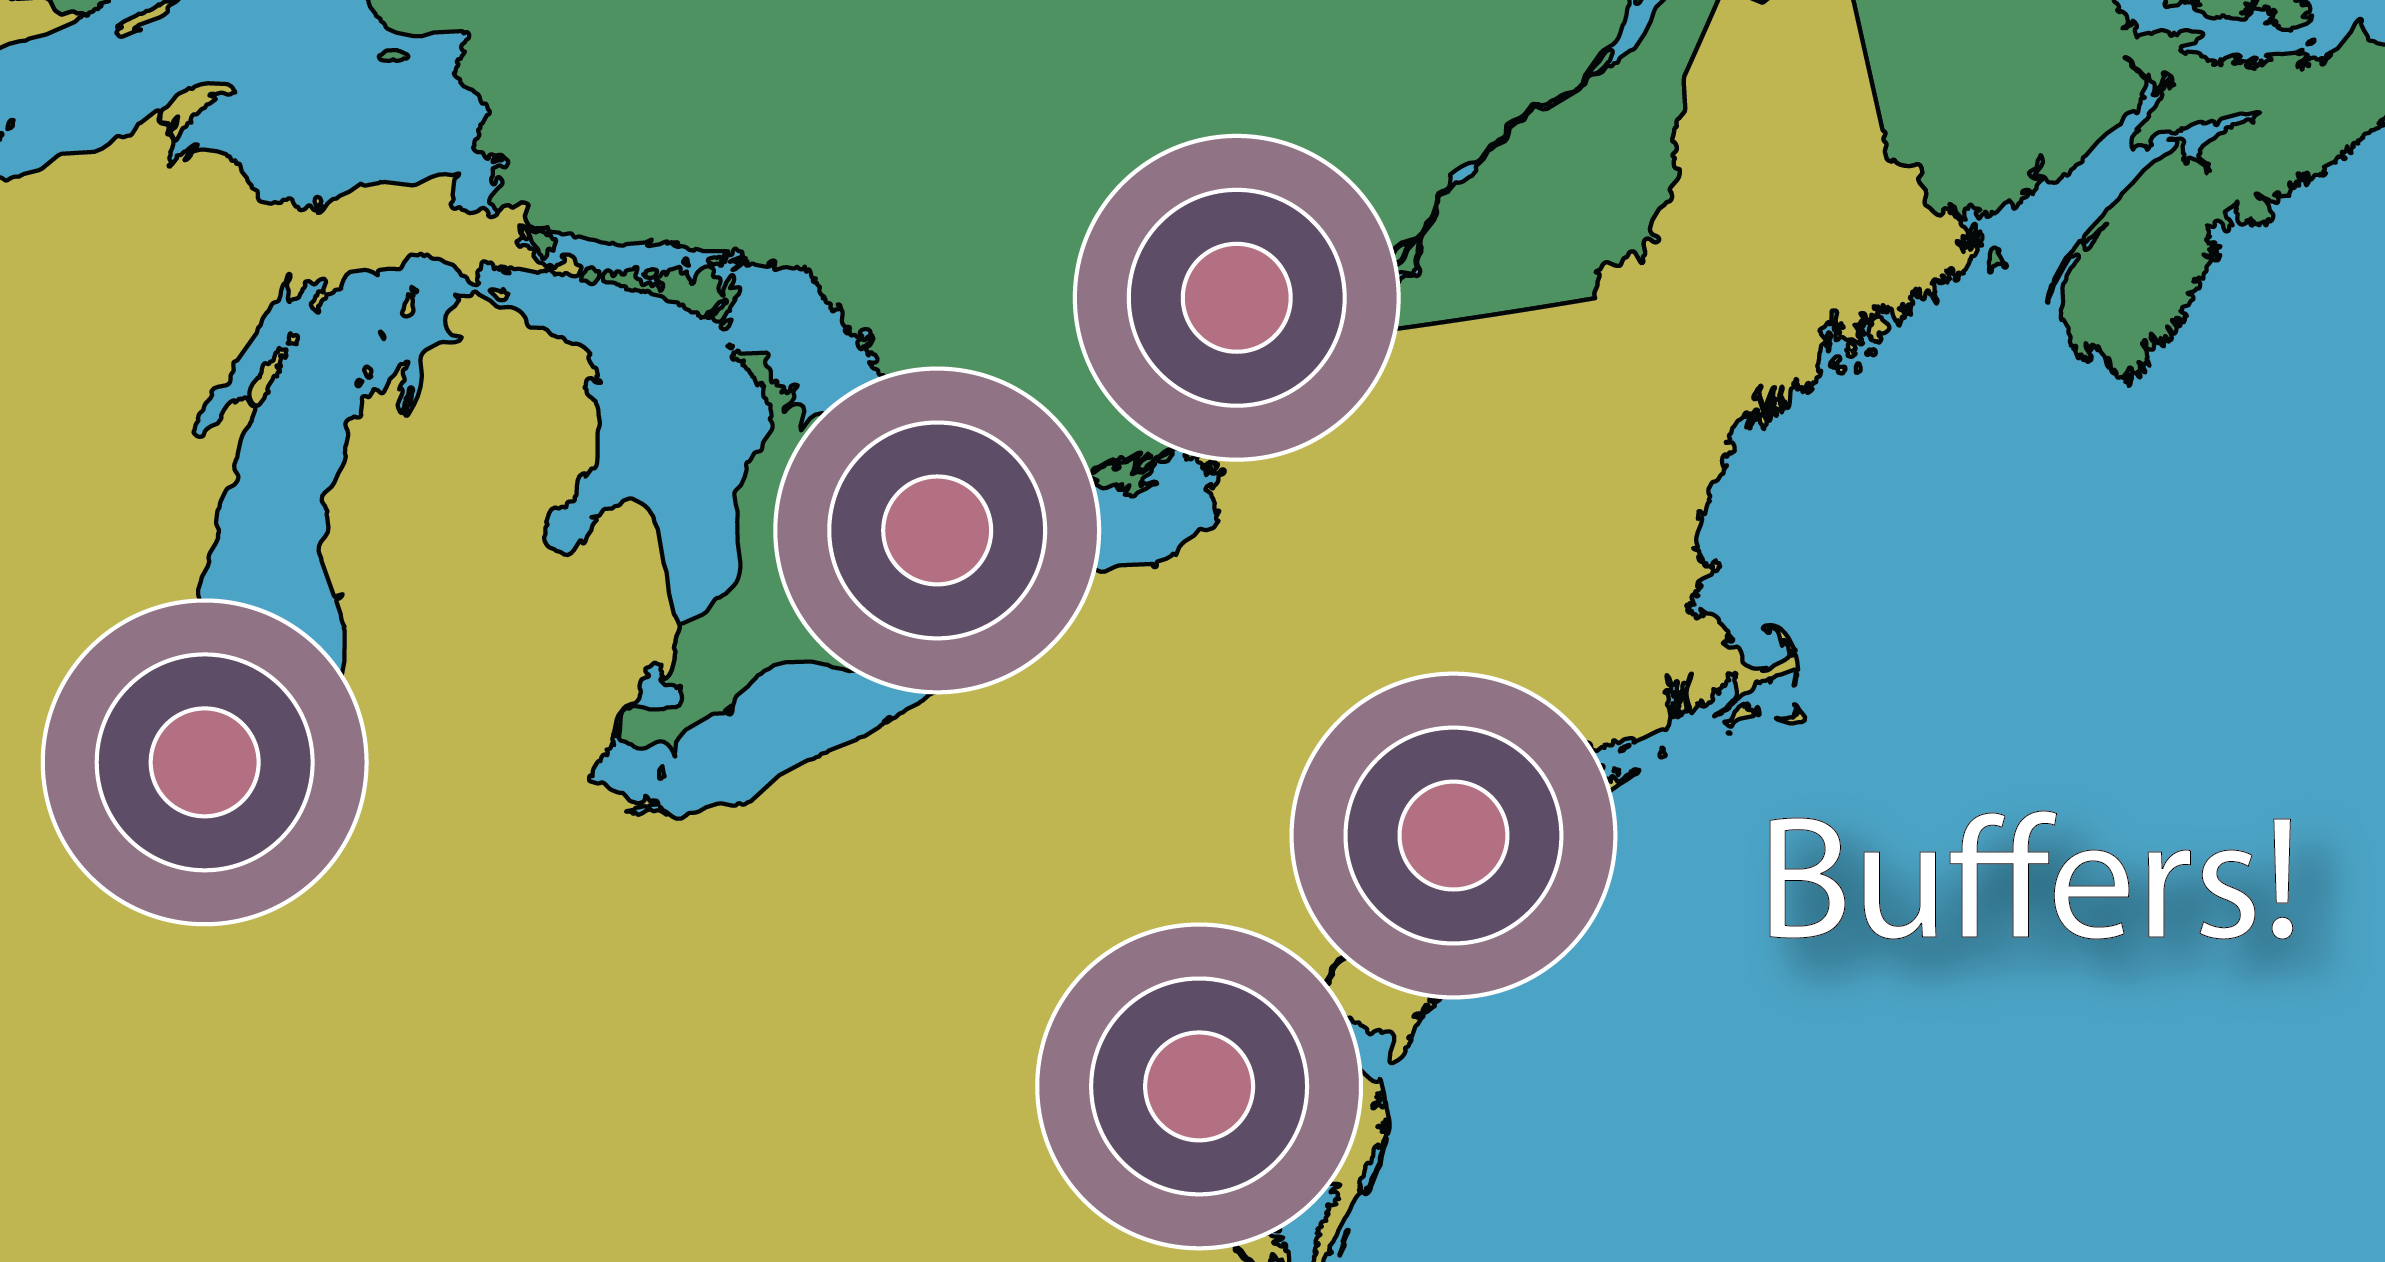
Buffer

A buffer is a zone around a specific map feature, that is measured in units of time or distance. A buffer is useful for proximity analysis or visualizing the areas that are within a certain distance from another feature (i.e. within school zones, or floodplains) 

6. Polygons/Areas
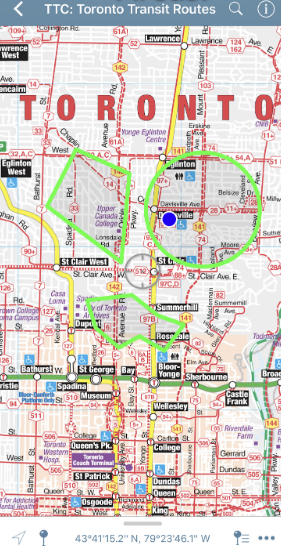
Areas / Polygons on a map

Enclosed Polygons on a map are often referred to as areas. Polygons can have attributes associated with them to represent a particular real-world entity such as postal code, economic identifiers, population demographics, environmental factors, or social behaviors.

The image above depicts areas on a map.

7. Coordinate systems

The planet is not flat, however, we routinely try to represent it in 2 dimensions on paper and screens. The Coordinate systems act as a reference framework that helps position features in order to make a map more useful for the purpose desired.
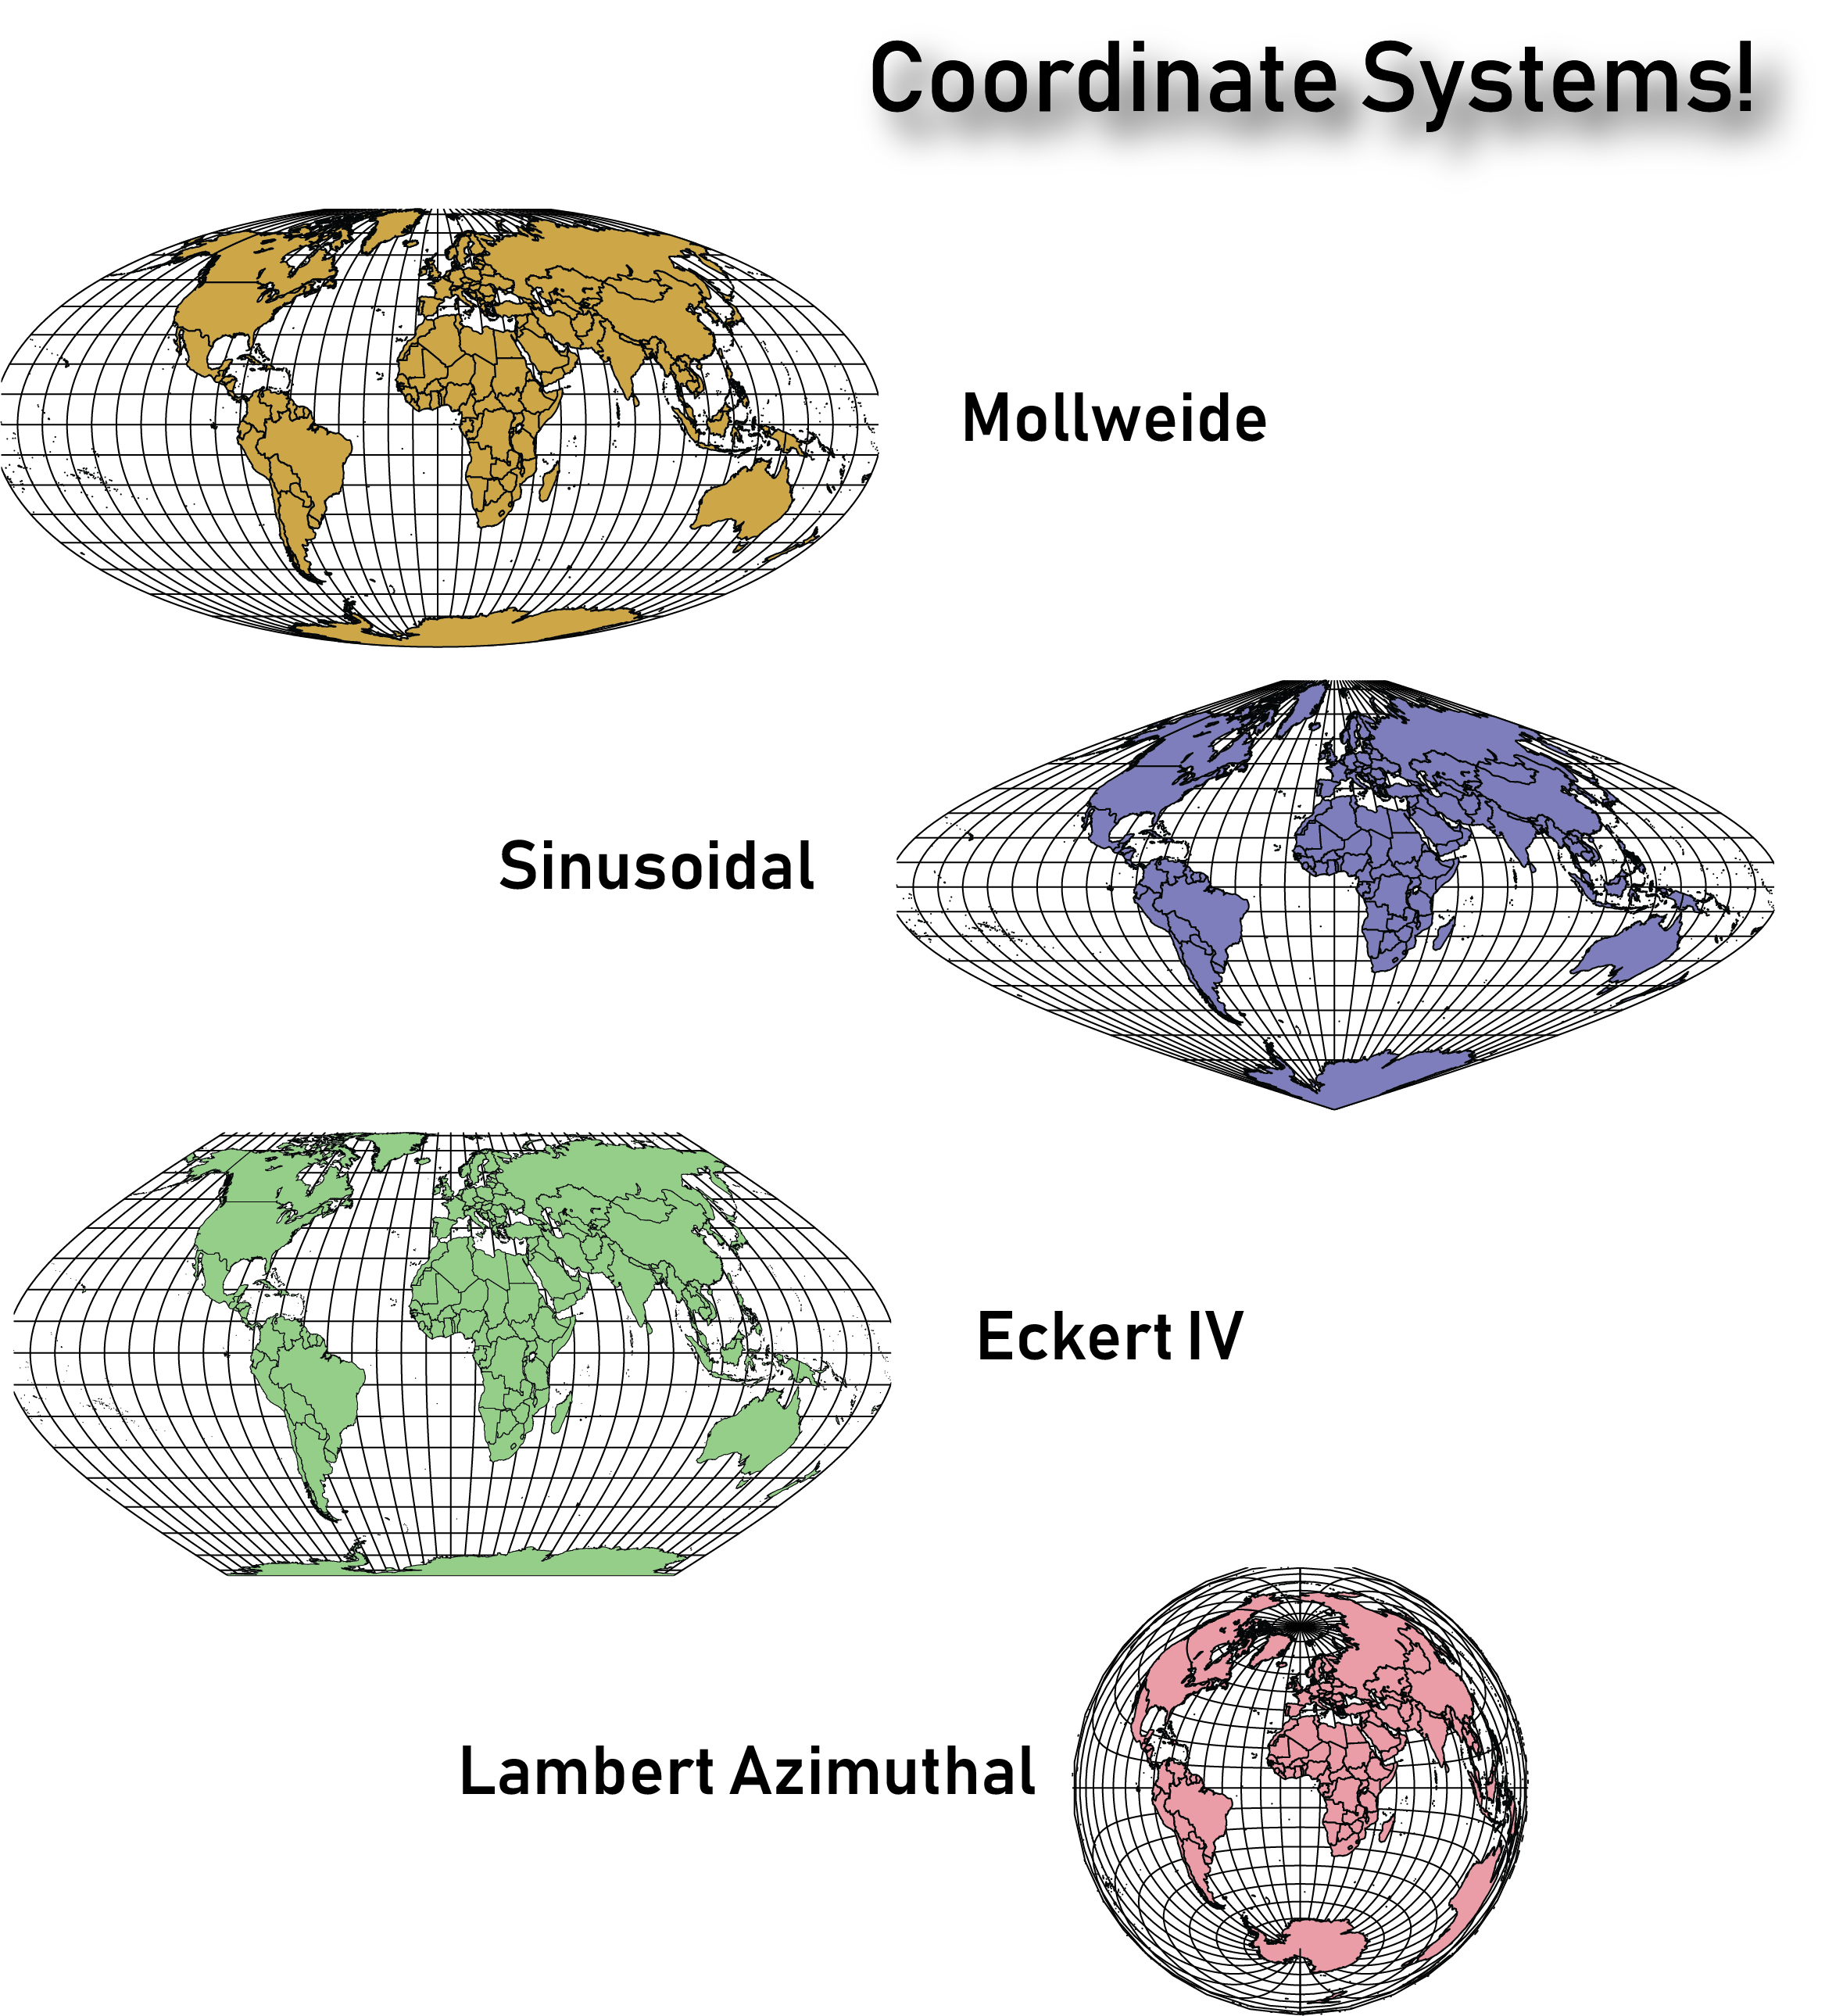
Coordinate Systems

It is important to note that there are thousands of coordinate systems, so it’s important to take the time to figure out which would work best for the type of map you intend on creating. Sometimes you’ll need to change the coordinate system from the one defined in the underlying map data, to help the map make more sense to the end-user. 

They say an artist is one who gives people something they didn’t know they were missing. If you happen to be an artist or know an artist (graphic designer) who seeks to give people direction – literally ‘direction’ – you’ve landed in the right place. Go ahead and share this article with like-minded map enthusiasts to begin learning and delivering high-quality maps the easy way. 

Sources:

https://researchguides.dartmouth.edu/gis/spatialanalysis

https://en.wikipedia.org/wiki/Buffer_(GIS)

How It’s Done in MAPublisher – Adding North Arrows

Adding a north arrow to your map allows your map reader to better understand the direction of the map, and is a key tool for navigation. North arrows can be configured to a custom coordinate, such as magnetic north as well as true north.

Check out this short video that demonstrates how to create and configure north arrows in MAPublisher!

For more How It’s Done in MAPublisher videos, check out our YouTube channel!

Indexing Your Atlas Just Got A Whole Lot Easier

Whether you’re an experienced atlas maker or embarking on your first project, we all know producing an atlas is no small task. In short, an atlas consists of a series of maps and an associated index. Seeing that cartographic content often takes centre-stage, when planning your project it is easy to assume that the map-making process will be the most demanding. However, the proper indexing of map features is often by far the largest individual task when it comes to producing an atlas and can be quite burdensome.

You will be happy to know that MAPublisher 10.1 makes indexing that much easier with the addition of the Include Page Numbers option to the Make Index tool. This advanced option completely automates the indexing of page numbers while also enabling the indexing of two page maps on a single artboard.

For atlas makers, this new addition will streamline and improve the indexing process making it a key enhancement considering the primary function of an atlas index is to help the user locate features and points of interest on map pages.

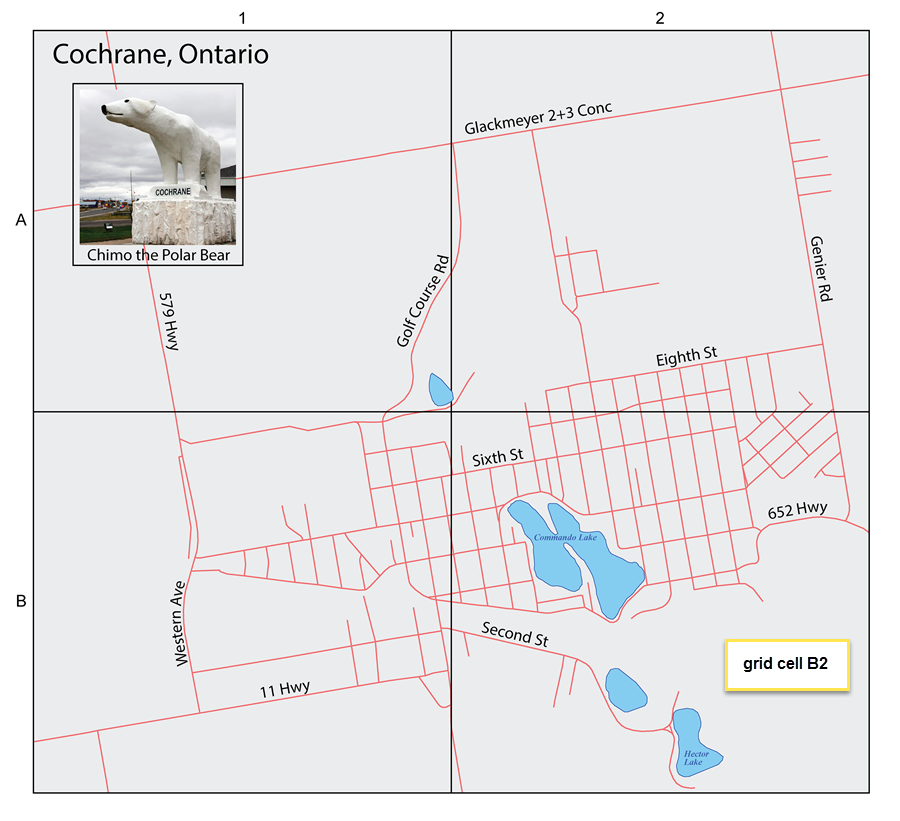
Let’s take a look at a basic street atlas of Cochrane that was created using MAPublisher 10.1. Cochrane is a town located in Northern Ontario which is not only famous for its mascot Chimo but also for being the hometown of Tim Horton, founder of Canada’s largest coffee chain.

The atlas is divided into four sections: grid cells A1, A2, B1, and B2. Each cell contains two separate map pages numbered two through nine.

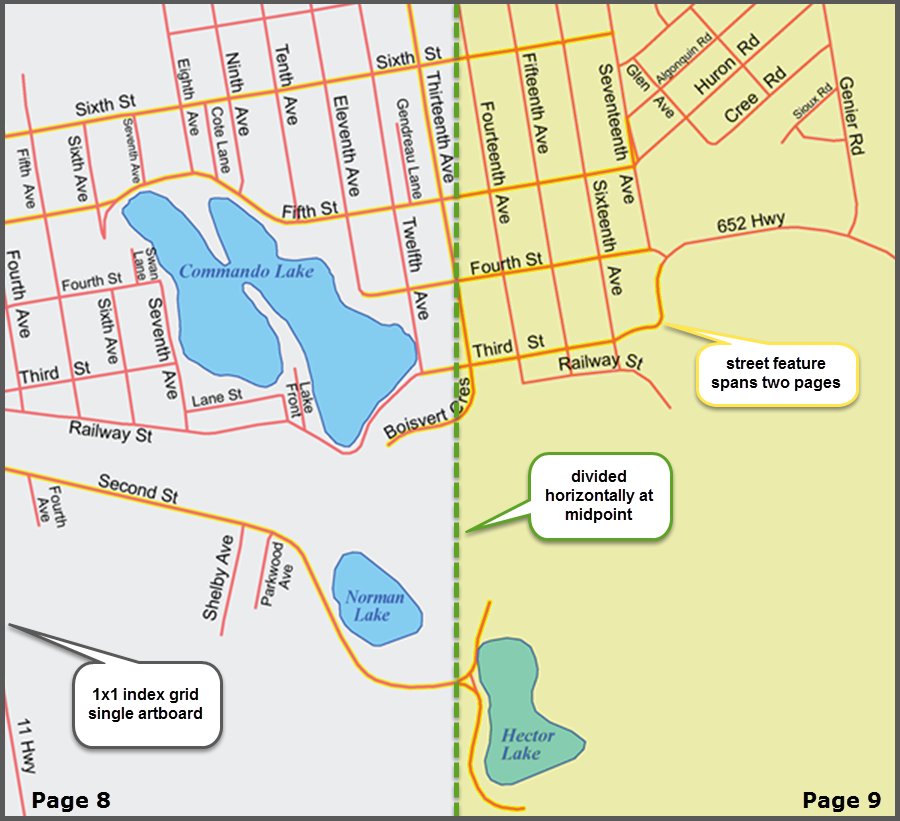
The following is a simple example which demonstrates the page indexing for atlas pages eight and nine found in grid cell B2.

Atlas makers can now index their page numbers as easy as one-two-three!

Step 1

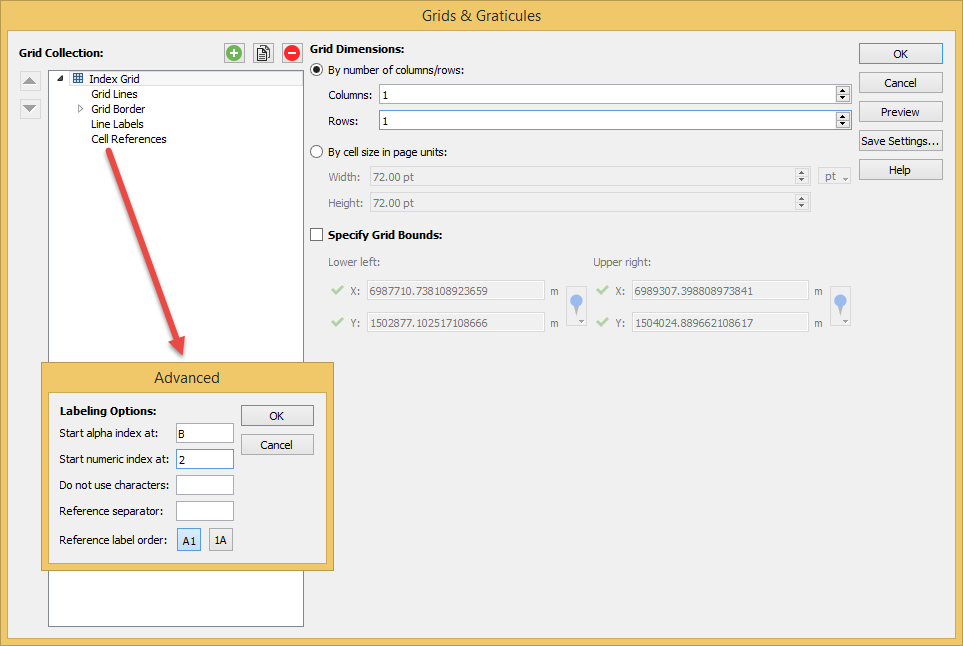
To start, using the MAPublisher Grids & Graticules tool, generate an Index Grid with one column and one row (1×1). Although the Index Grid option was selected, the Graticules or Measured Grid options can also be used if it better suits your atlas design needs. Additionally, Cell Reference Labelling was enabled and the advanced labelling options were set as displayed.

Step 2

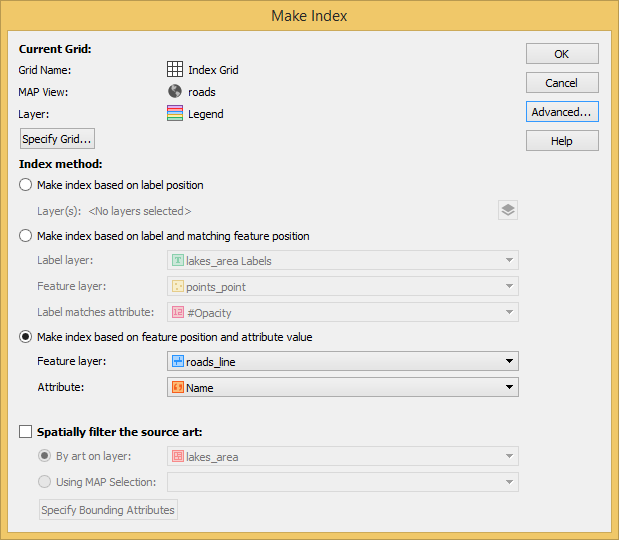
With your Index Grid created, access the Make Index tool which will initiate the map indexing process. Since we’re indexing streets in this example, we’ll go with the Make index based on feature position and attribute value. The feature position will be relative to which page or pages the street falls on while the attribute value will reflect the street’s name. In this example, streets which span two atlas pages have been highlighted with a yellow background on the map.

Step 3

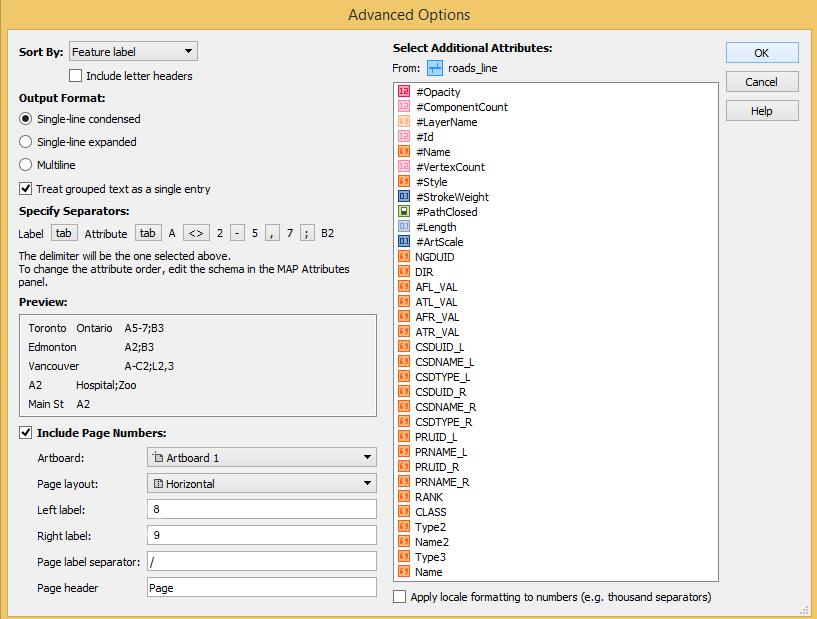
Since a single artboard is being used to map features which span two atlas pages, the Advanced option Include Page Numbers will be enabled with a horizontal page layout dividing the artboard into page 8 and page 9.

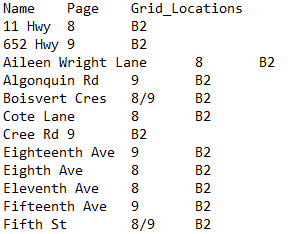
Simply click OK twice and your atlas pages will be indexed with the results written to a delimited text file as displayed below. From here, this file can be formatted and refined within a software like Microsoft Excel, Google Sheets, Quark Xpress, etc.

Portion of the delimited text file output:

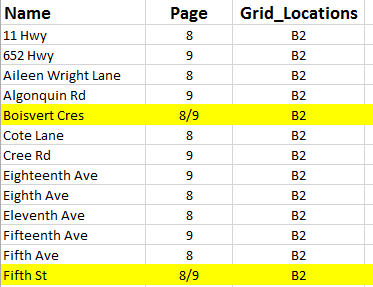
Same portion imported into Microsoft Excel:

Note: streets which span two pages have been highlighted to correspond to the map example.

By necessity, indexes are created towards the end of each project when atlas delivery deadlines are looming. It is therefore very important that the technology and methods used be robust and efficient. The introduction of the Include Page Numbers option has enhanced and simplified the map indexing process while meeting the specialized needs of atlas cartographers.

For more information see:


News Archive