My Account     Contact Us     Cart

Map Spotlight: Northern New Jersey Highlands Trails by Jeremy Apgar

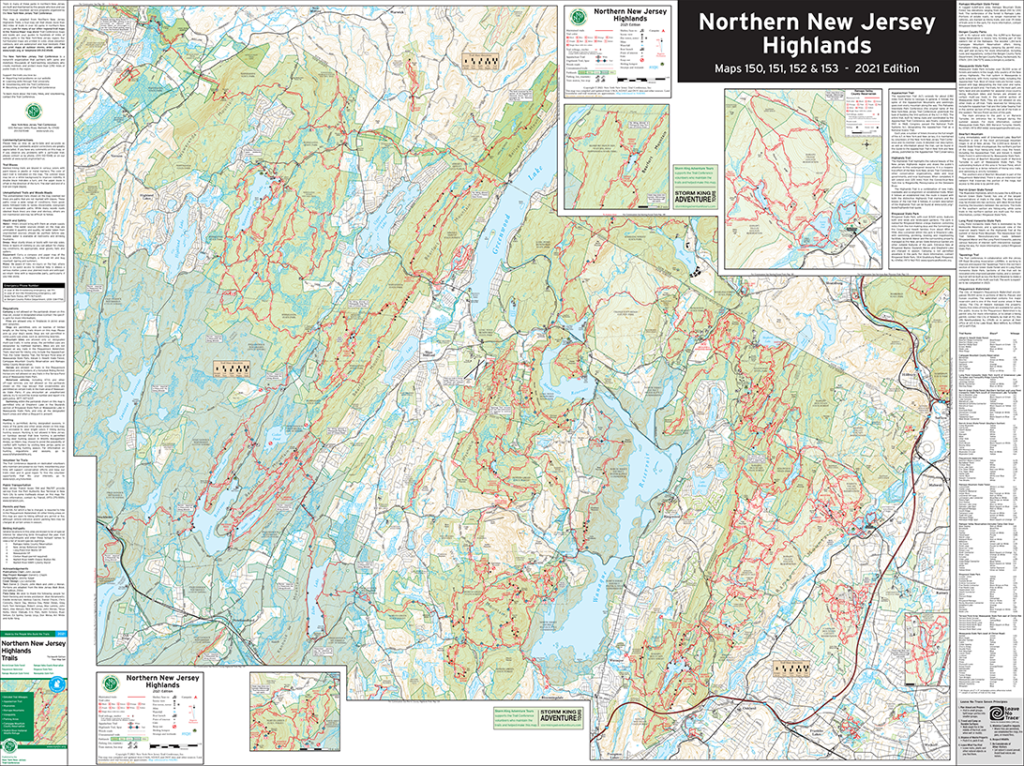
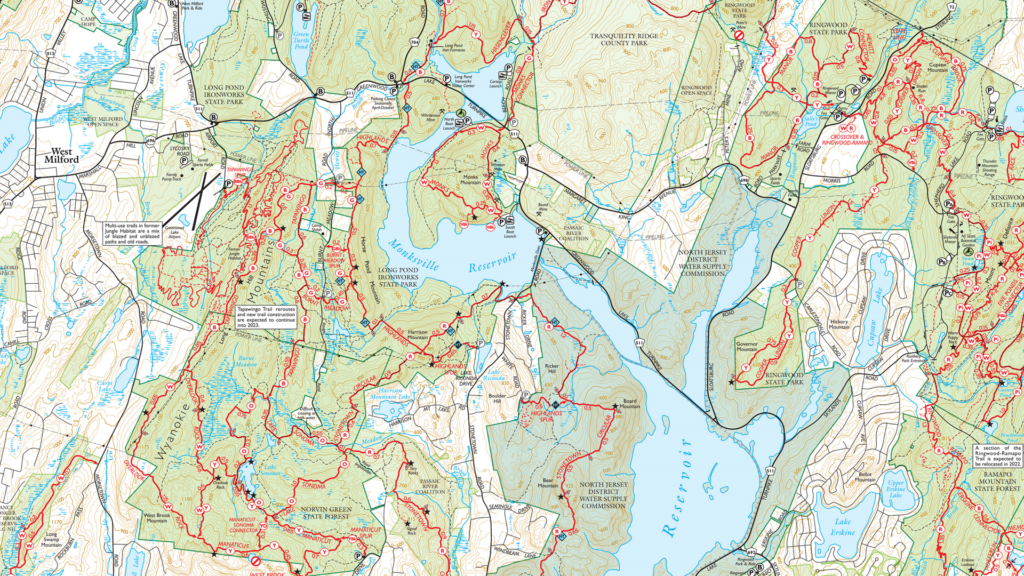
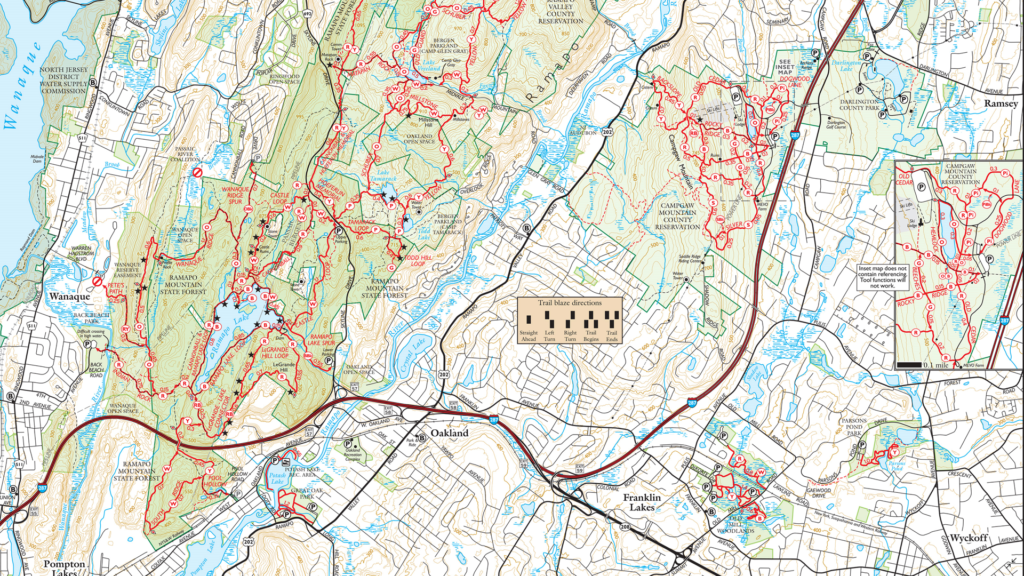
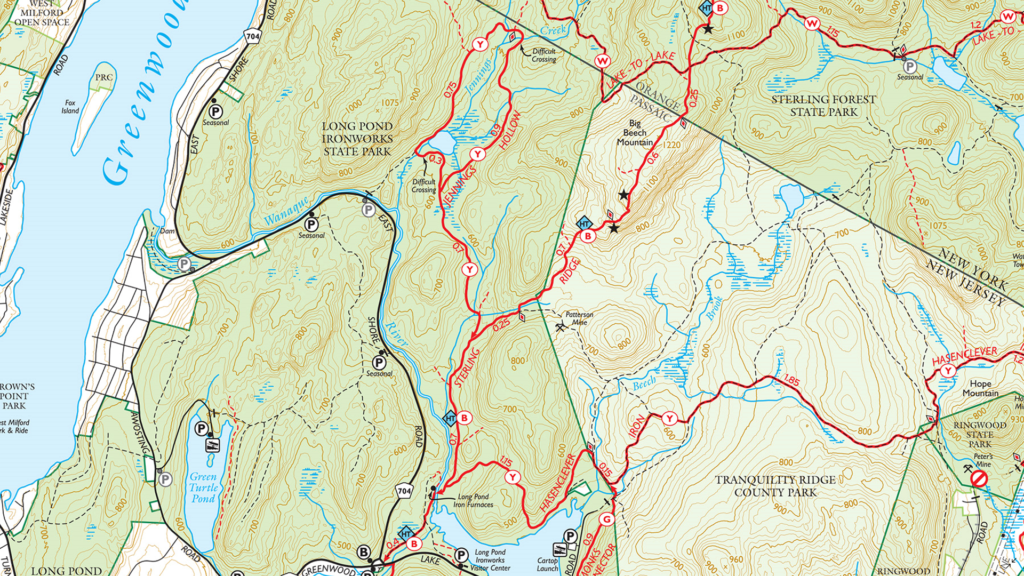
In this Map Spotlight, we are highlighting a submission from the 2021 Avenza Map Contest: Northern New Jersey Highlands Trails by Jeremy Apgar, with additional contributions from Daniel Chazin. This map features more than 360 miles of marked trails and over 40 parks and preserves in the northern Highlands regions of New Jersey. As the region is located less than a one-hour drive or transit ride from New York City, these trails are very popular. Recent changes and additions to the trails have required accurately updated maps to be created, with this particular map being recreated from scratch and scaled up by 33% from the original.

The map now includes many new features absent in the previous versions, including junction-to-junction trail mileage numbers, a completely rebuilt basemap with new detailed contour lines, revised park boundaries, and more than 5,000 manually-placed text labels and symbols. It also includes several inset maps to cover complex areas, a complete trail index, and park contact information, history, and regulations. On the importance of these maps, Jeremy stated: “During a time when there is a wealth of ‘free but largely unreliable’ trail information online and in popular apps, it is even more important than ever that we provide comprehensive, accurate, and up-to-date trail maps for the parks and trails in our region in a variety of formats.”

This map is available to be purchased from the Avenza Map Store for use in the Avenza Maps mobile app. Physical copies can also be purchased on the New York-New Jersey Trail Conference website, or found at the trailhead kiosks located throughout the region.

Select the images below to see a detailed look at Jeremy’s map

Making the Map

Several MAPublisher tools and functions were used to create this map. Jeremy used the Multiple Data Import tool to aggregate several data formats at once, such as GDB, SHP, and GPX files. Following import, he used the MAP Views panel and editor for setting up the map scale and projection of the document, and also reprojecting data layers in different coordinate systems. The MAP Attributes panel as well as the MAP Selections tool were used to further filter and easily organize imported data.

Jeremy also utilized some of MAPublisher’s Geoprocessing tools in the creation of this very detailed map. The Flip Lines tool was used for some finer linework styling, and the Simplify Art tool was helpful for creating visually appealing contour lines. Finally, Jeremy used the MAP Vector Crop tool to remove any art that was beyond the boundaries of the map.

Jeremy additionally used the Label Features tool, and Layout Tools to create preliminary labels and a scale bar, which were later replaced by manually placed labels and custom graphics.

When his map was finished, Jeremy was able to use the Export Document to Geospatial PDF tool to export his file for its various versions of final products, as well as the Upload to Avenza Map Store feature to easily begin selling it on our Avenza Map Store.

Learn more about the Avenza Map Contest and submit your entry here, and check out our other Map Spotlight blogs here!

Map Spotlight: Serengeti in Motion by Riley Champine

Serengeti in Motion by Riley Champine

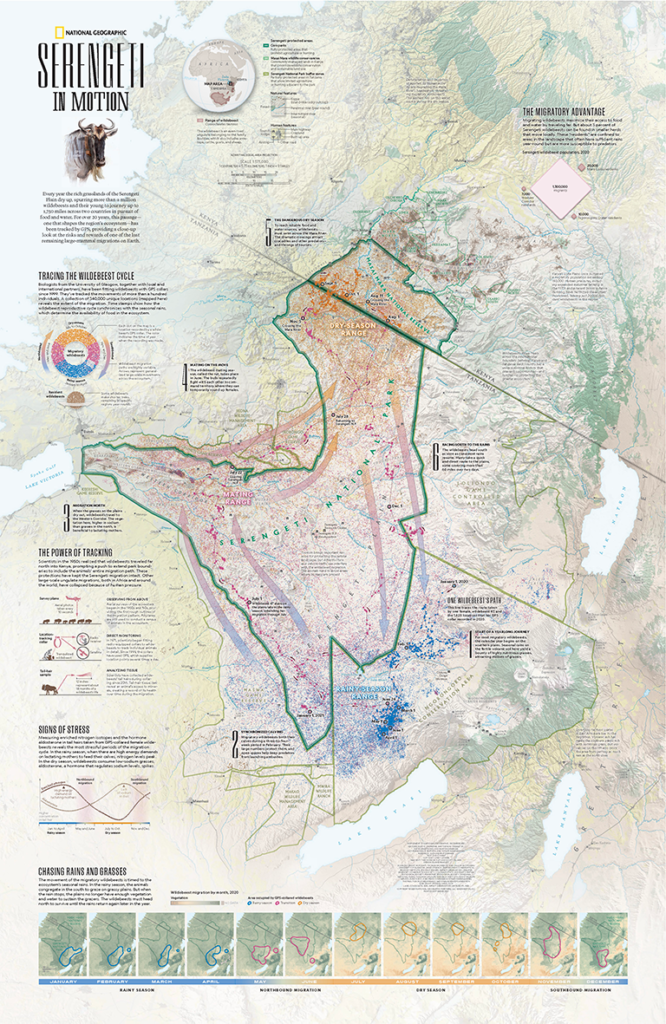
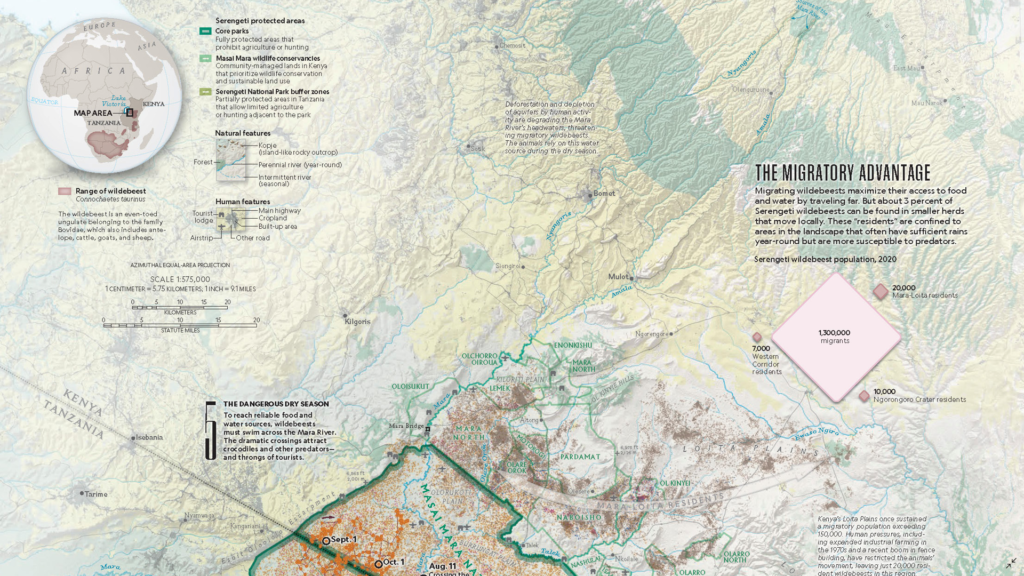
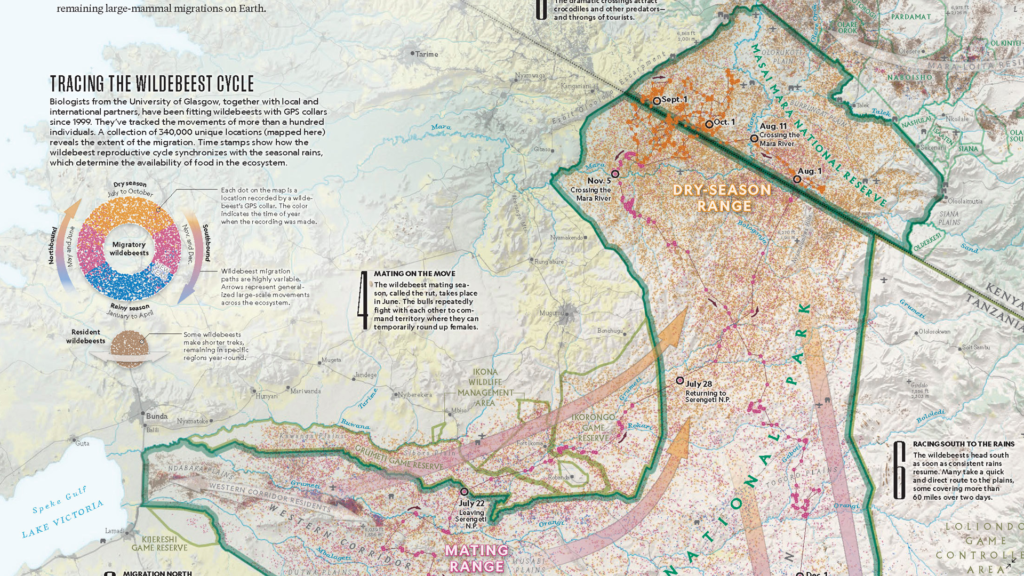
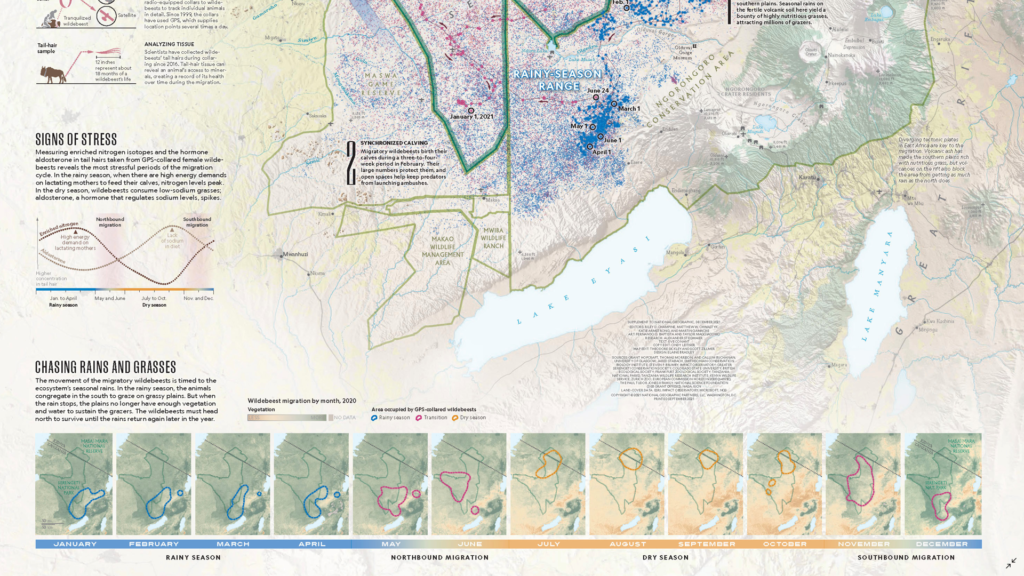
In the Map Spotlight this time, we are highlighting a submission from the 2021 Avenza Map Contest. Serengeti in Motion by Riley Champine was a supplement to the December 2021 issue of National Geographic magazine, which featured several stories about the Serengeti and its wildlife. The map depicts the annual great migration of wildebeests, one of Earth’s last remaining large-mammal migrations. It also depicts the natural features of the landscape as well as the boundaries of several protected areas in the Serengeti region.

Each year over one million wildebeest (and other mammals such as gazelles and zebras) participate in a circular migration which starts in the southern Serengeti in Tanzania, loops through Serengeti National Park, and advances north toward the Masai Mara National Reserve in Kenya. Seasonal rains drive migration patterns as the wildebeest search for more grass to graze on. On this map, the migration has been illustrated using 340,000 points collected by an ongoing 20+ year biological study that uses GPS collars worn by wildebeest to track their location. The map also details the path of a single female wildebeest as she crossed multiple habitats, several rivers, and an international boundary (twice!) over the course of one year.

Select the images below to see a detailed look at Riley’s map

Serengeti in Motion by Riley Champine

Making the Map

To create the terrain of the map, Riley used Geographic Imager to reproject and then mosaic aerial imagery of the Serengeti region. This terrain imagery could then be saved and imported into MAPublisher to constitute the background for the map. Some of the data was prepared in other programs such as Microsoft Excel, QGIS and Natural Scene Designer, and then easily imported into MAPublisher.

Riley used the MAP Selections tool to select location points by their date attribute, and group them into three main categories: rainy season (January to April), dry season (July to October), and migration periods (May to June and November to December). He also employed the use of MAP Stylesheet Themes to symbolize these points as well as other data on the map. 

The MAP Point Plotter came in handy for Riley while creating the path travelled by the single female wildebeest on the map. The Simplify Art tool was also helpful in decreasing the detail in some line and area features, which helps in software performance when dealing with a large amount of data in one document.

Riley added the finishing touches to his map using his Stylesheet Themes to create legends as well as using the LabelPro add-on to easily place labels by attribute.

Learn more about the Avenza Map Contest and submit your entry here, and check out our other Map Spotlight blogs here!

Map Gallery Spotlight: Zain Madathil

Dubai Healthcare City Metro Station Map by Zain Madathil

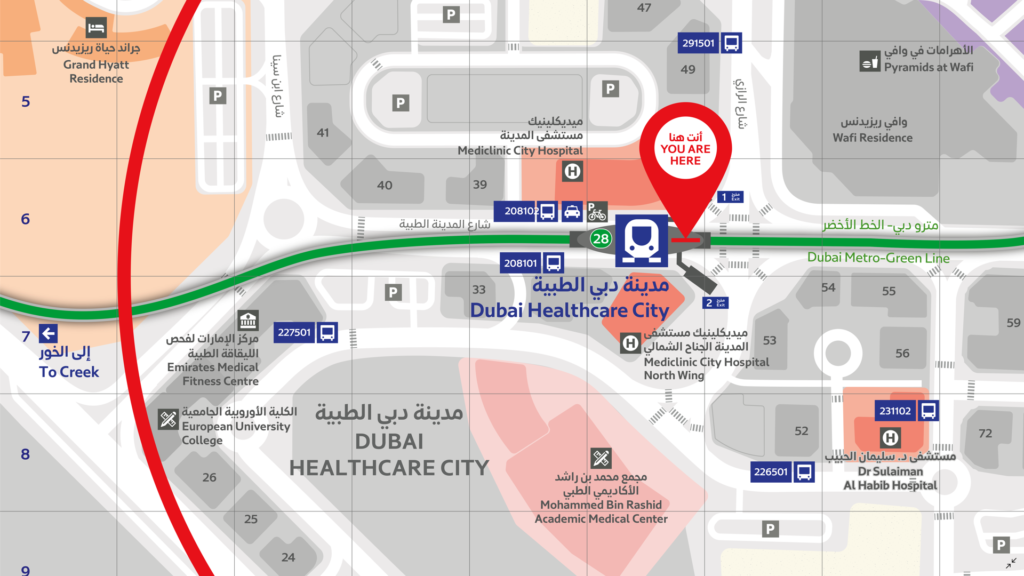
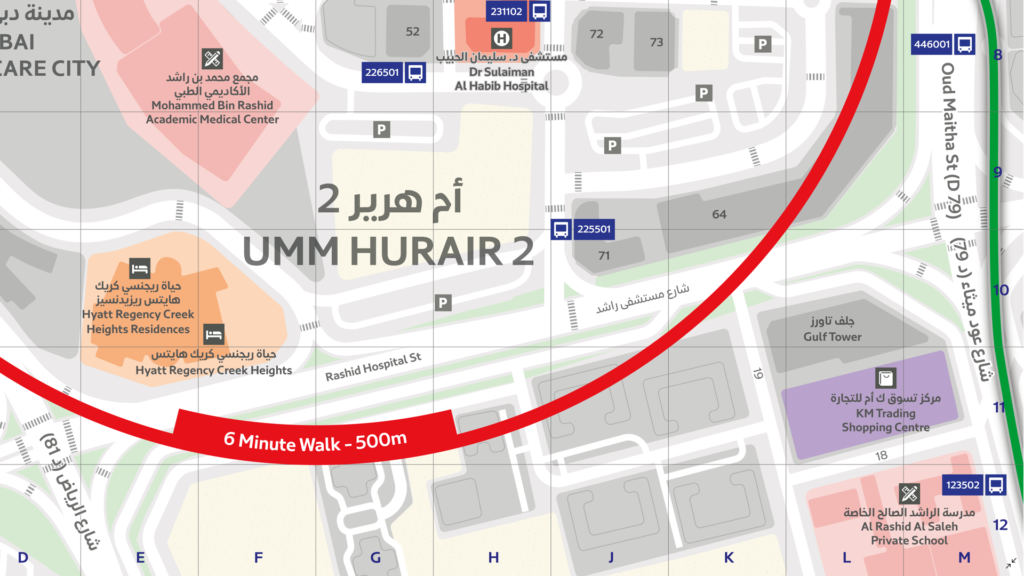
In this Map Gallery Spotlight, we are highlighting another submission from the 2021 Avenza Map Competition. This bilingual map of the area around the Dubai Healthcare City Metro Station was created by Zain Madathil for Explorer Publishing. It is one of nearly 4,000 individual maps he has created for the Dubai Public Transport Map project.Ā 

The map is easy-to-use and informative, providing information in both English and Arabic, and is accompanied by a detailed map index to categorize and highlight important points of interest and nearby attractions surrounding the station. The map utilizes careful design elements to make interpretation easy, including colour-coded icons and building footprints, platform-based direction markers, and a 500m radius walking distance indicator.

Select the images below to see a detailed look at Zain’s map

Dubai Healthcare City Metro Station Map by Zain Madathil

Making the Map

Madathil received data from his client in the form of points, lines, and polygons, and used the Avenza MAPublisher plugin for Adobe Illustrator to design the map. He used the Multiple Data Import tool to easily get all of his data into MAPublisher with a single import process. MAPublisher maintains the georeferencing of the data imported from almost any source, which allowed Madathil to focus on customization rather than data placement.

With nearly 4,000 maps in the series, the MAP Themes tool was important for Madathil to maintain consistent labelling across all maps in the series. After creating a custom branding MAP Theme stylization, Madathil was able to apply this to each map in the series as necessary. He also used the Map Attributes Panel to aid with customization of the attribute data associated with his map features.

Madathil simplified his labelling process by using our MAPublisher LabelPro add-on, which also allowed him to ensure consistency across the map series. LabelPro allowed Madathil to customize the style of his labels and apply rules to ensure they did not overlap important features or other labels. It also eased his application of both Arabic and English labels on the map.Finally, Adrain added an Index Grid and created an index and legend to complete the reference guide for the map using the Layout Tools.

For more information on using the MAPublisher LabelPro add-on, please visit our Support Centre section for this tool. Check out our other Map Gallery Spotlight blogs here!

News Archive