My Account     Contact Us     Cart

Labelling Made Easy with MAPublisher Label Tools and the MAPublisher LabelPro Add-on

Maps are a fusion of art and science, presenting complex geographical data in a way that is both visually appealing and informative. Cartographers use maps to convey a story, drawing attention to important information using carefully crafted design choices and curated map elements that engage the viewer. Although cartographers employ a variety of specialised techniques to present this meaningful information on a map, one of the simplest, yet most effective methods is through map labels.

Quite simply, map labels are symbols or texts strategically placed at specific locations on a map to identify important geographical features, locations, or areas of interest. To a map viewer, labels are a quick and easy way to know exactly what is shown on a map. To a map maker, however, the task of creating labels is not often quick and generally isn’t easy. This is especially true when there are a large number of labels that need to be placed, or when labels need to follow complex paths such as roadways, rivers, or trails. Map-makers must also consider the issue of label crowding and collisions, ensuring labels are not overlapping each other, covering or distracting from other important features of the map. Combined, these challenges can be a significant time-sink in the map-making process, requiring both time and effort on the part of the cartographer.

Labelling doesn’t have to be difficult though, and in this blog, we will show you how built-in MAPublisher label tools and the MAPublisher LabelPro add-on can make labelling simple.

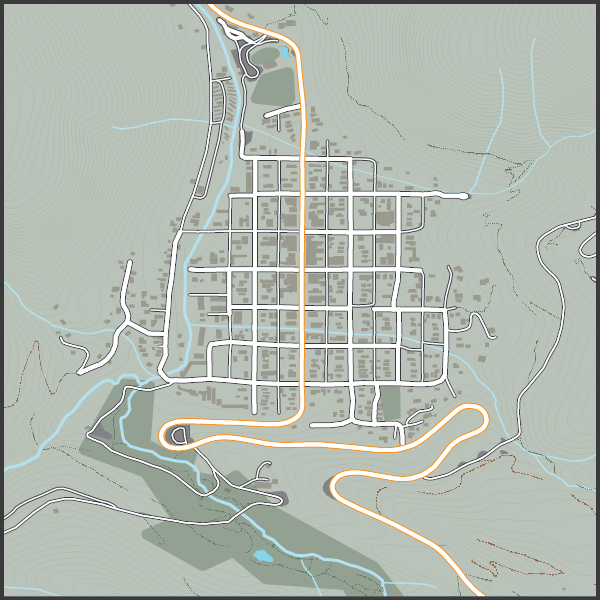
Let’s start with our unlabelled map. We have taken a collection of openly available geo-data depicting the small mountain town of Ouray, Colorado (home of National Geographic Cartographer and last month’s Avenza Cartographer Chronicles feature, Mike Boruta). We have stylized the data to show rivers, parks, streets and trails all throughout the town, but we feel labels would help a user to better understand the information being shown. We are going to approach the labelling process in a few different ways.
Manual Label Placement with the MAP Tagger Tool

For small labelling tasks, where a map maker might need to place only a handful of precisely located labels, the MAP Tagger tool is perfect for the job. MAP Tagger allows us to configure a basic set of options that control the character style of our label as well as general label placement rules. From there, we can simply click on a map feature and have the tool automatically detect and apply a label from attribute information contained in the selected layer. As we have direct control over the placement of every individual label, we can be extremely precise in choosing label placements that work for our map. Best of all, the tool automatically detects and applies text pathing for line features, meaning text labels can follow the form of any road, river, trail in your map!
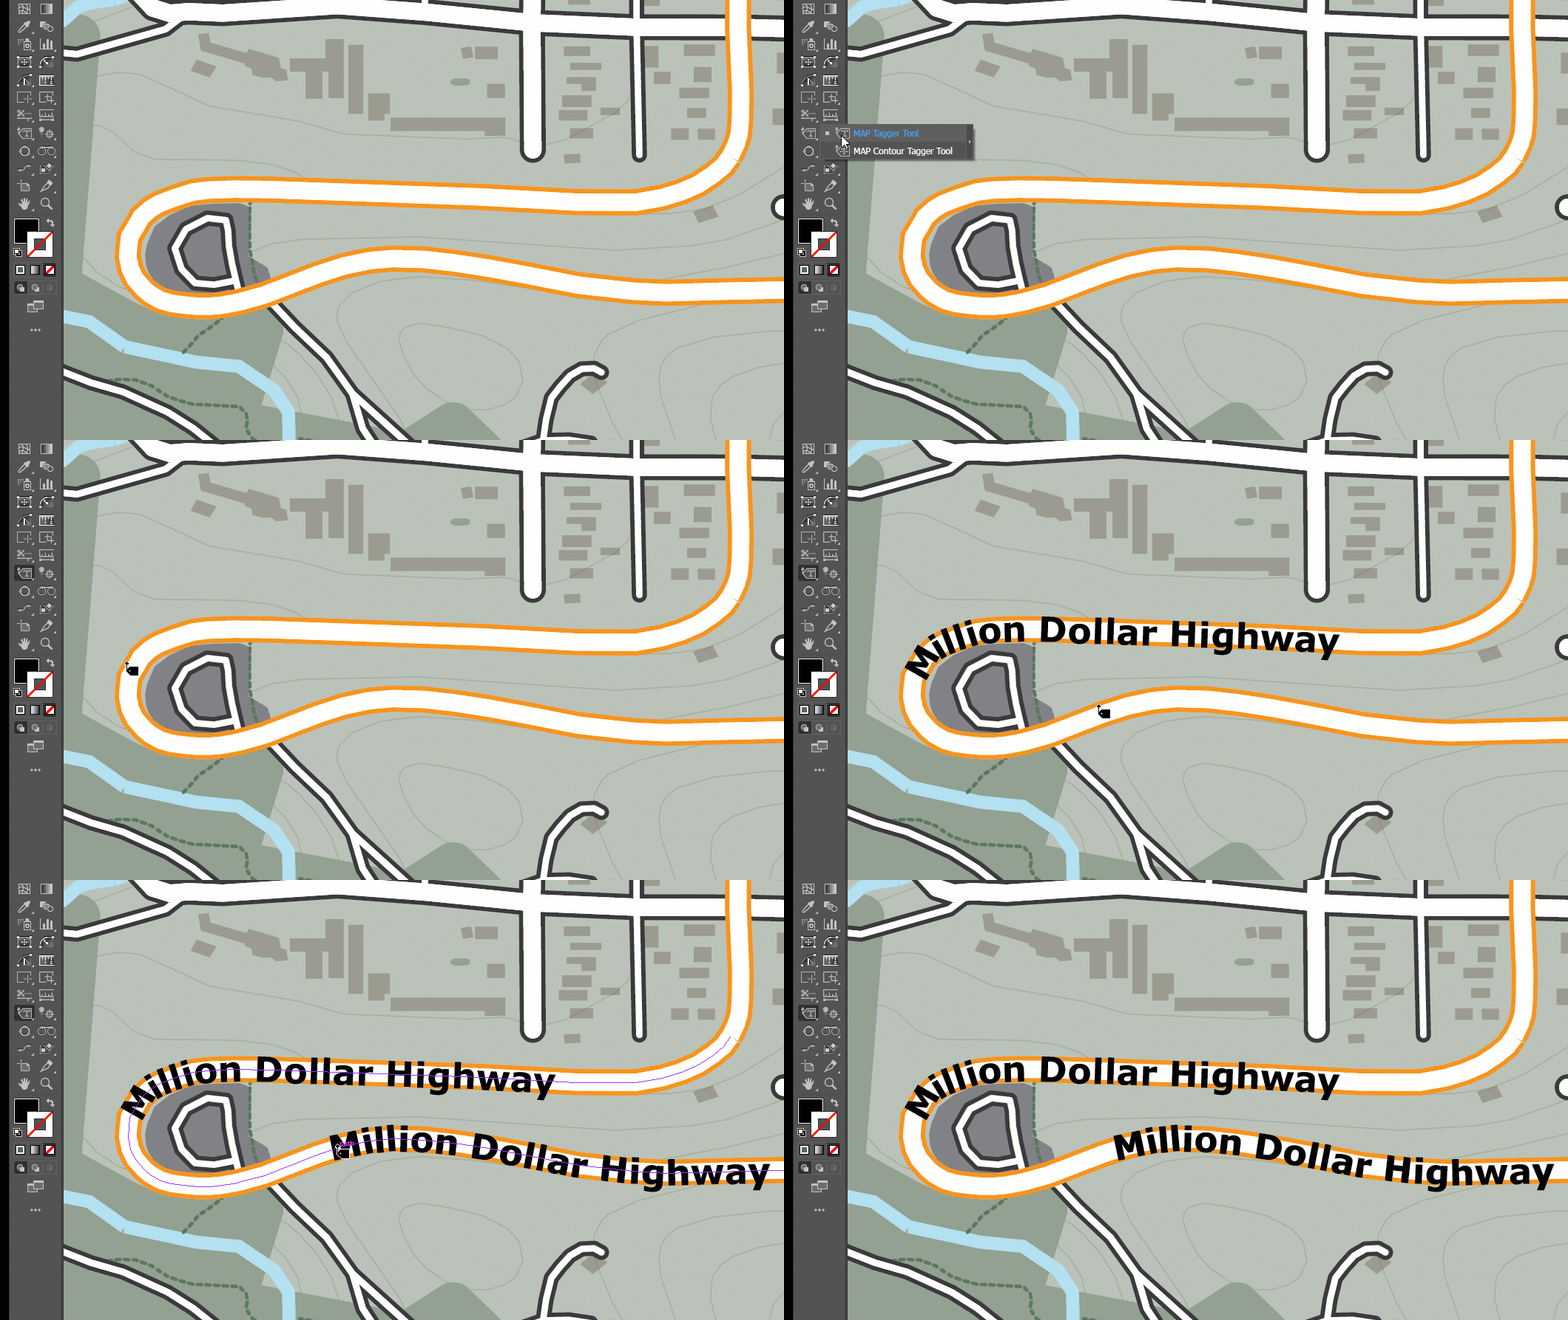
When working with a small number of map features, the MAP Tagger tool is often just what you need to add well-placed labels to your map. For larger labelling tasks, such as our Ouray map, where there are many layers and several different features to be labelled, a manual approach such as this would be very time-consuming. Instead, we need to implement a more automated, batch labelling technique to speed-up the map-making process.

Batch label placement with the Label Features Tool

When you are working with several map layers, or have a large number of geographic features that each need to be labelled, it can be more efficient to create your labels all at once. The Label Features tool comes built-in with MAPublisher, and can handle batch labelling of map features with only a few clicks. The tool is designed similarly to MAP tagger, and automatically populates the map with precise, path-aligned labels, while offering the flexibility to define unique character styles for each map layer.
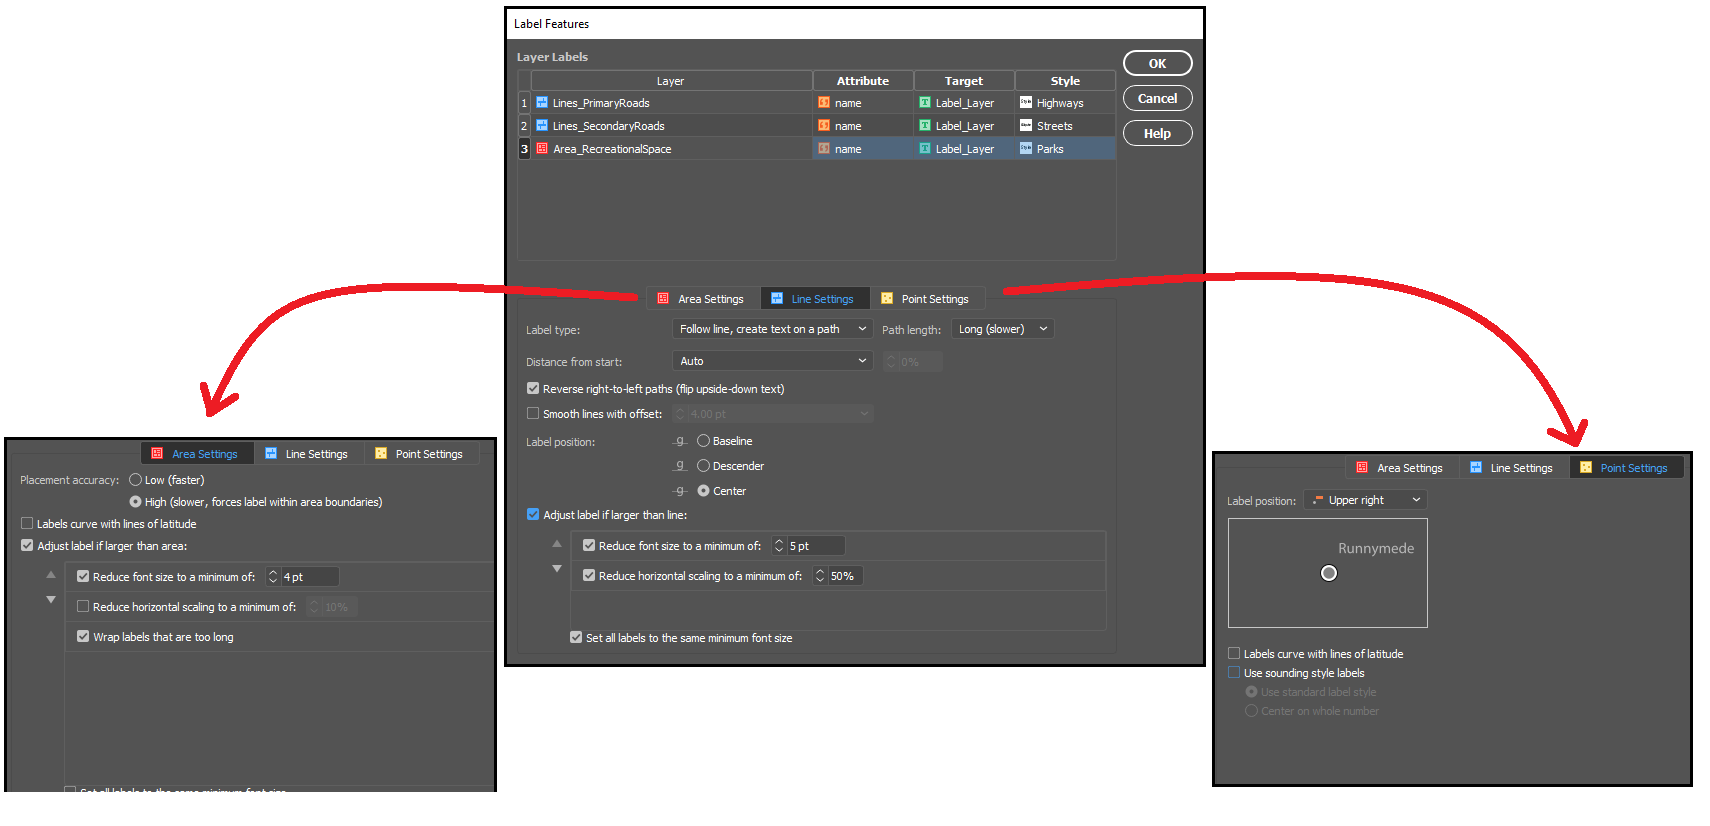
Taking a look at the tool, we were able to quickly generate over a hundred labels, for every road, trail, river, and park layer in our Ouray map. By nature, the tool will present you with a large number of labels for each feature, allowing us to examine and choose the labels we wish to retain and remove those that we don’t. With a little bit of clean-up to remove those extra or unwanted labels (see the animation below), we can already see our labelled map is coming together!
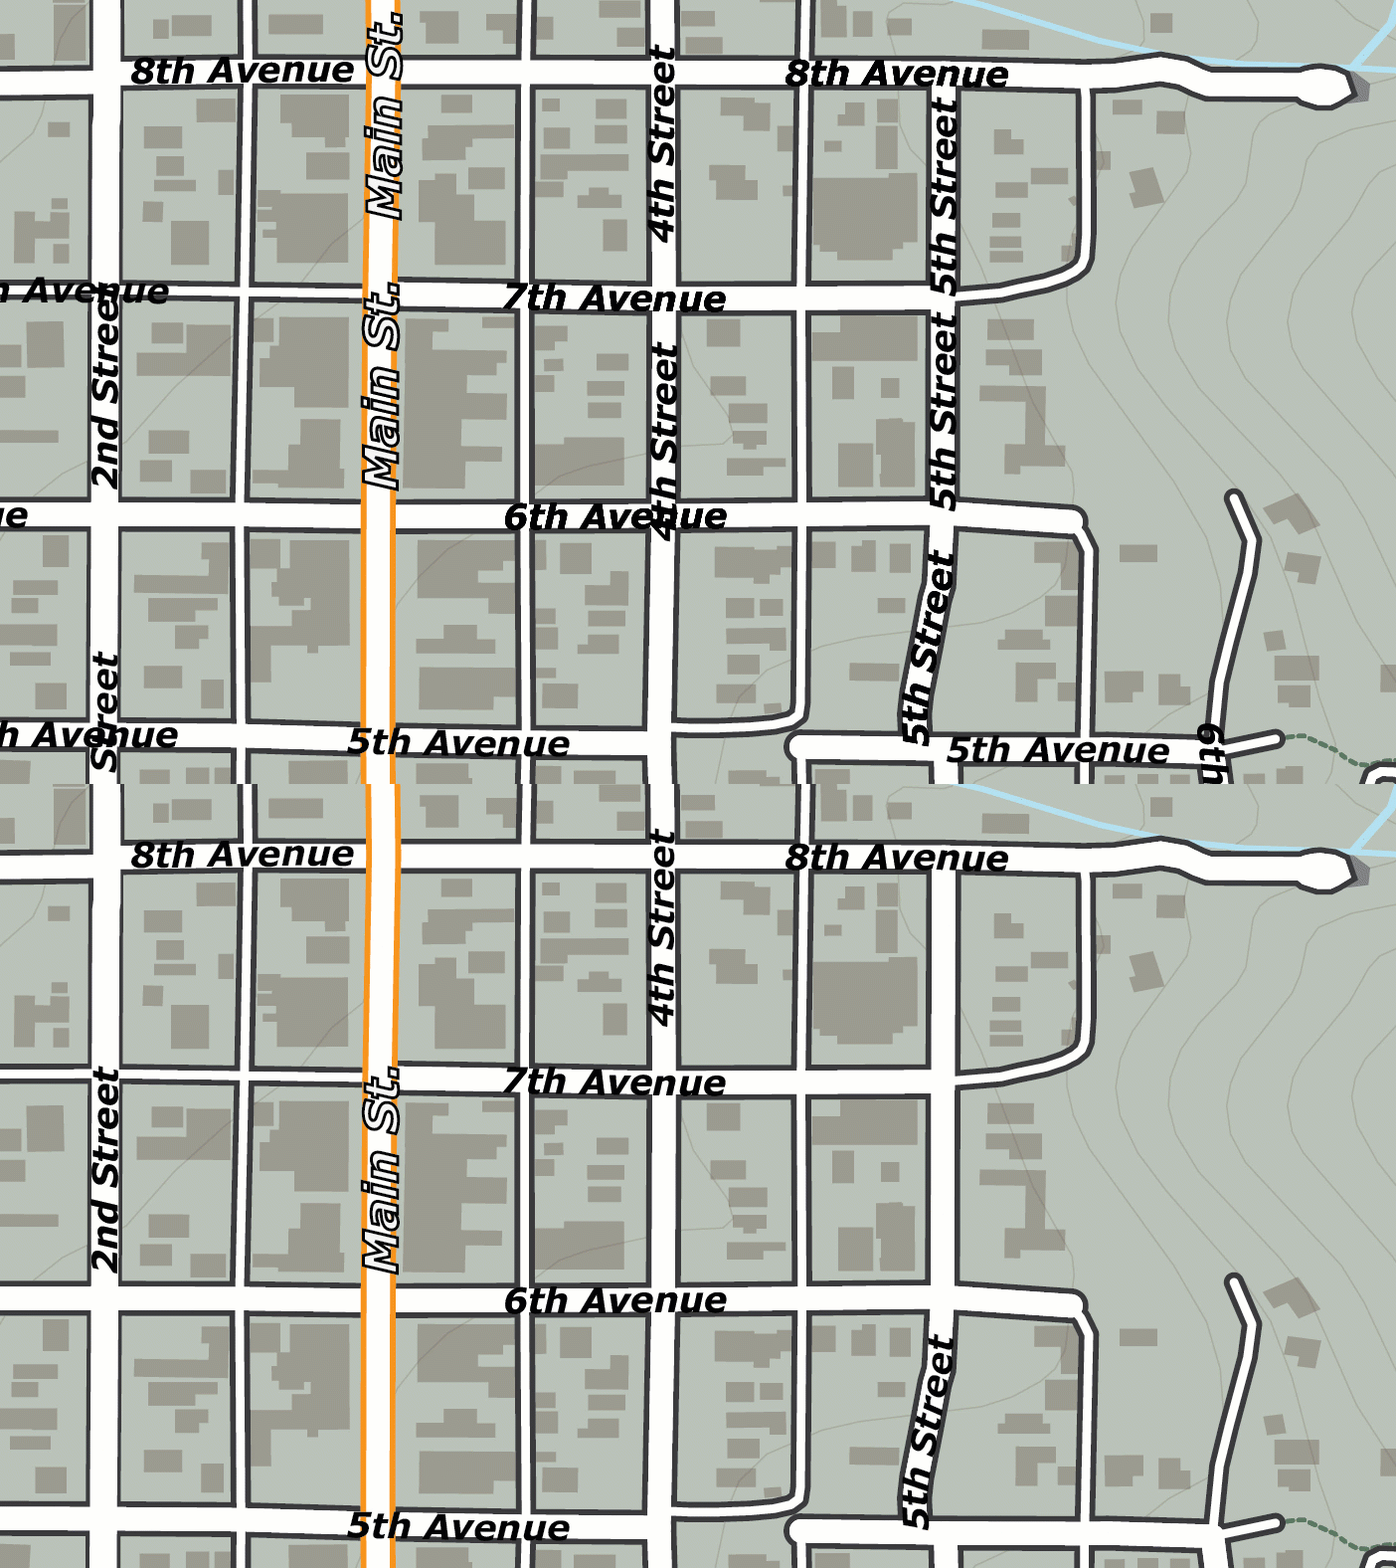
The Label Features tool is great for getting a head start on large labelling projects, but you might notice that the output of the labelling tool still requires some manual intervention to clean-up the output. For example, notice how “4th Street” and “5th Street” labels are repeated several times over the length of the street, with some labels colliding with others to create an overlap. This is a common problem in many labelling tasks and is due to the way our input data is structured. The dataset we obtained presents each road in the town as a line, but rather than present each road as a single continuous feature, it breaks up each street into several linked segments. Although this can be corrected with manual editing, it can still be time-consuming when working with a high number of labelled features. To avoid this, we need a method of achieving smarter batch label placement that can detect and reduce instances of label collision or redundancy. 

Fortunately, we have one last trick up our sleeves that makes even the most complex labelling tasks a breeze. We can use MAPublisher LabelPro for collision-free, rules-based label placement.

Better Labelling with MAPublisher LabelPro

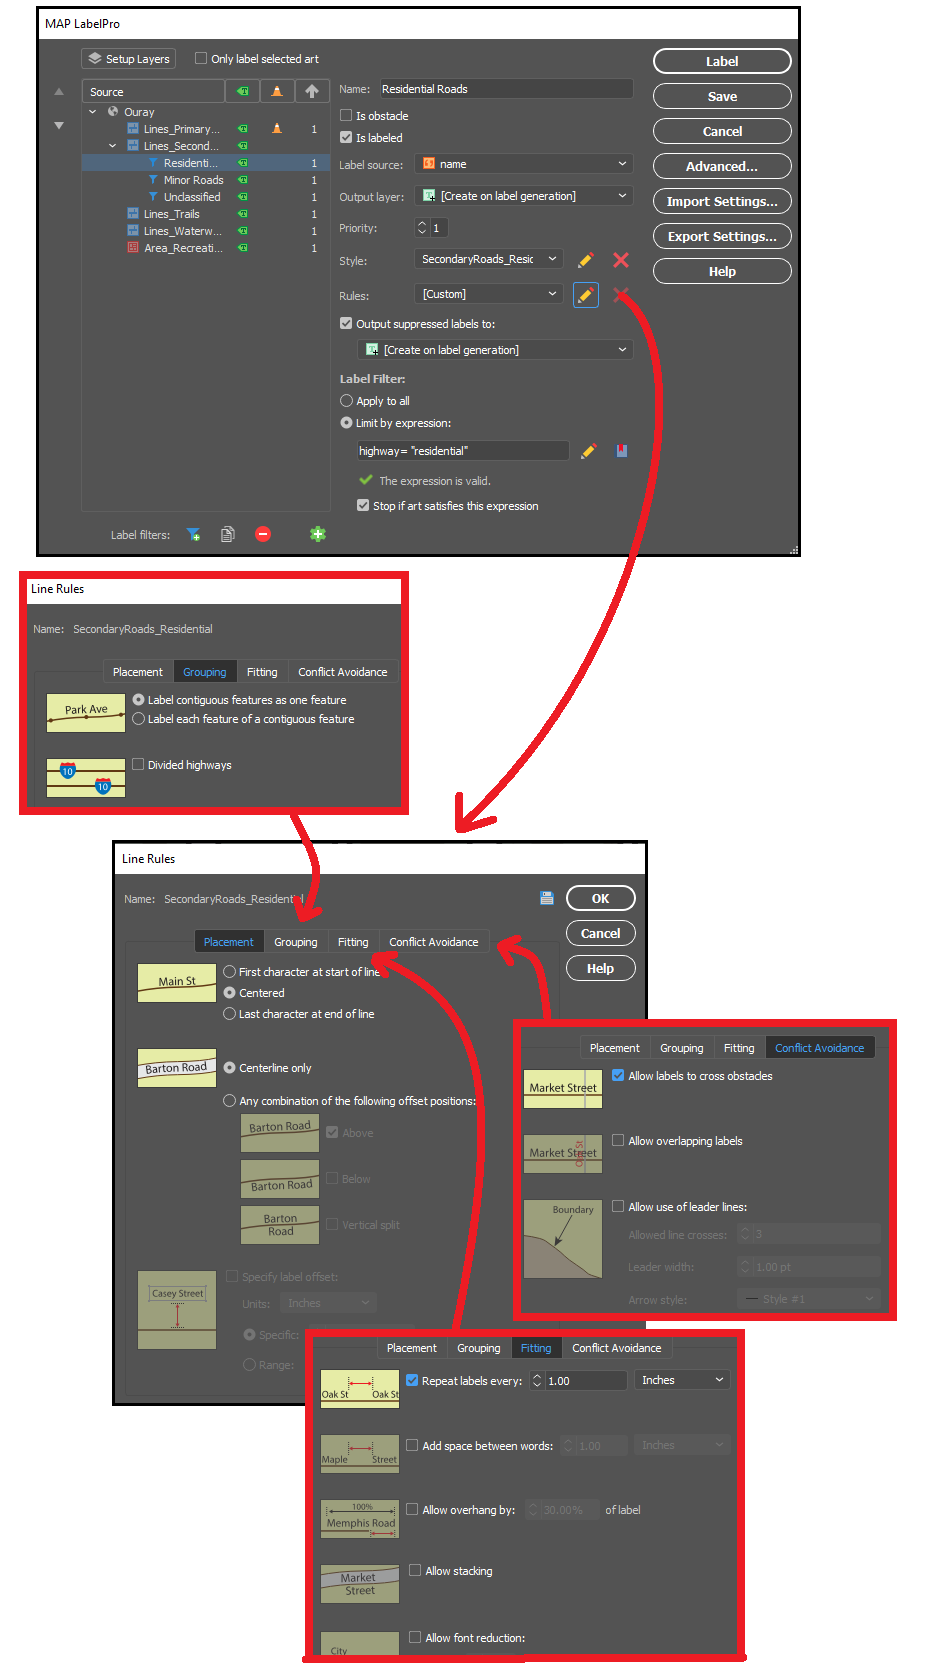
The MAPublisher LabelPro add-on allows the user to customize a wide variety of enhanced labelling options that result in smarter, more efficient label placement. LabelPro comes with a powerful purpose-built labelling engine that handles not only label placement, styling, and pathing, but also optimizes the grouping, fitting, and collision avoidance of labels to reduce crowding, avoid label overlap, and eliminate label redundancies. 

Remember those overlapping labels we ran into with the Ouray map? With LabelPro we can set rules that treat street segments as contiguous features in a single line, meaning the labelling engine will efficiently place labels that are representative of the entire street, rather than just for each segment. The intelligent collision and fitting rules mean we can also prevent labels from overlapping each other or crowding the map, saving us time and effort by letting the tool handle precise label placement with minimal clean-up. By setting layer priorities designating certain layers as obstacles we can make sure our important labels are unobstructed, and other labels do not cross other features in a way that would confuse the map viewer. 
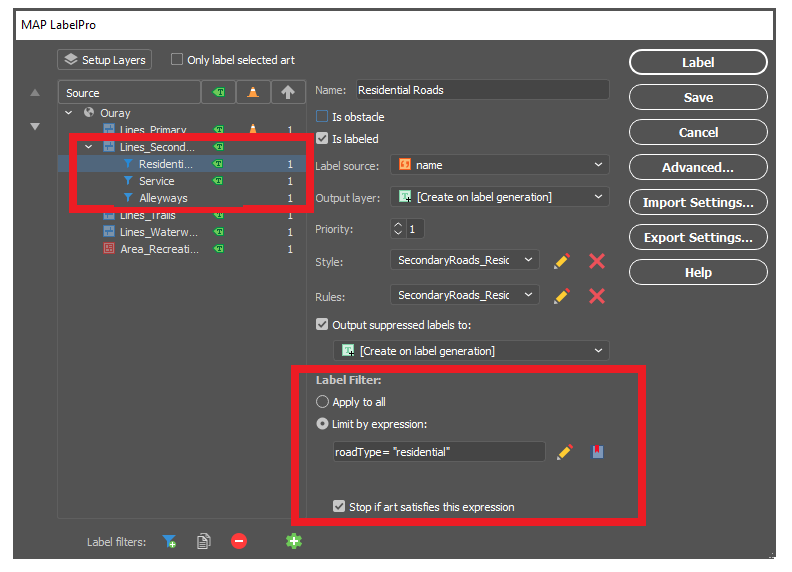
With LabelPro, we can also create expressions to apply conditional character styles and rules based on attribute values in the data. In our map, we created label filters for “Residential Roads”, “Service Roads”, and “Alleyways”, allowing us to label (or not label) certain road types differently, even though they are all contained in the same “secondary roads” map layer. These are only a few examples of the robust collection of configurable rules and smart labelling options available to tackle even the most complex labelling tasks.
With our rules set up and all character styles defined, in very short order we could automatically generate labels for all rivers, roads, highways, parks and trails in our Ouray map. The smart placement with LabelPro means we spend less time manually correcting label placement and allows us to produce maps more efficiently and easily. If you want to read a more in-depth, tutorial style article that shows you the exact steps we used to easily create our simple map of Ouray, check out this great workflow article produced by our support team – Here!
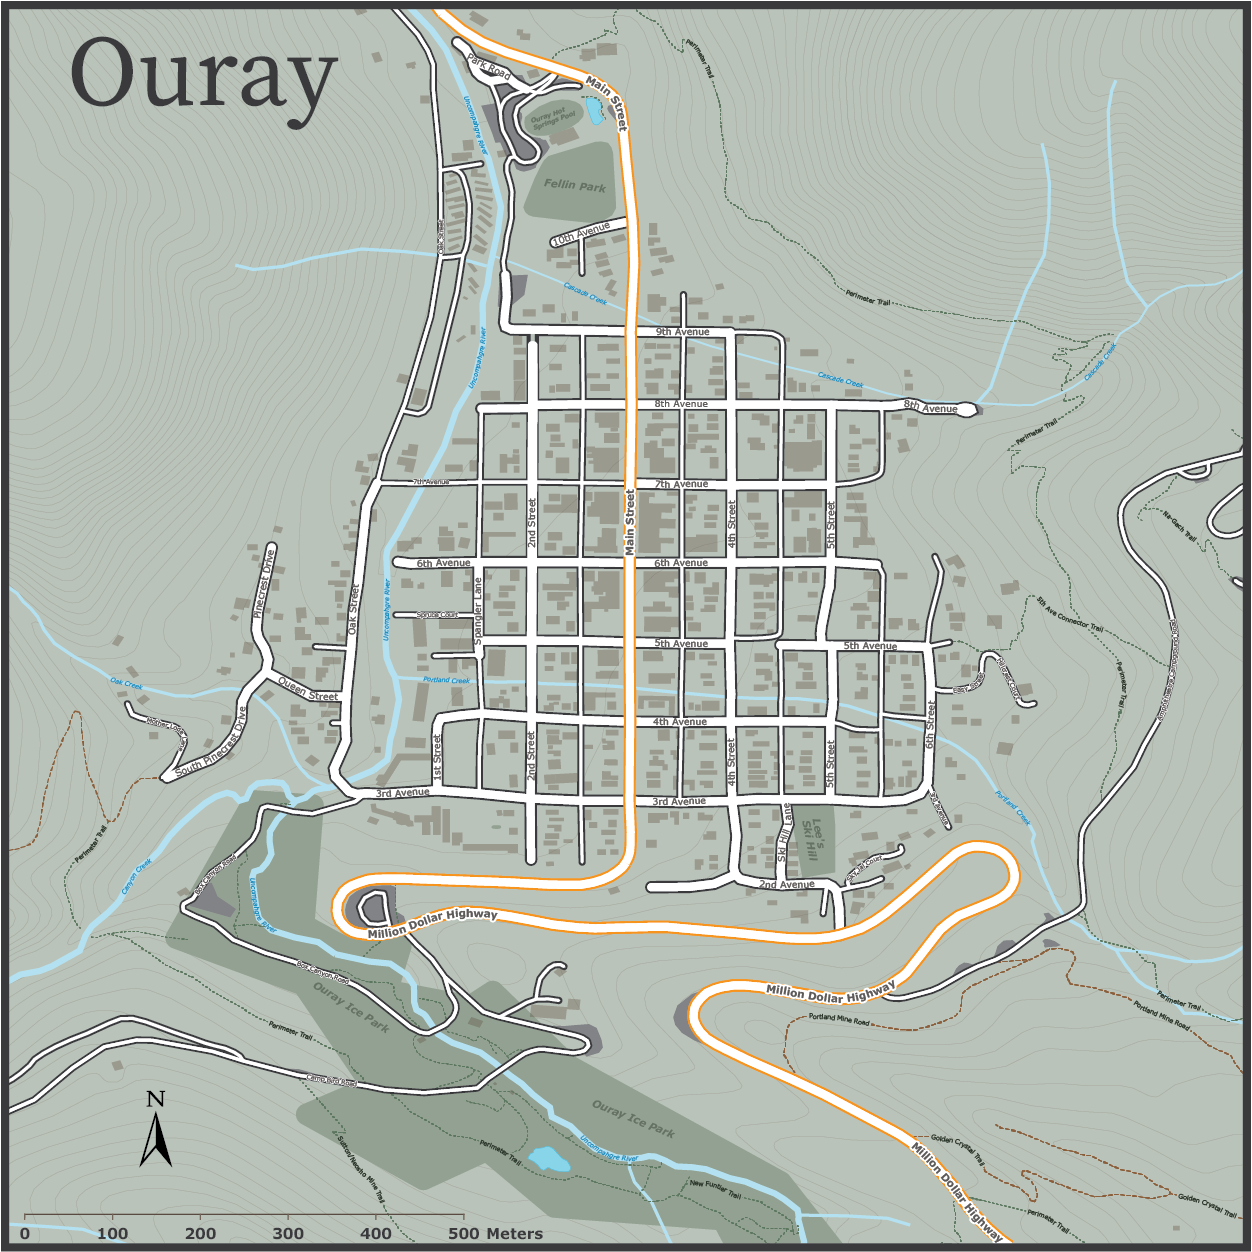
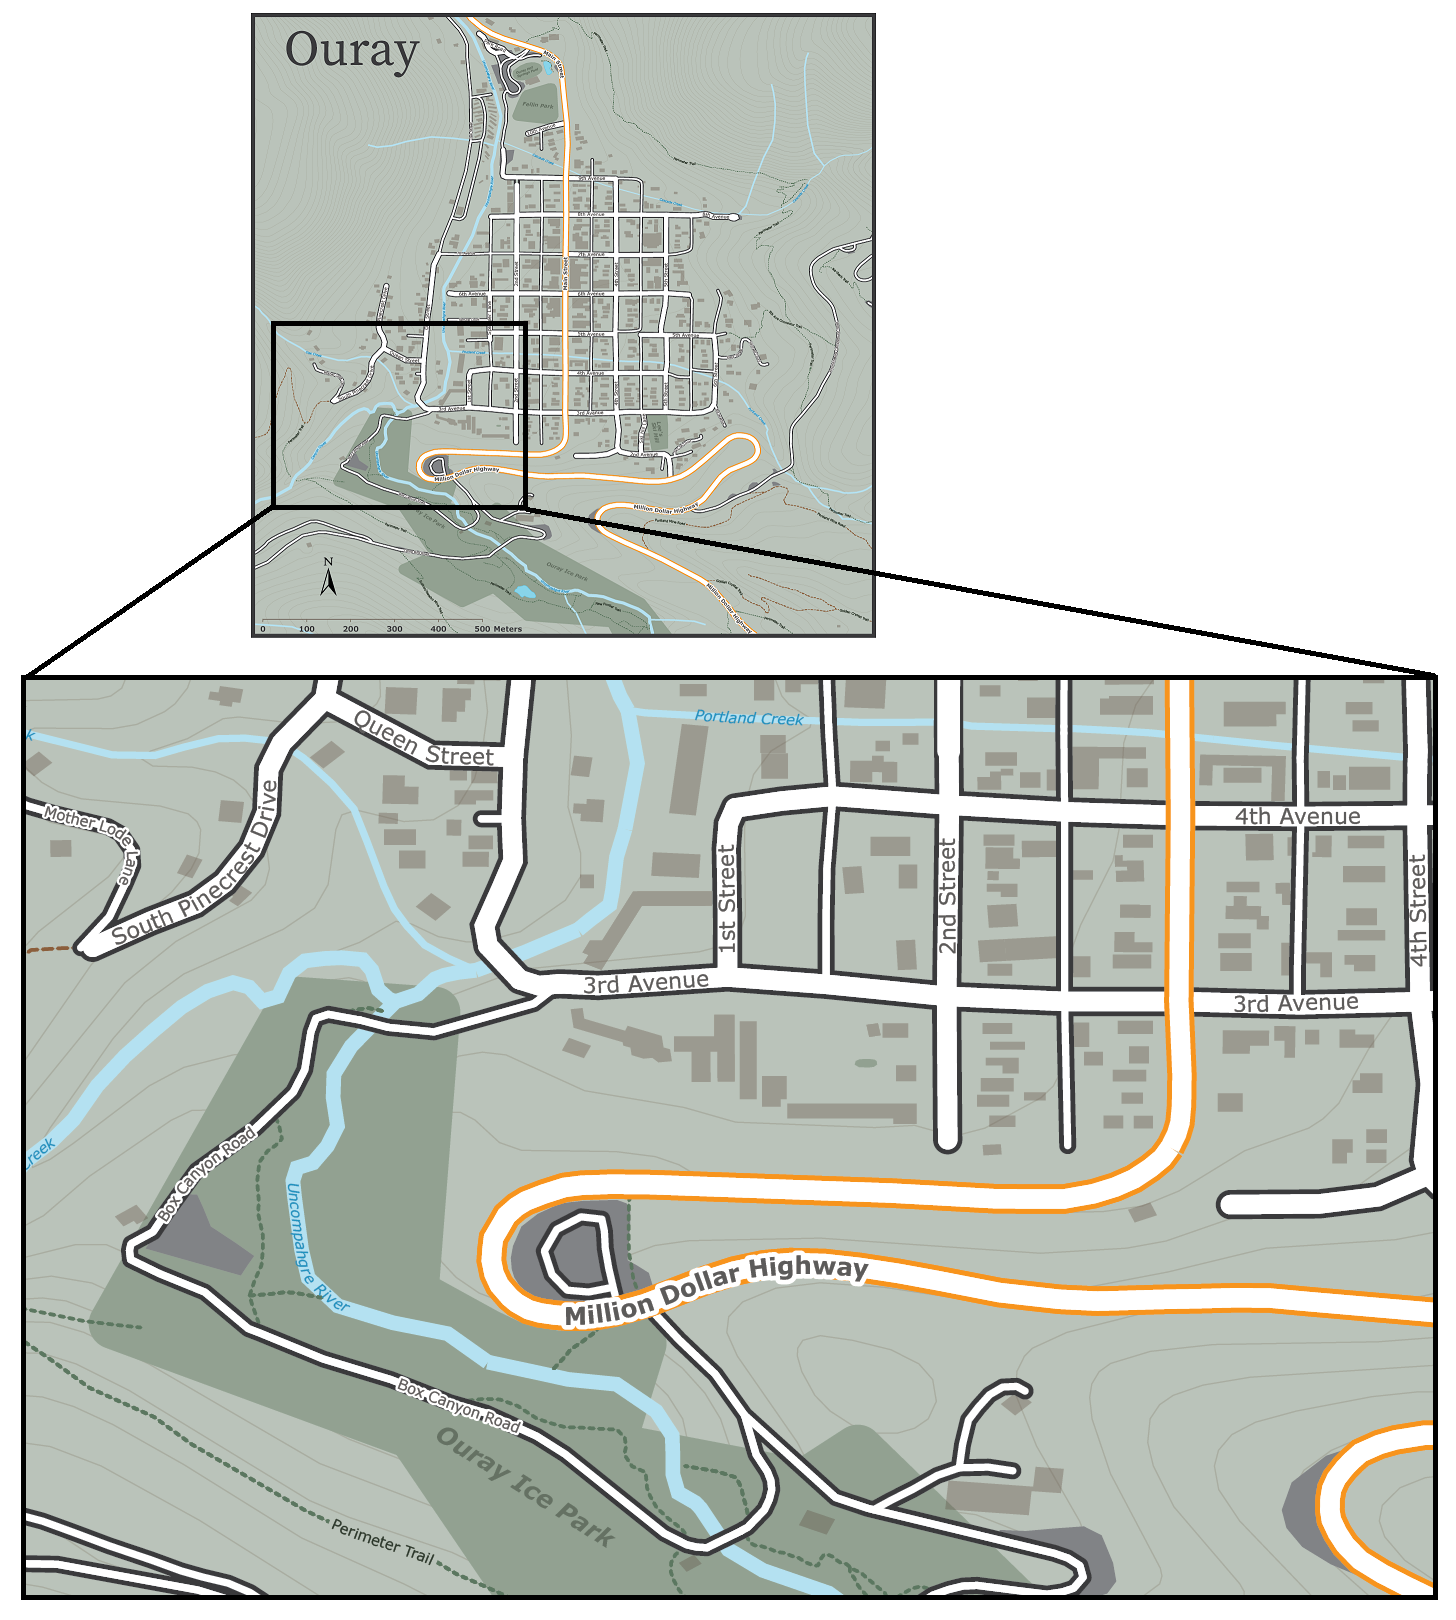
 

Data sources: All datasets were obtained from OpenStreetMap and the Ouray County Open Data portal.

People, Parks, and the Pandemic: Designing Infographics with Avenza MAPublisher

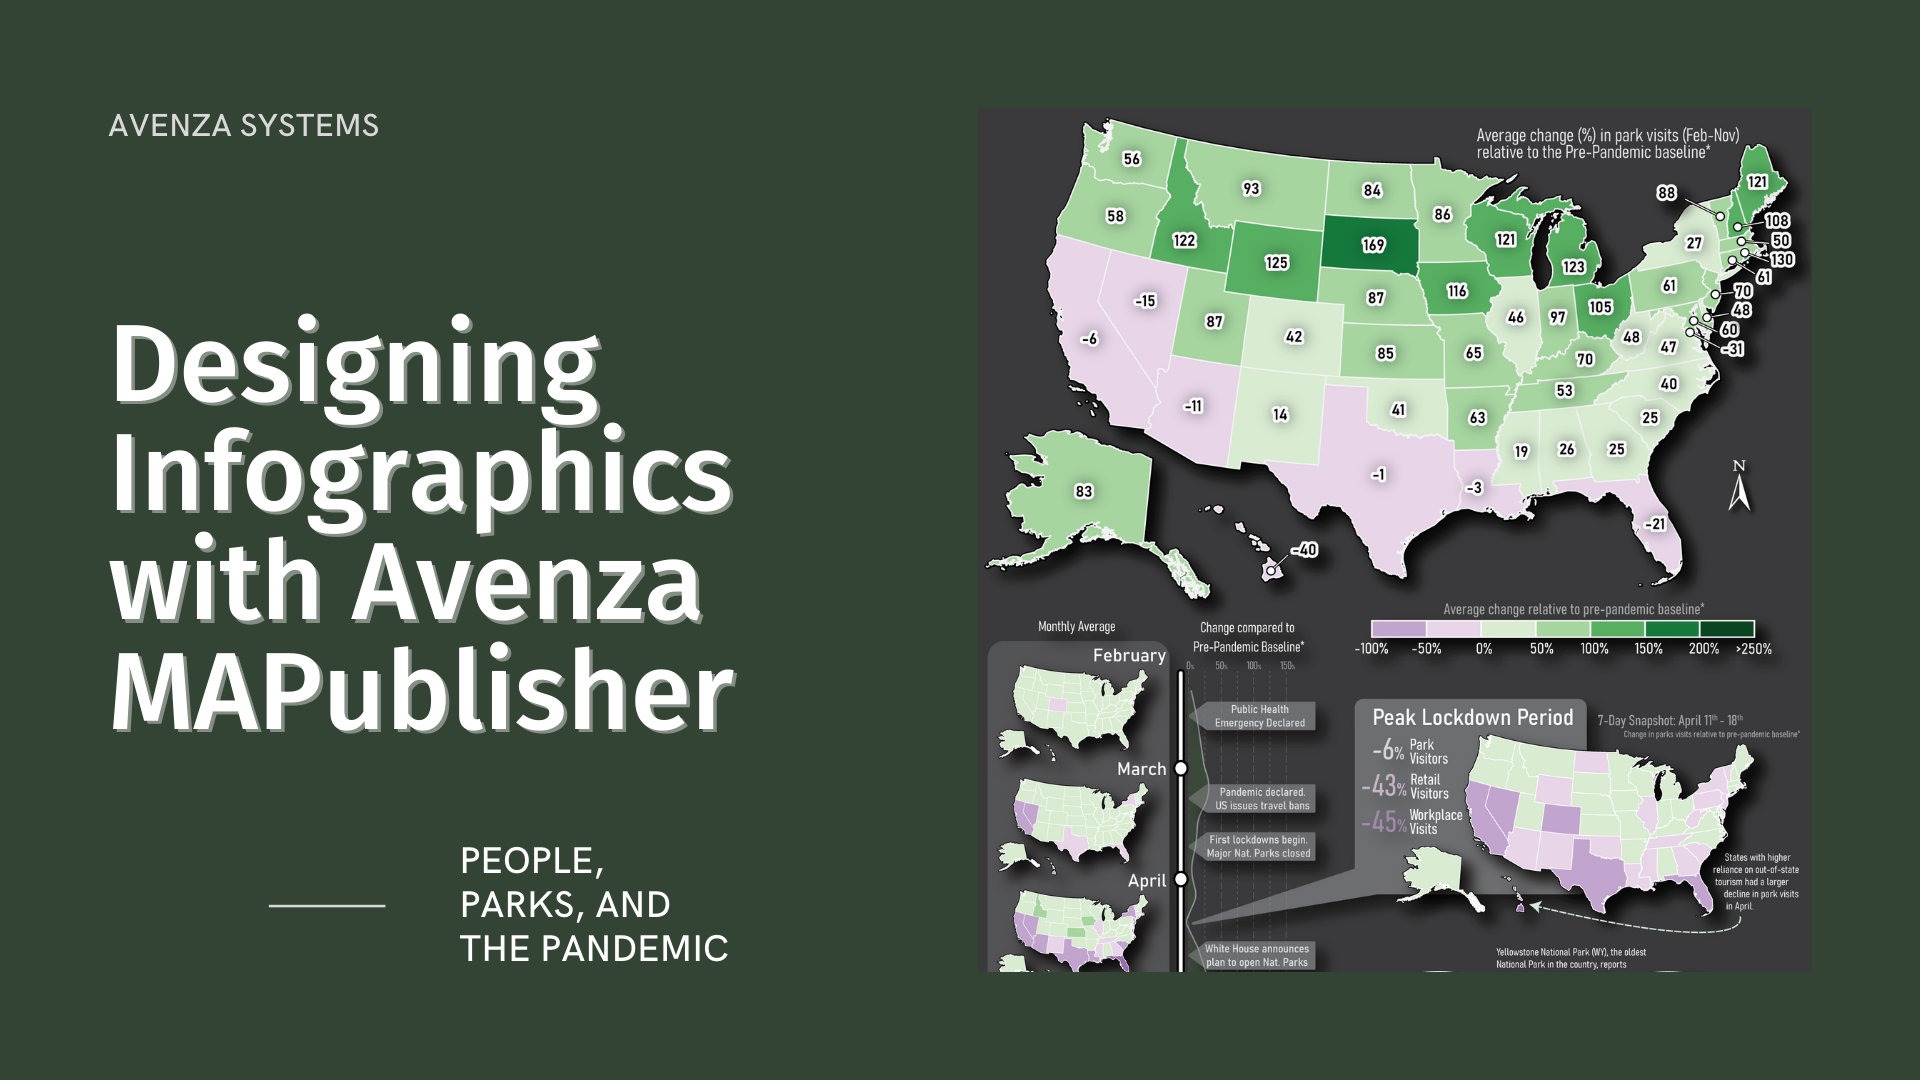
Here at Avenza, we love finding interesting data and using it to create engaging maps. In this blog, we show you how we used the powerful spatial data manipulation and cartographic styling tools found in MAPublisher for Adobe Illustrator to create an infographic exploring how park visitor patterns changed in the United States in 2020 using a truly interesting openly available dataset.

Recently, Google made its COVID-19 Community Mobility Reports public. These reports use aggregated anonymous mobile GPS data to explore how global human activity patterns in specific location categories (parks, retail, transit, residential, workplaces, and grocery) changed as a result of the ongoing pandemic. The U.S. dataset is massive, containing estimates of daily visitor activity for each location category in every county. Each data point provides an estimate of that day’s percentage increase or decrease in visitors relative to a pre-pandemic baseline period, meaning the data reflects how pandemic restrictions on that day may have impacted park space usage in that specific location.  Below shows a sample of the raw dataset, listing five data points covering Feb 15-19th activity patterns in a single Colorado county.

We downloaded the complete dataset (February to November 2020) from Google’s mobility reports data portal. The dataset contains nearly 900,000 records of all 3,143 counties in the U.S.  We wanted our infographic to focus on the parks category, which includes every national, state, and local park, as well as public forests, campgrounds, beaches, marinas, dog parks, and gardens. Using the open-source statistical programming language R, we were able to aggregate the dataset into a more manageable size. Below, you can see how some basic filtering of these “cleaned” datasets already shows evidence of some interesting patterns, but we felt that mapping the dataset would be much more engaging.

Maps are powerful story-telling tools, and we felt this data would be more interesting if you could see how park visitor patterns changed not only with time but also with geography. To make working with map data in Adobe Illustrator easier, we used the MAPublisher Import tool to load in a shapefile of U.S. state boundaries. The tool allows us to treat our dataset as a fully functional graphic element in Illustrator while still retaining all geographic properties integral to spatial data (attributes, topology, and coordinate systems). 

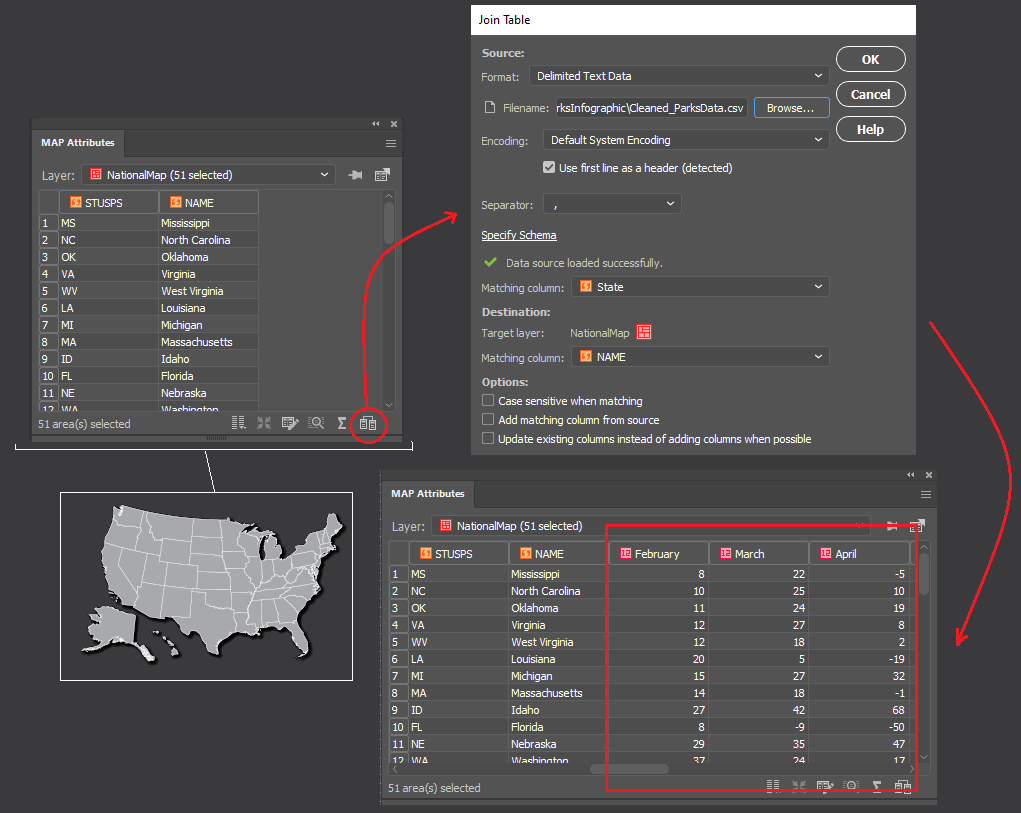
To visualize the data as a map, we needed a way to associate each record in our tabular dataset to a specific location (in this case, a State). To do this, we used the Join tool, which takes our “cleaned” tabular parks dataset (stored as a CSV file), and links it to our mapped states shapefile using the shared State names column. 

We started to think about how to design the layout of the infographic (this is where having a mapping environment in Illustrator really shines). We wanted it to consist of three main parts: a large labelled map showing the average change in park visits over the entire year; a vertical series of maps showing how park visits varied month to month; and a handful of pop-out maps with insets highlighting specific points in the year and specific regions of the country.

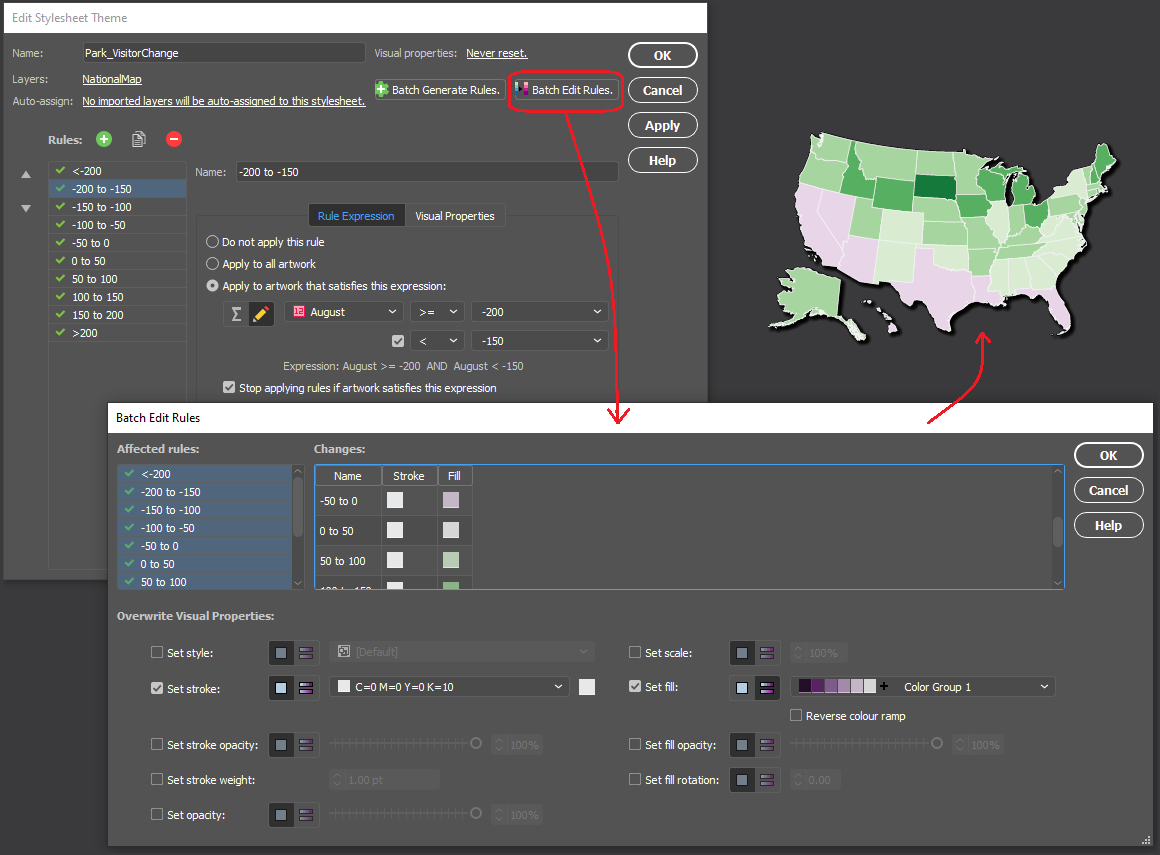
We chose to stylize the data into thematic maps, which use colour to represent specific values in the data at different locations. Instead of tediously configuring individual colour fills, we used MAP Themes to establish a rules-based stylesheet that applies a colour automatically to each State based on the monthly park visitor columns stored in the map layer’s attribute table. We chose a “thematic map” colour group from the included ColorBrewer 2 swatch library to best show positive and negative changes in park usage. 

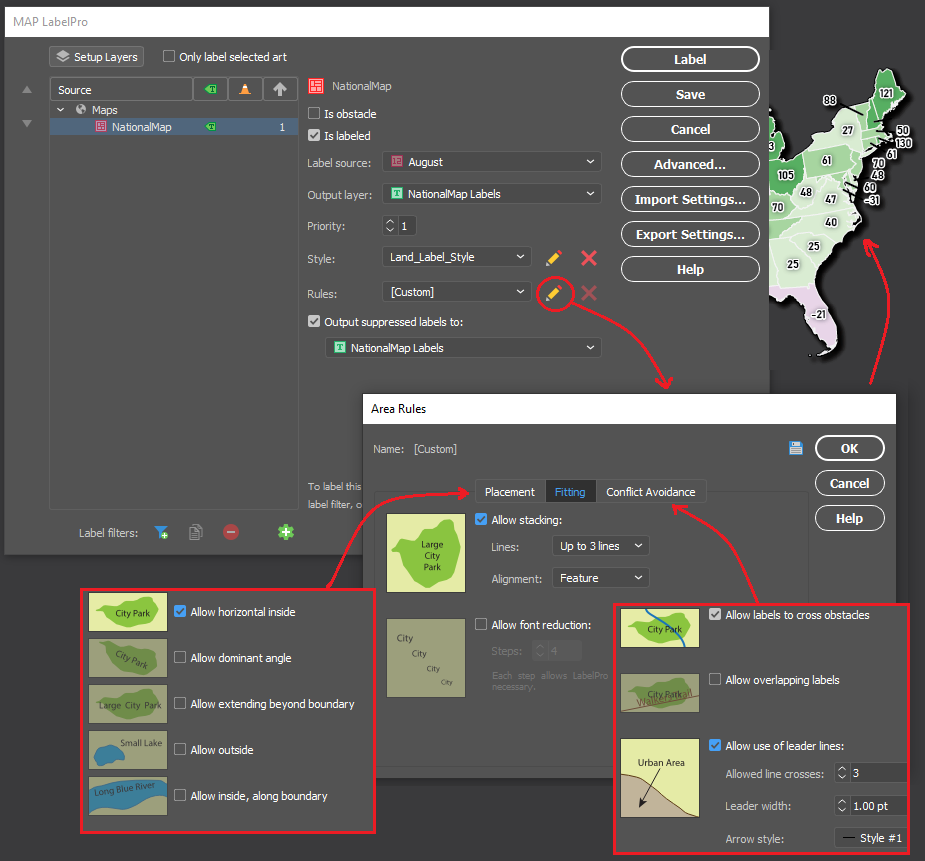
Next, we populated our main map with labels showing the percentage change in park use for each state. As many cartographers know, placing and configuring labels can be a significant time sink. Fortunately, we could use the MAPublisher LabelPro add-on to provide collision-free, rules-based label placement. We could configure the label rules to automatically handle collisions, alignment, and placement of labels for each state. Using the leader lines option in the LabelPro Rules panel, we were even able to create offset labels that prevent crowding the map.

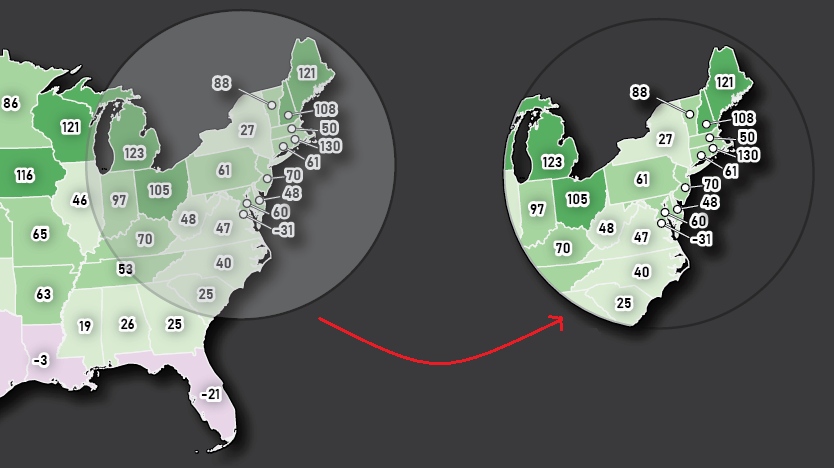
Finally, we decided that to create some insets to highlight specific parts of the country.  From a “master” map,  we used the Crop to Shape tool to crop the map data to our desired inset extents. Using Crop to Shape is quick, and also retains the styling elements (colours, labels, strokes), topology, and attribute integrity of the cropped map layers. 

With most of the maps completed, all that was left was to populate the infographic with text and graphics. Using the MAPublisher layout tools, we added a functional North Arrow and customized the automatically generated legend layer to suit our infographic’s design. Lastly, we used an Illustrator graph tool to create a vertical line graph of park activity along the left side of the infographic.

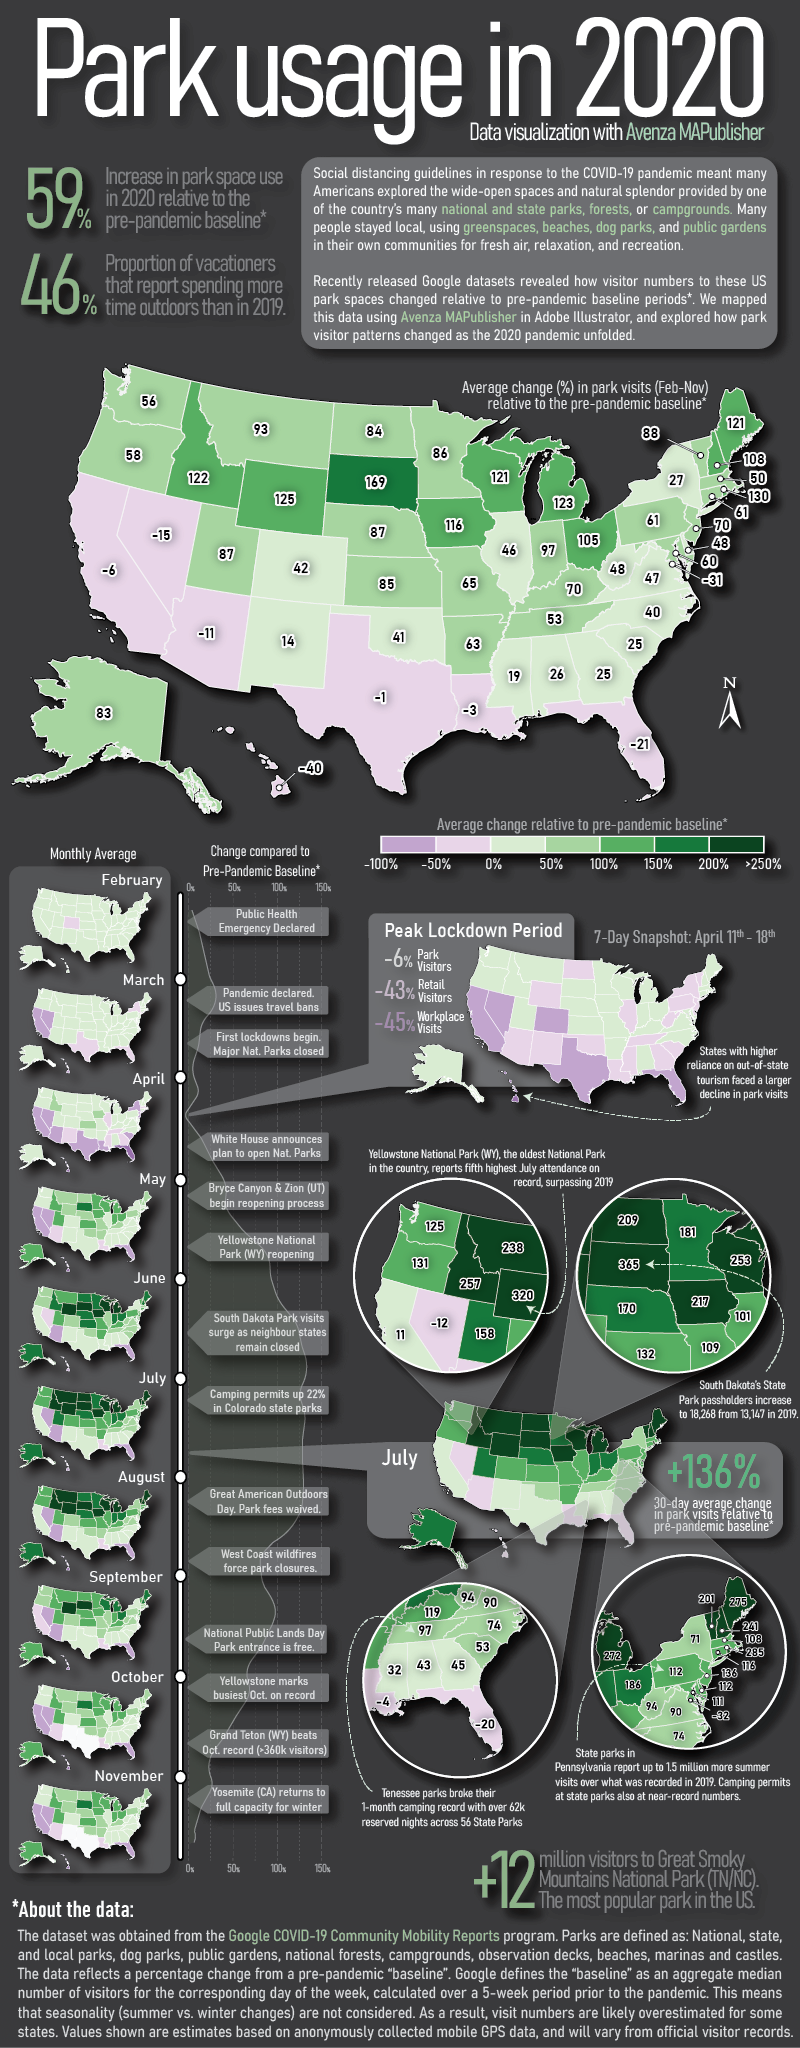
Presenting the dataset in this way makes it much easier to extract insights and craft a story from the data. Some patterns are immediately noticeable, such as the overall increase in park space usage that is observed for most of the US during the pandemic period. This isn’t exactly unexpected, as parks were one of the most accessible forms of leisure activity and recreation amid widespread social distancing and retail/entertainment closures. We also see how state-specific factors may have affected park usage in different regions of the country at different times. Some states, such as South Dakota, had eased restrictions on out-of-state visitors to their park systems, resulting in a spring season surge in park usage earlier than their neighbours. Conversely, states which typically draw a high proportion of international tourists, such as California, Hawaii, and Florida, saw more of a decrease in average park usage as a result of global air travel decline. These patterns and stories are one of many that can be identified, providing compelling examples of why maps are such powerful tools for visualizing data.

The beauty of working with MAPublisher to create this map-heavy infographic is that we were able to implement the powerful mapping and data manipulation tools of a dedicated GIS while seamlessly integrating the advanced art and design tools offered by the Adobe Illustrator graphical environment. Together, these tools turned what would have been a complex workflow of importing and exporting data between different software, and allowed us to create the entire infographic in a single mapping and design-focused fully integrated workspace.

See the Full infographic below:


References:

Data – https://www.google.com/covid19/mobility/
Pandemic Timeline – https://www.ajmc.com/view/a-timeline-of-covid19-developments-in-2020
Raw Park Visitor Stats – https://irma.nps.gov/STATS/
Camping Stats – https://koa.com/north-american-camping-report/

News Reports and Park/State-Specific Articles

“Camping in Tennessee’s State Parks Increase during Pandemic.” Wreg, AP, 9 Dec. 2020, wreg.com/news/camping-in-tennessees-state-parks-increase-during-pandemic.

Marcus Schneck. “Camping at Pennsylvania State Parks ‘Going through the Roof’ as Coronavirus Restrictions Ease.” Pennlive, 1 July 2020, www.pennlive.com/coronavirus/2020/07/camping-at-pennsylvania-state-parks-going-through-the-roof-as-coronavirus-restrictions-ease.html.
Anderson, Patrick. “National Parks in South Dakota Remain Open as Others Close across the Country.” Argus Leader, 17 Apr. 2020, eu.argusleader.com/story/news/business-journal/2020/04/17/coronavirus-south-dakota-national-parks-remain-open-others-close/2981675001.
Henderson, Catherine. “Having a Hard Time Finding a Campsite in Colorado This Summer? You’re Not Alone.” The Know Outdoors, 15 July 2020, theknow.denverpost.com/2020/07/15/colorado-camping-covid-national-parks-state-parks/241704.

Wiley, Melissa. “What the 10 Most Visited National Parks in the US Have Said about Their Plans to Reopen, from Opening in Phases to Implementing Social Distancing Guidelines.” Business Insider, 21 May 2020, www.businessinsider.nl/are-national-parks-open-covid-19-coronavirus-united-states-nps-2020-5?international=true&r=US.

Optimizing Point Symbol Placement with MAPublisher LabelPro

This post was contributed by Hans van der Maarel of Red Geographics.


The problem with using GIS data for point symbols is that depending on the scale and symbolization you often end up with symbols partly overlapping each other. Of course, the symbols can be manually moved around after initial placement to get a more aesthetically pleasing result, but that can be a tedious and time-intensive task.

Thankfully, there is a way to automate at least part of this process by using MAPublisher and LabelPro.

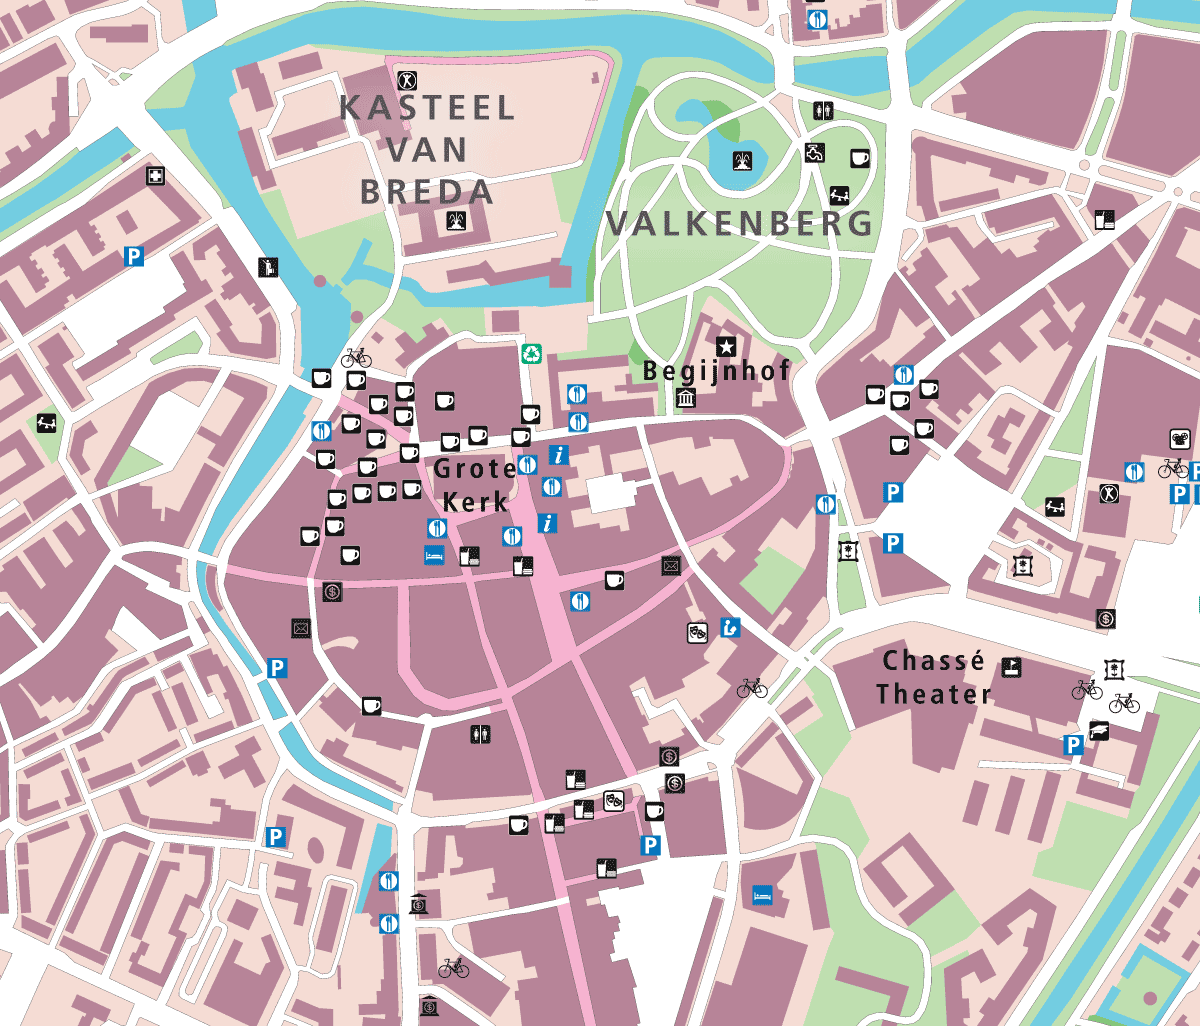
Example map of Breda, The Netherlands

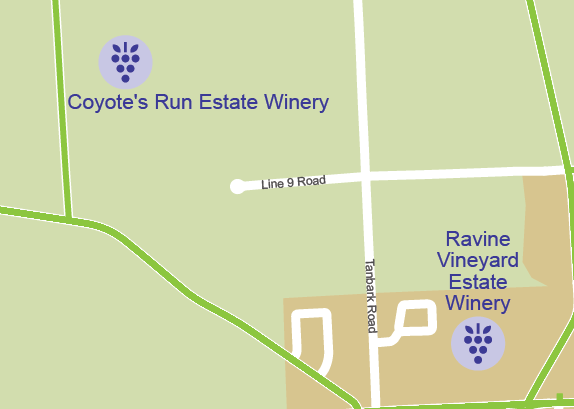
This example shows the heart of an old European city (Breda in The Netherlands to be exact). The map is composed of Dutch Top10NL topographic base data, a few labels were manually added for larger features (such as the park), and points imported from OpenStreetMap (OSM) and styled using a Map Theme. As you can see, there are a number of spots where the symbols are densely located and overlap each other.

The MAPublisher LabelPro add-on is capable of collision-avoidance to make sure overlaps don’t happen. But it only works when generating labels (text). Fortunately, the solution is to trick LabelPro into processing symbols too, so that they can benefit from better placement without overlaps.

Let’s start by adding a column to the attributes to the OSM points layer and filling it with a default value, a capital O.

Thankfully, there is a way to automate at least part of this process by using MAPublisher and LabelPro.

Editing the attribute schema

Next, determine how big the symbols are. On the artboard, use the Type tool to place a capital O and adjust its size so that it’s about the same size as one of the point symbols. In this case, a 14 pt Futura Medium, shown here in red, seems to cover it well (your results might be different).

Determine the approximate font size

Futura is a good font in this case because the O is a perfect circle. Once you’ve determined the approximate font size to use, delete the O text as it won’t be needed anymore.

Next, set up the LabelPro labelling rules. Since there is already a layer with the manually placed labels and the symbols shouldn’t interfere with them, the manually placed labels will be designated as an obstacle layer. The symbols layer will be labelled with the attribute created earlier and the style set to the font and size that was just determined.

Set obstacle layer

Setting the appropriate rules partly depends on personal preference but it’s important to specify that the placement prefers the center position (position 1 on the placement control). In other words: if there’s enough space for placement, the label doesn’t need to be moved or offset. Another important rule to configure is that font reduction should be turned off. All of the labels (eventually symbols) are going to be a fixed and similar size.

Set placement point rules
Set fitting point rules

Also, another good practice is to specify a suppression layer. Any labels that can’t be placed with the rules set will be placed on the suppression layer. After placement, you can determine if any labels need to be adjusted manually.

Let’s label! Go ahead and label with these settings and afterward hide the original symbols layer and the suppression layer. The map is filled with O’s where the original symbols are located.

O labels placed

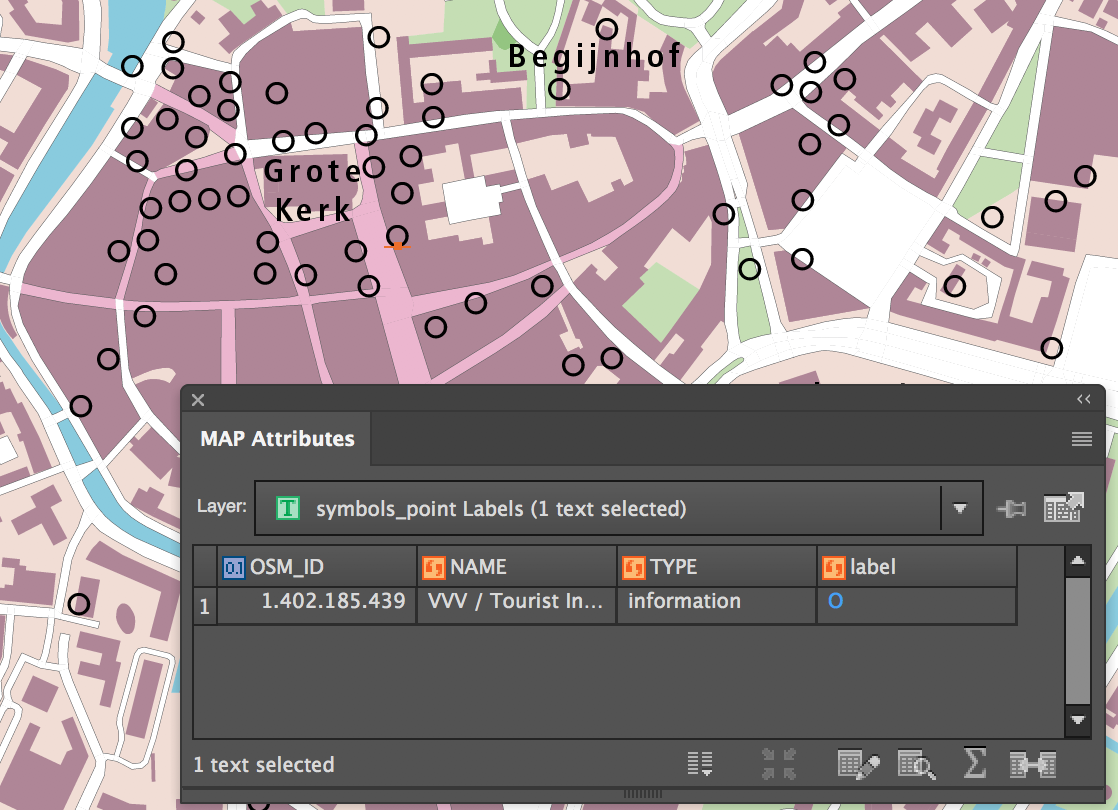
At first glance, this does not seem very useful, but closer inspection shows that the labels have retained the attributes of the original OSM point symbols.

Attributes migrated to the O labels

This means that if they can be turned back into points, they will be able to be styled!

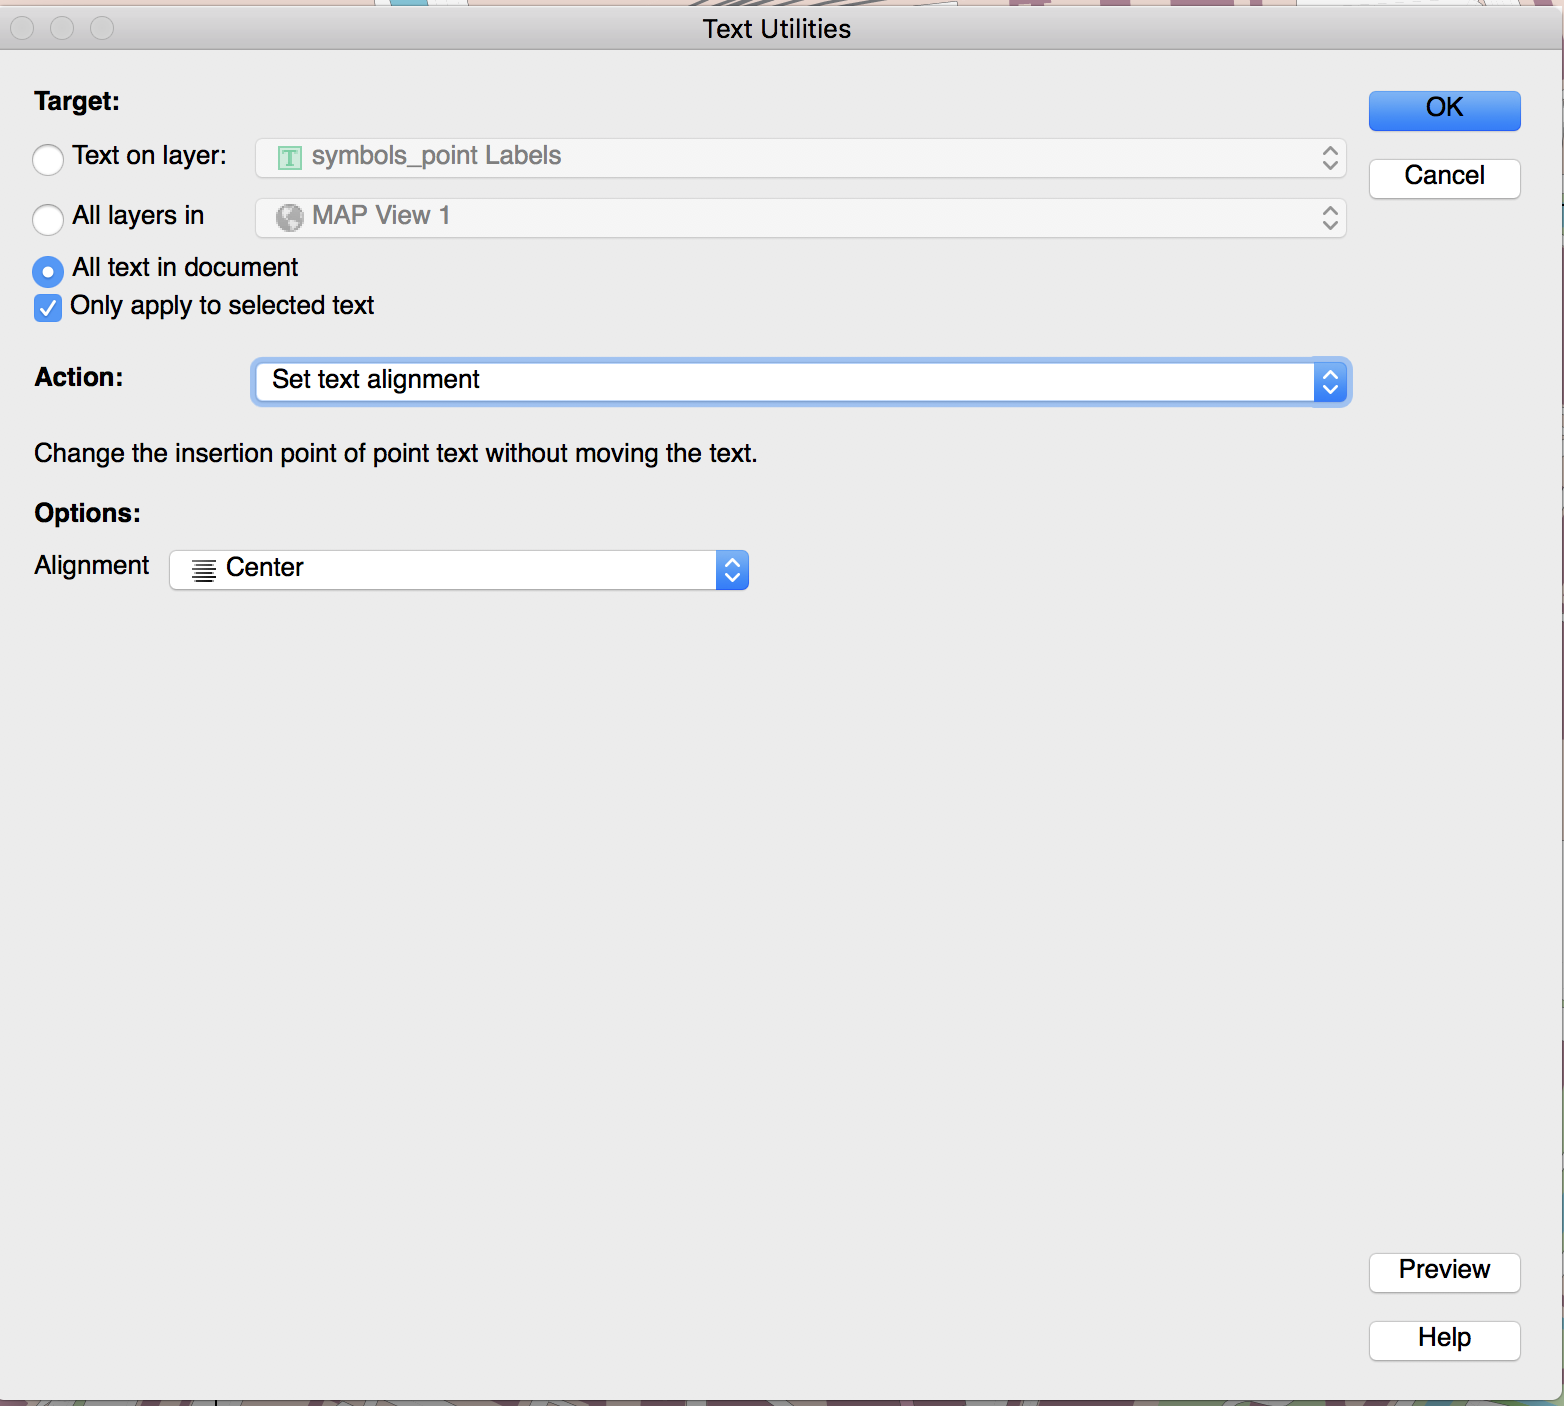
In order to turn them back into points, a text reference point needs to be created. In other words: a little dot on the text selection line, in the center of the O. This is a two-step process. First, select all the O’s on the artboard, open MAPublisher Text Utilities, and set the Action to Set text alignment and Alignment to Center. This action changes the alignment of the text without changing the actual position of the text (due to LabelPro labeling the text alignment is different based on where the label ended up in relation to the original point). This step takes care of the horizontal positioning.

Set text alignment in MAPublisher Text Utilities

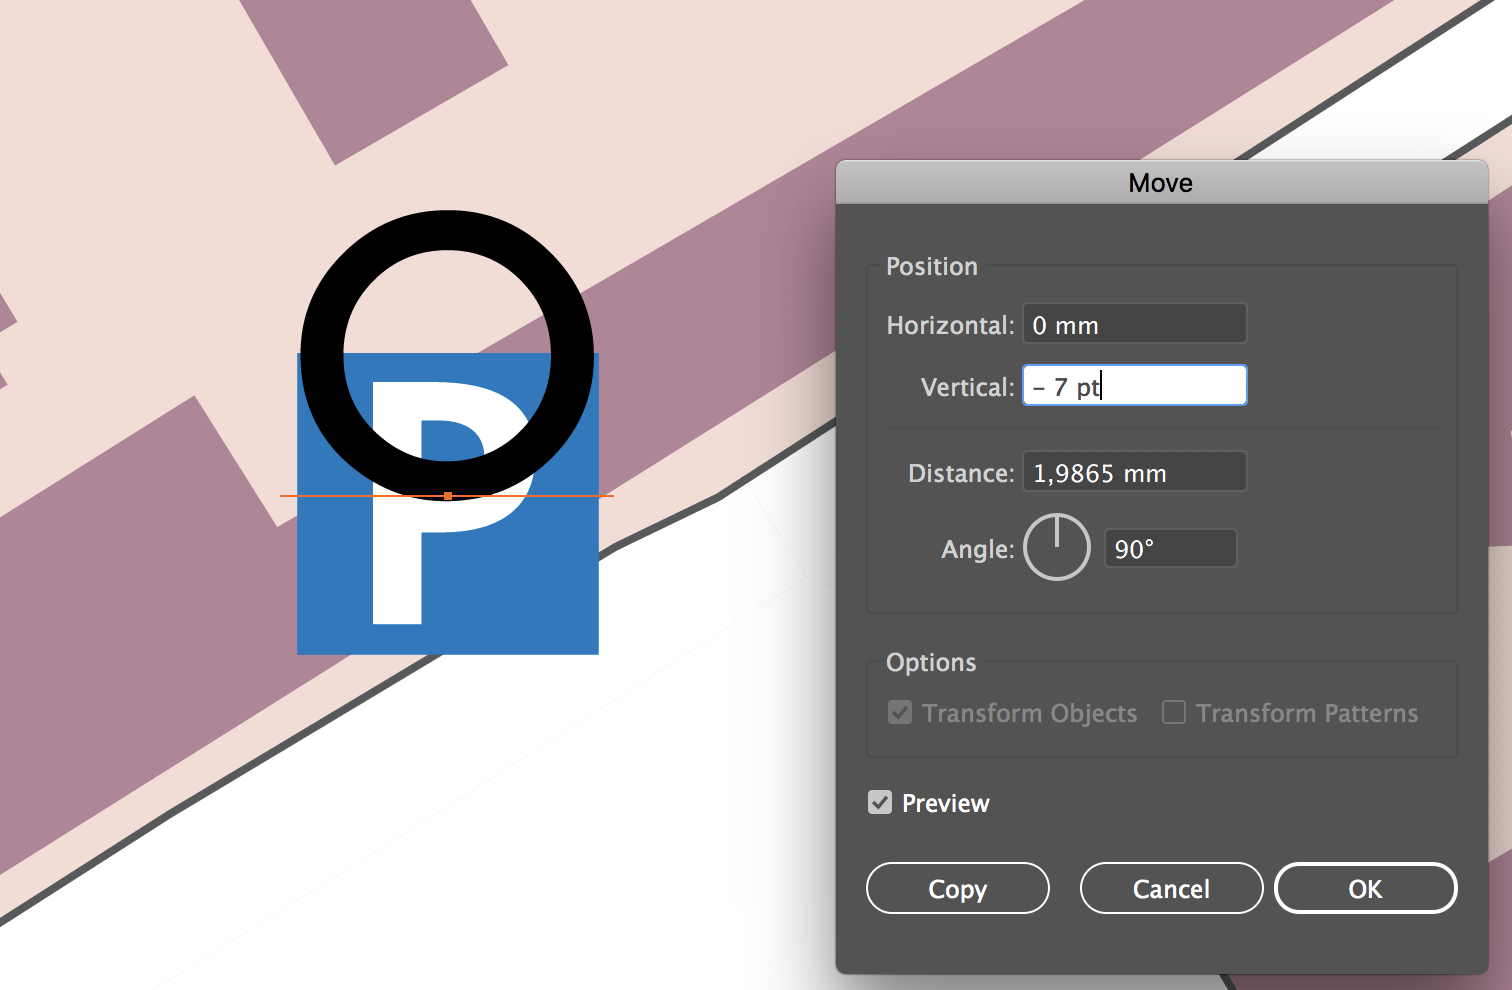
The second step is to adjust vertical positioning. Vertical positioning is adjusted by moving all text up by a certain distance. Make sure all the O’s are selected, then use the (Adobe Illustrator) Move tool. In the Position group, set the Horizontal to 0 (no adjustment here since Text Utilities was used), set the Vertical to minus half the text size (font size in this example was 14 pt, so a vertical adjustment of -7 pt), and the Angle to 90 degrees.

Use the Move panel to fine tune position

For reference, this example is zoomed into a symbol that did not get displaced.

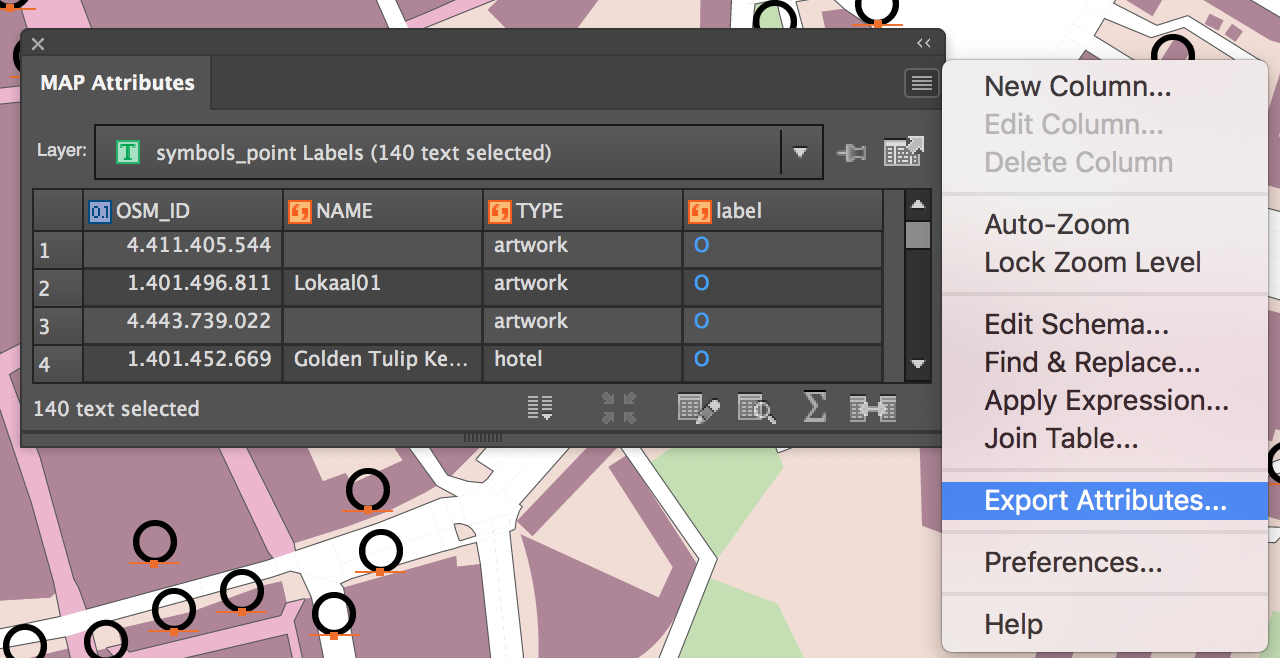
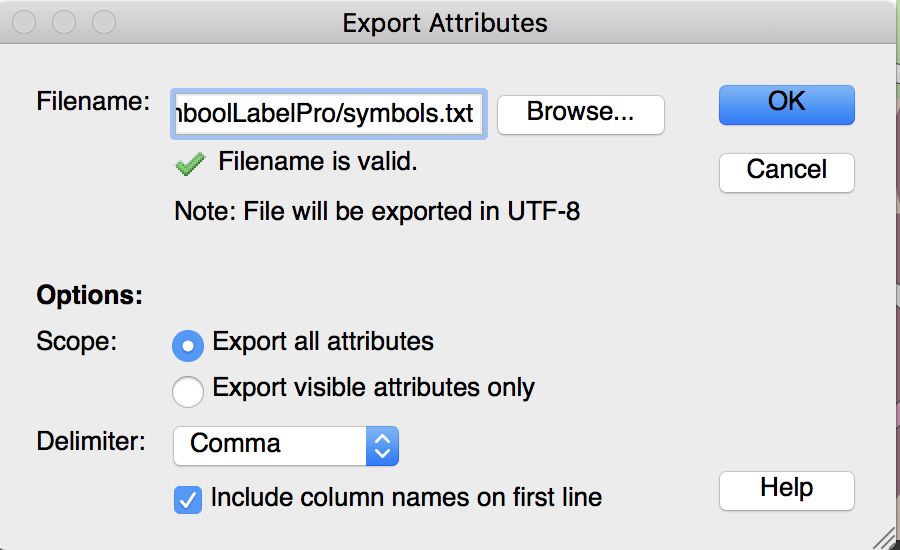
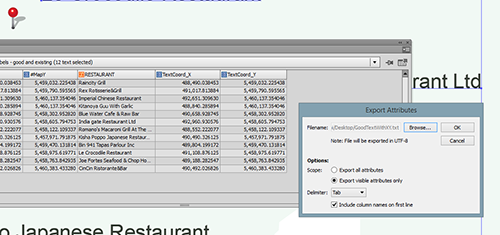
Next, these labels need to be turned into point symbols. There is a handy option in MAPublisher Text Utilities that can do that, but it places a point to the lower left of the text and the symbols need to use the center text reference point that was just created. Instead, with all of the O labels selected, open the MAP Attributes panel and export the attribute table to a text file. Make sure to specify the option Export All Attributes because there are two important hidden attributes needed to make this work: #MapX and #MapY, which are the coordinates of the text reference point.

Export attributes to a .txt file
(Click for larger version)
Export attributes to a .txt file

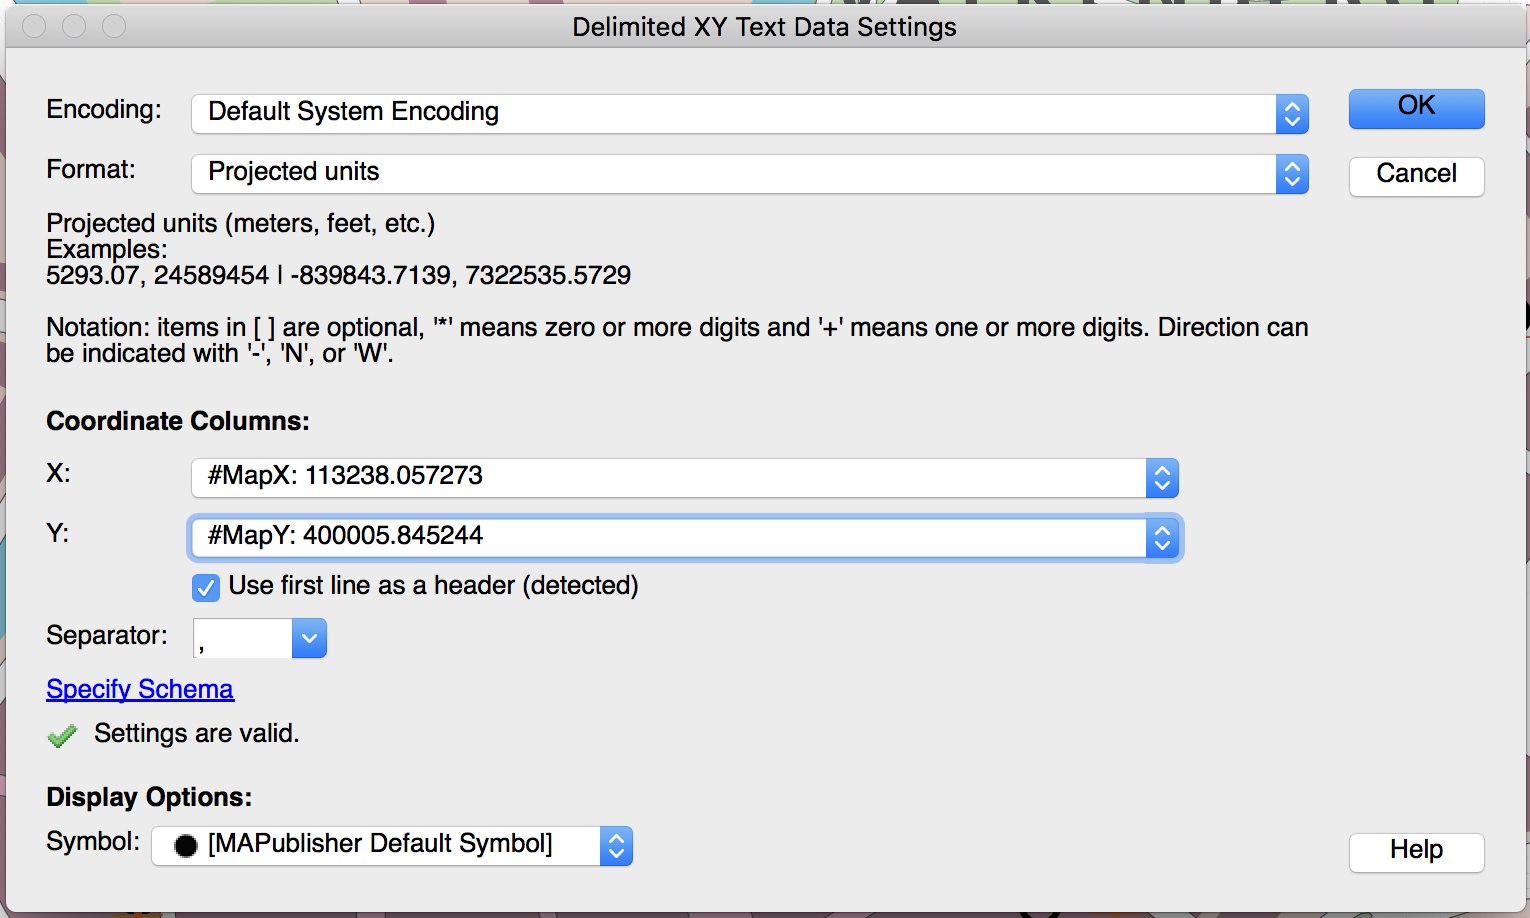
Using MAPublisher Import, add the attributes text file that was just created to the map and make sure to appropriately specify #MapX and #MapY in the X and Y coordinate columns.

Import .txt file as Delimited XY

Since there is no projection information stored in the text file, you’ll need to specify that the coordinates are in the same system as the MAP View it’s coming from and you’ll need to add it to that MAP View upon import.

On the map, there is now a new point layer and because they still have all of their original attributes, the layer can simply be added to the MAP Theme to have all the point symbols reapplied to them instantly. Let’s admire the results:

Symbols reapplied with MAP Themes

If needed, repeat the last few steps for the suppressed labels as well (to a different file and different layer of course) to see what still needs to be done manually.

How to Create and Style Highway Shields with MAPublisher LabelPro

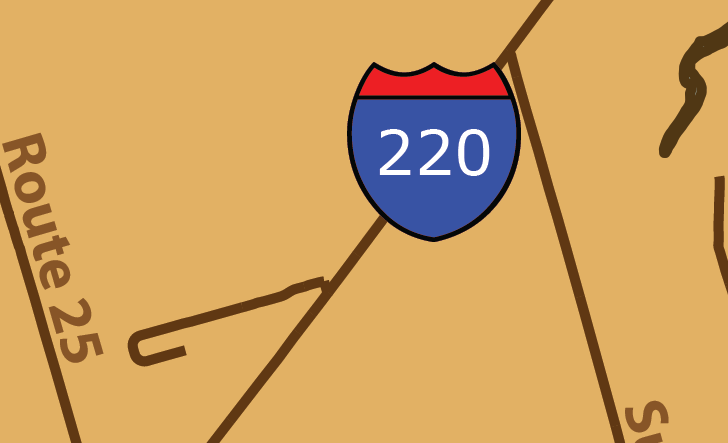
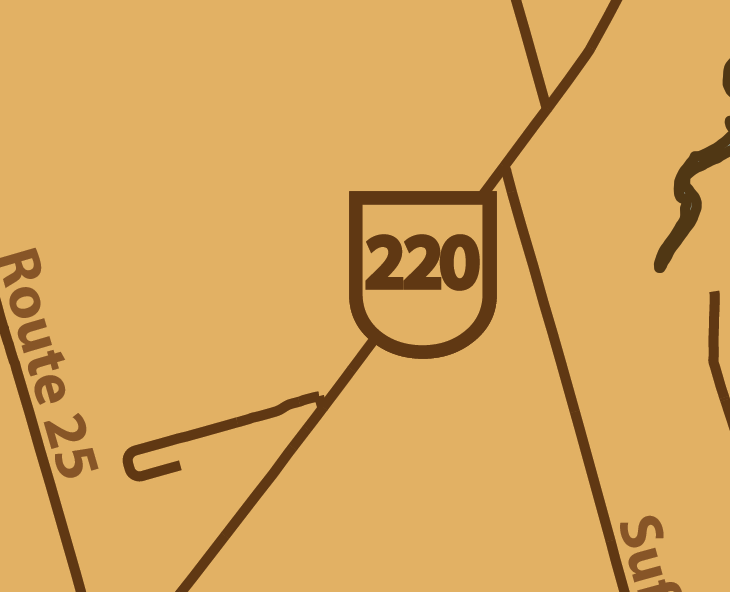
MAPublisher LabelPro intelligently labels your map layers using custom rules and styles. One of the popular uses of this feature is to create highway shields. The result is a cleaner map and is widely used on road maps around the world. While MAPublisher has many default options for highway shields, it is possible to create custom shields to improve your map as well. This blog will outline the steps to create and customize highway shields for your map.

Step One

Import your data into MAPublisher, ensuring your road line data has an attribute field for highway route numbers. Highway shields can work with any data type, however, traditional highway shields are created with a highway number with no additional characters. Using the integer data type enforces this and is recommended for highway shields.


Step Two

On the MAPublisher toolbar, in the Labels subsection, click the MAP LabelPro button.


Step Three

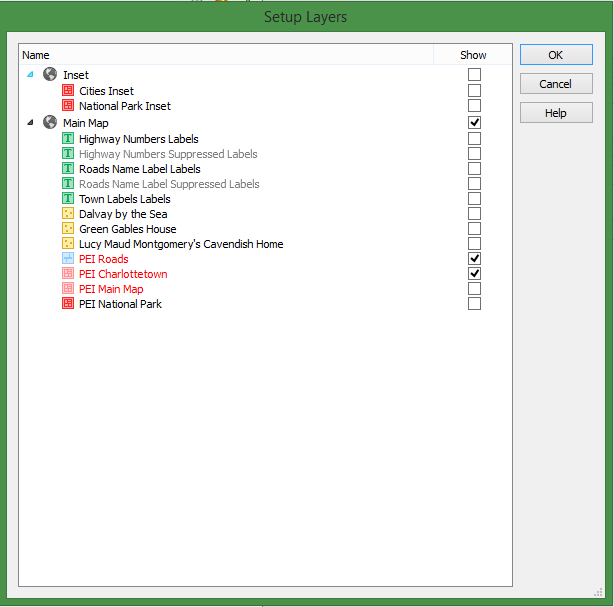
On the MAP LabelPro dialog box, click the Setup Layers button. This allows you to select which layers are going to be labeled or used as obstacles. This means you can label multiple features at the same time as the highway shields. Click the checkbox next to your roads layer and click OK.


Step Four

Optionally, you may want to only create highway shields on some of the roads within your road layer. For example, if your roads layer also contains roads that are not highways, you don’t want them labelled with a highway shield. The solution is to create a Label Filter. To do this, first create a new filter by clicking Add label filter button at the bottom of the dialog box. Next, in the Label Filter section, select Limit by expression and click the Edit icon. This opens the Expression Builder dialog box. In this example, the expression entered selects only roads that have a jurisdiction designated as “Federal” or “Province”. Only these roads will be labelled with a highway shield.


Step Five

If you didn’t create a label filter, click the layer in the Source list you would like to label. On the right side, ensure that the “Is labeled” checkbox is checked. Immediately below, in the Label Source drop-down, select the field that contains the highway route numbers.


Step Six

Select or create a rule from the Rules drop-down. The pre-defined Highways and Interstate rules that are included with MAPublisher follow conventional mapping patterns, but if you want to customize the setup of your shields, click the Edit button. Once you are satisfied with your rules, click OK to return to the MAP LabelPro dialog box.


Step Seven

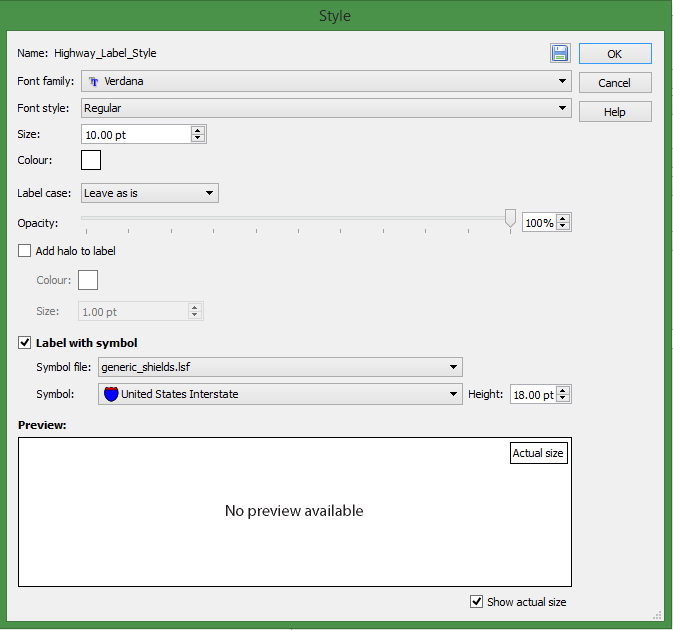
To customize the appearance of the shields, click the Edit button beside the Style drop-down. To add highway shields, click the Label with symbol check box to enable its settings. The Symbol file is the shield library, where you can pick between Canadian, US State and generic shields. The Symbol drop-down is where you can pick the shield from the shield library specified. All shields will have the same symbol, if you want multiple shield shapes on your map, you’ll have to create label filters as outlined previously in step four. The Font family, Font Style, Size, Colour and Label case affect the appearance of the text within the shield. Click OK when finished setting the style.


Step Eight

Back in the MAP LabelPro main dialog box, click the “Output suppressed labels to” check box. This moves all excess labels such as duplicate shields or shields that clash with other features on your map to a Suppressed layer. You can view features on the Suppressed layer after to see which labels were not included and you can decide to keep or delete them.


Step Nine

Click Label to begin the labeling process.


Step Ten

When all of your shields are generated, you can do some additional customization. In the Illustrator Layers panel, select all of your shields. From here, any changes to the colour, stroke colour and other settings you would use on objects, will be applied to your shields. With this functionality, you can create the exact shields you want for your map.

Force Multiple Line Labels By Adjusting Text Attributes In MAPublisher

Single line label vs. multi-line label

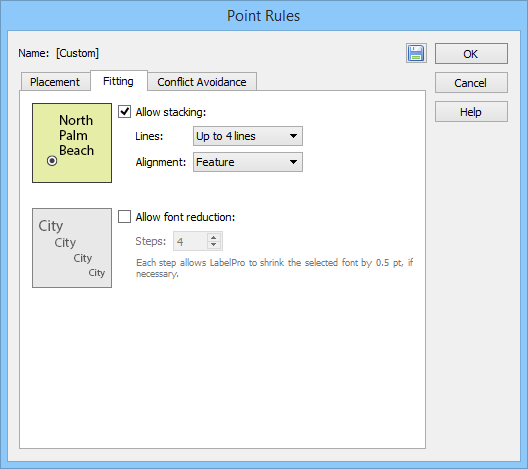
There may be times when you want to have labels be multiple lines. Multi-line labels allow them to fit in tighter positions on the map. Currently, in MAPublisher LabelPro there’s a rule to allow stacking up to 2, 3 or even 4 lines. However, this rule only “allows” stacking and doesn’t “force” stacking. It is only meant to fit labels when there isn’t enough space for a single line.

MAP LabelPro allow stacking rule

Fortunately, there is a trick to manually force text to label as multi-line: you need to manipulate the text attribute. Always make sure to create a backup or duplicate of your layer before trying this on your own data.

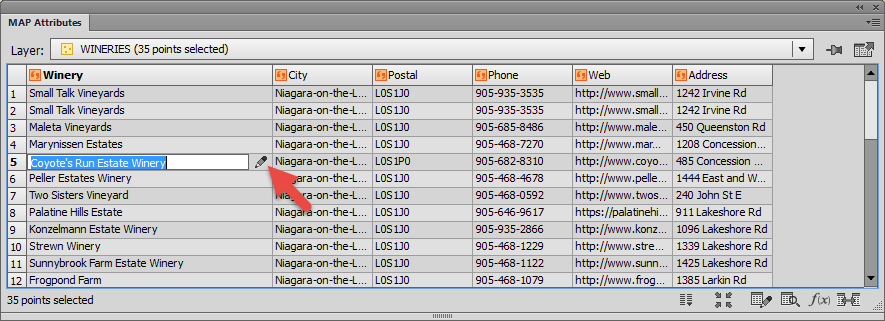
1. Go to your attribute table. Double-click to edit the text and click the Edit icon.

Edit feature attribute in MAP Attribute table

2. Edit the text so it is on separate lines.

Edit the text so it is on separate lines

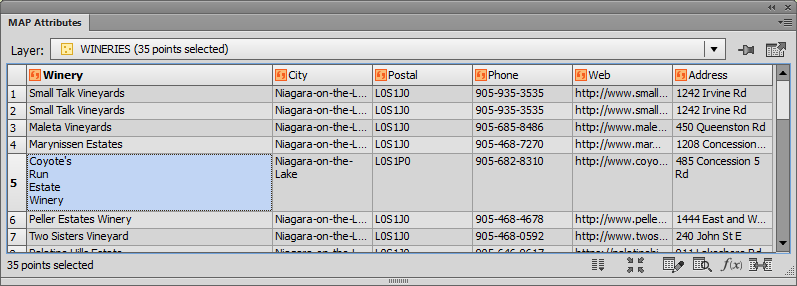
In the attribute table, you will only see the first word of the multi-line text. But all the text is still there and you can see it by adjusting the row height.

Adjust the row height to see all the text

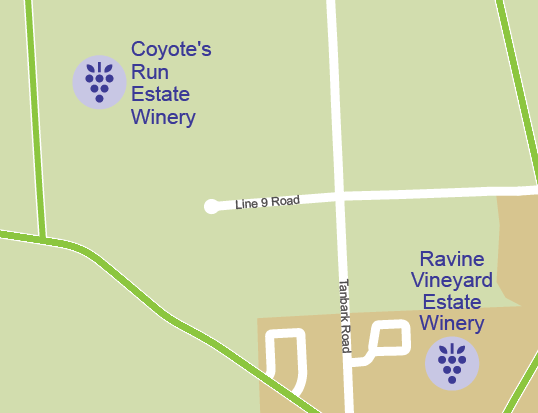
3. Run MAPublisher LabelPro, Label Features, or the MAP Label Tagger tool. MAPublisher will label the feature using the multi-line text specified in your attributes.

Labeling result

If you have the Allow Stacking rule enabled in MAPublisher LabelPro, it won’t affect multi-line text since it’s already setup that way. Generally, it’s good practice to leave the allow stacking rule enabled in case other labels require tighter fitting. Remember to create a MAP Text layer to contain labels that could not be placed. This can provide hints as to what LabelPro rule adjustments you need to make.

Placing Text with an Offset Value Using MAP LabelPro

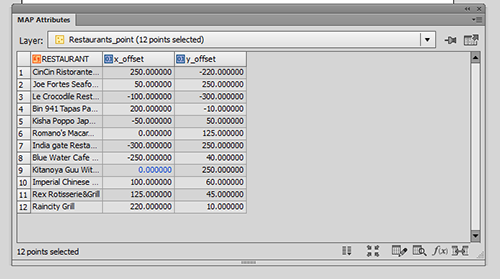
Having introduced some background information about text insertion point coordinate values in a previous post, it would be good to explore if this method works when trying to place text objects (annotations/labels) with a specific offset value. For example, if you have a point layer and there is an attribute for the offset value so that every object has a different offset value.

An Attribute table with the offset value for every object

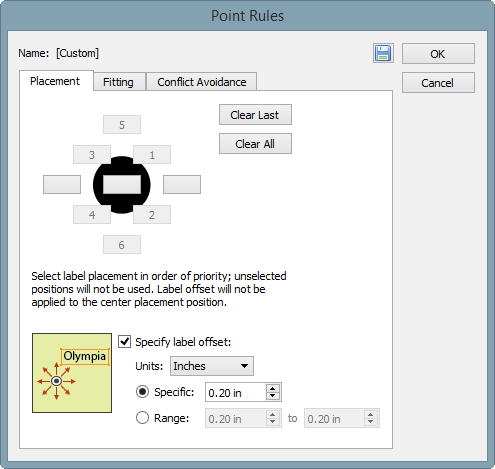
Placing text objects with a specific offset is possible in MAP LabelPro. You can specify the Label Offset value in the MAP LabelPro dialog box. However, this setting will be applied to all text labels. In the example below (see screenshot), all the text will be placed 0.2 inches away from the object. However, that does not help when every point has different offset value like this example. Also, MAP LabelPro uses page units, not the world/map units. In this example, the offset distance was specified in the world/map unit (metres).

The offset option in The Point Rules dialog window from MAP LabelPro.

There are two methods you can accomplish to make the text placed with offset value. The first method is the same as the step shown above. You can adjust the text placement position by calculating the “ideal” coordinate for the text insertion point. From a MAP layer (point, line, or area), generate text with a MAPublisher feature (MAP LabelPro or Feature Label).  Then adjust the text position (maybe you will have to calculate a new position by adding/subtracting the offset values from the current point), then apply it to #MapX and #MapY. The second method is to adjust the position of the points first before labeling.

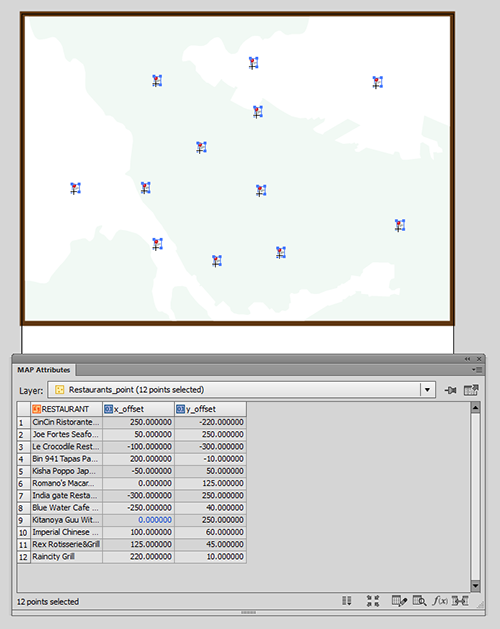
In the example below, a point layer with offset values in the attribute: x_Offset and y_Offset.

An example map with offset attributes (x_offset and y_offset)

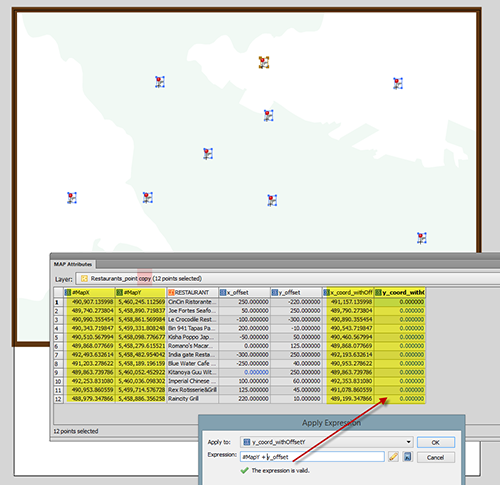
Step 1: Calculate coordinates with offset.

  1. Create a copy of the layer just because the point value will be adjusted.
  2. Make the #MapX and #MapY visible (so that it’s easy to see when calculating).
  3. Create new columns (here we created “x+coord_withOffsetX” and “y+coord_withOffsetY”).
  4. Calculate the new coordinate of the points for X and Y (here we used Apply Expression) as shown below.

Step 1: Calculating the coordinates with offset

Step 2: Move the points to the calculated coordinates with the offset values.

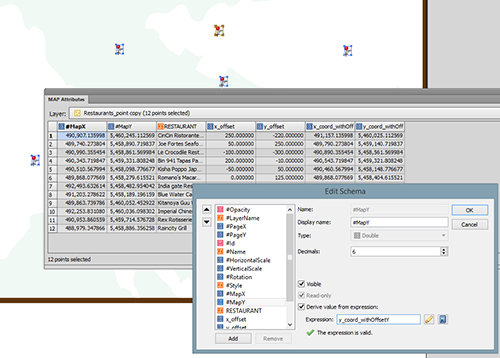
Use the same method as the one introduced in the previous post. This method works for the Point layer as well. Open the Edit Schema window and apply “x_coord_withOffset” and “y_coord_withOffset” to #MapX and #MapY, respectively.

Step2: moving the points to the calculated coordinates with the offset values

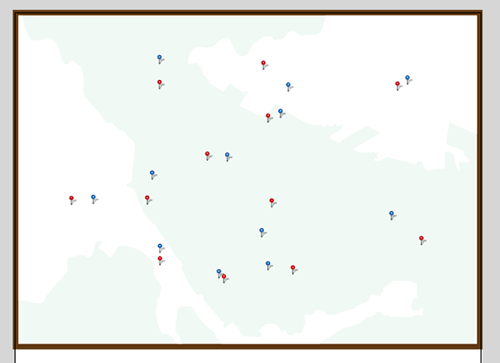
Now, the points are moved to new position. The red point is the original and the blue points are the ones moved to the offset. Now you can label each points. After placing labels for the point layer (blue), you can make the point layer invisible.

The point position is adjusted by #MapX and #MapY

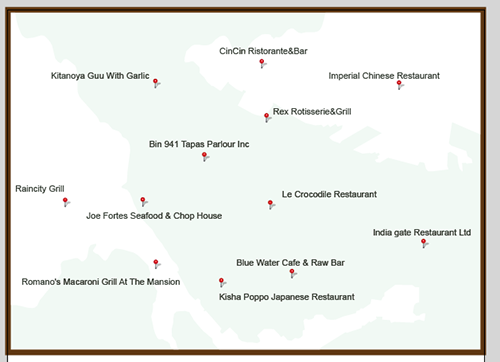
Now you can run the label engine (MAP LabelPro / Label Feature) for the new point layer with offset.

Placing Updated Labels at the Same Position as Existing Labels

After a text placement engine places labels (e.g. annotations or labels) some manual adjustment is usually required. The major reason for this task is to avoid text colliding with other objects and to improve map aesthetics and composition. Here is an example map with the position of labels manually placed and adjusted. What do you usually do when updating your map and you have to update those labels?

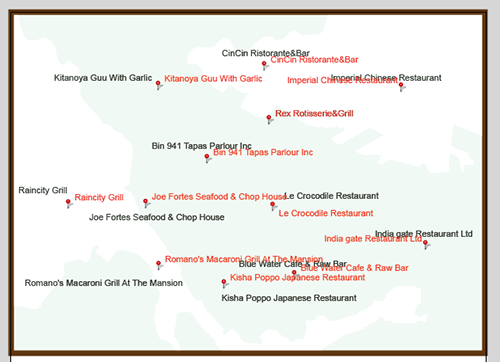
An example with labels. The goal is to place the updated labels at the exact same position.


When running a text placement engine, it is common that the placed labels (in red) do not match with the position of the existing labels (in black). Have you ever thought that it would be useful if the updated labels can be positioned in the same place as existing labels? This is definitely possible using a combination of MAPublisher features.

A result after labels were placed with MAP LabelPro or Label Features.


Workflow involved to perform this task:

  • Obtain the position coordinate of existing text objects
    • Create new attributes to record #MapX and #MapY of each text object insertion point
    • Export the attribute table as a text file
  • Transfer the deteremined coordinte values of the text objects to the MAP layer (point layer in this example)
    • Join Tables using a common attribute between two tables
  • Place labels for the MAP layer
    • MAP LabelPro or Label Features
  • Adjust the position by those determined coordinate values for the text objects
    • Applying the recorded value to #MapX and #MapY


Step 1: Find the coordinates of the text insertion point from a text layer.

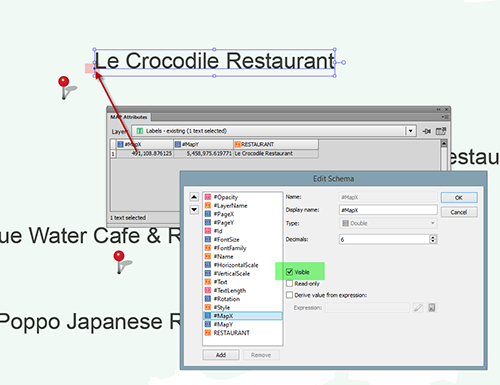
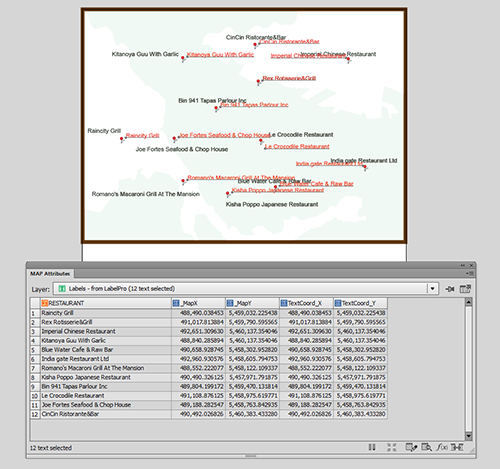
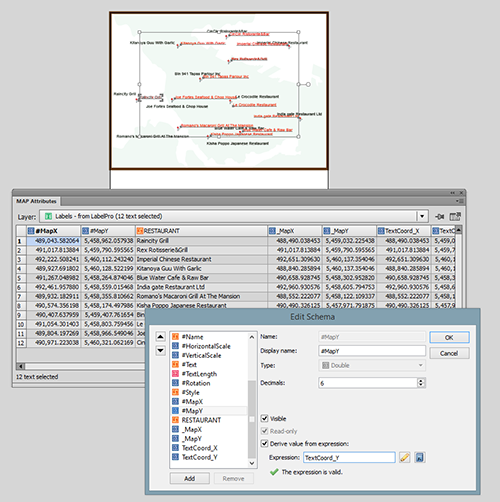
Every map object (point, line, area, image, and text) has a coordinate. MAPublisher calculates an insertion point when map objects are added to the artboard. For labels, a text insertion point can be seen as an anchor point or the square dot that is at the beginning of a text object. In this example, the text insertion point is placed at the lower-left corner of the word “Le Crocodile Restaurant” (highlighted in the red color in the screencapture below). The coordinate of this text insertion point is represented by the #MapX and #MapY attributes in the MAP Attribute panel. These two attributes are considered MAPublisher properties and are usually hidden. To display them, change their setting to “Visible” in the Edit Schema window as shown below.

Step 1: Finding the coordinate of the text insertion point from a "good existing text" layer
Step 1: Finding the coordinate of the text insertion point from a “good existing text” layer


Step 2: Record the coordinates of the text insertion point from a text layer.

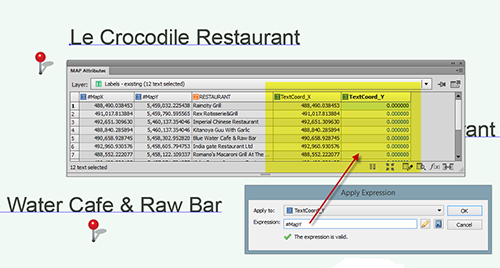
Make the #MapX and #MapY coordinate values as useable attributes. Create new attributes called “TextCoord_X” and “TextCoord_Y”, then copy the values from #MapX and #MapY using Apply Expression.

Step 2: Recording the coordinate of the text insertion point from a "good existing text" layer
Step 2: Recording the coordinate of the text insertion point from a “good existing text” layer


Step 3: Prepare to copy coordinates of existing labels to the point layer.

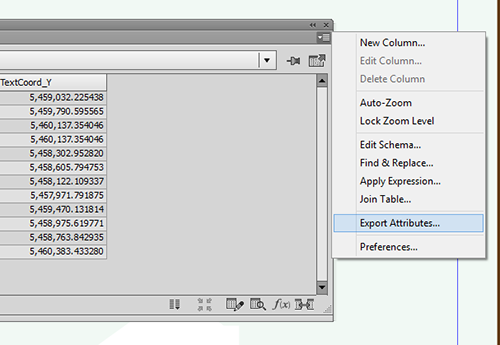
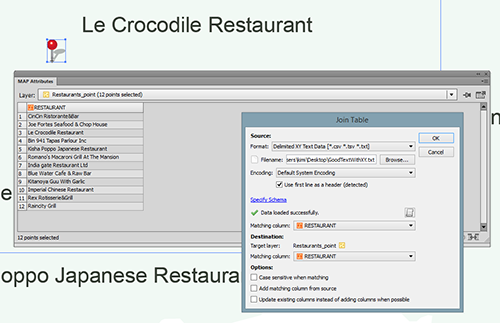
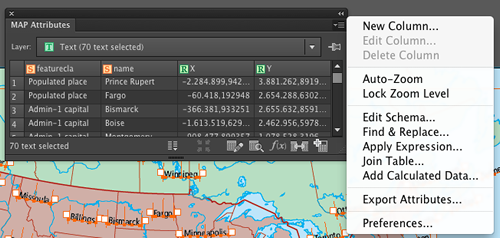
The coordinate values of the text insertion coordinate of a text layer are now copied. The next step is to copy these coordinates from the text layer to the point layer. A simple method to do this is to use Join Tables based on a common attribute. In this example, the string field “RESTAURANT” is the common field in both text and point layers to make a connection. If you already have some other attributes (i.e. object ID or feature ID in both the text layer and the point layer, you should use that). Export the attributes as a text layer from the MAPublisher Attributes panel options menu.

Step 3: Preparing for bringing the coordinates of good, existing labels to the point layer


Step 3: Preparing for bringing the coordinates of good, existing labels to the point layer (2)


Step 4: Join the Point layer to the exported attributes table.

Now, create a table join between the point layer table and the exported attribute table using the Join Table feature.

Step 4: Joining Tables with the exported Text layer and Point layer


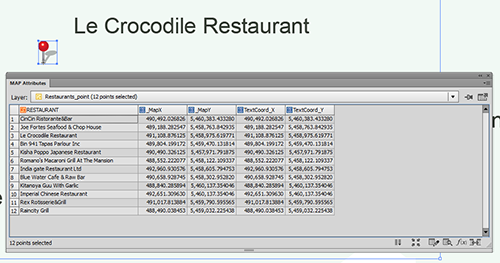
Below is the result from joining the tables together. There are also _MapX and _MapY columns because all visible attributes were exported. While the the step of copying attribute to TextCoord_X and TextCoord_Y was not totally be necessary, having columns named _MapX and _MapY could avoid some confusion because the point layer also has #MapX and #MapY columns. In this case, having attributes clearly indicating the values from the text insertion point is what is most important.

Step 4: Result from Join Tables


Step 5: Place labels with MAPublisher (inherit the attribute values from the point layer to text layer)

Now, place labels with MAPublisher using either Feature Label or MAP LabelPro. The important step here is to inherit the attributes from the point layer to the text layer (the target layer for generating new, updated labels).

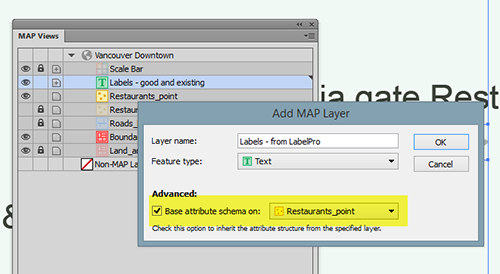
When creating a new Text MAP layer, make sure that the “Base attribute schema on:” option is checked. This will allow the text layer to inherit the attributes from the point layer.

Step 5: creating a new MAP Text layer with the same attribute structure as the MAP Point Layer


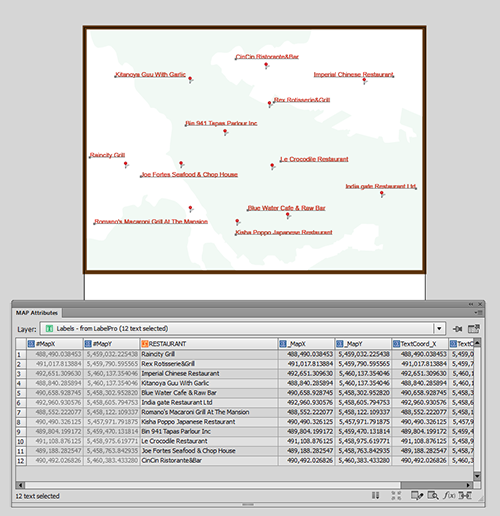
Below is the result of placing labels with MAP LabelPro (red labels). The result (in terms of the attribute structure) should be the same if labels are placed using Feature Labels. The position of new labels are not the same as the existing one. The label position can now be adjusted using the TextCoord_X and TextCoord_Y values.

Step 5: Labels placed with MAPublisher LabelPro or Label Features


Step 6:  Move the text objects by adjusting the #MapX and #MapY.

As illustrated above, the text position is obtained from the text insertion point. The next step is to apply the text insertion point coordinates to the #MapX and #MapY attributes of the point layer using an expression with the Apply Expression feature or use the “Derive value from expression” option in the Edit Schema dialog box.

Apply the TextCoord_X and TextCoord_Y values to #MapX and #MapY, respectively.

Step 6: Now moving the text objects using the #MapX and #MapY


The labels are now positioned in the exact same location as the existing text layer.

Result: the new, updated labels are placed at the same position as the existing labels.
Result: the new, updated labels are placed in the same position as the existing labels.

Labeling Trick for MAPublisher

This blog post was written by Avenza reseller in The Netherlands, Hans van der Maarel of Red Geographics.

When you’re labeling point features (let’s say cities) in MAPublisher, using either Label Pro or Label Features, and you’re not placing a label for every single point, you’re left with the task of removing the points you haven’t labeled. This trick will have the text inherit the attribute structure of the points including a lat/long and guarantee that there are no orphan points.

Take for example the above map. I want to label the cities, but not all of them. I’ll decide as I go along which city will get labeled, and which will get dropped. In order to more easily remove the unlabeled cities I need to do some preparation. I’ll create two columns in the cities layer, X and Y, and assign the expression #MapX and #MapY to them, respectively. It’s important that you do this through the Apply Expression option in the Map Attribute panel.

This gives two attributes with the original coordinates of the city points.

Next, I’ll create a layer for the labels and put it into the MAP View as a text layer, indicating that I want to copy the attribute structure of the cities layer.

Now that all the preparatory work is done, I’ll start the labeling. I’m going to be using the Label Features option, but this will work with MAP LabelPro as well.

If I select one of the texts and look at its attributes, I’ll see that the attributes from the city point have been transferred to the text, including the X and Y attributes which hold the position of the original city point.

Next, I’ll remove the city points layer, select all city labels and use the Export Attributes option in the MAP Attributes panel:

This will export a comma-delimited text file (CSV). Make sure to check the “Field names on first line” option. It’s not exactly necessary, but it will make things a lot easier.

Import the CSV file back into MAPublisher. Make sure to specify that the projection of the data is the same as the existing MAP View. Once the data is imported, you can apply any existing Stylesheets that you had in place to style the cities, or create a new one. This way, you end up with just the symbols for the cities you’ve actually labeled.

New Text Utilities in MAPublisher 8.4

Among other great new features, MAPublisher 8.4 includes new text utilities designed to ease cartographic workflow by adding flexibility to text handling. These tools are accessed through two icons grouped with the MAPublisher document operations tools on the MAPublisher tool bar.

Text Utilities Icons

Text Utilities

Add functions like convert text on a path to point text, separate multiline text, extend overflowing text, flip upside down text, crop text path to text length, set text alignment, rectify point text to angle, and draw shape around text. These text utilities can be applied to selections, to layers, or to all document text at once. The following table provides examples for the result of each tool.

Text Utilities Icons

Right-to-Left Text Tool

Many right-to-left languages, such as Arabic and Hebrew, require additional language-specific processing to get the correct glyph output given the incoming character stream. Let’s look at an example.

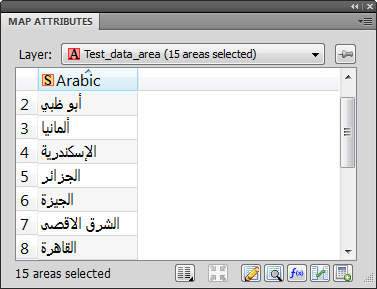
Looking at the MAP Attribute panel, we see that the Arabic script is displayed properly

Text Utilities Icons

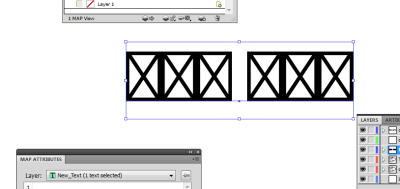
Yet, when using the Label Features tool, we see that the Arabic text is placed as a series of symbols that indicate that the text placement could not be accomplished accurately. This is one of two scenarios we will see, the other being that the Arabic characters will be placed left-to-right.

This happens because Label Features uses the currently selected font, in this case Myriad Pro. Since the Arabic characters were not found in the current Myriad Pro, the displayed symbol is substituted.

Text Utilities Icons

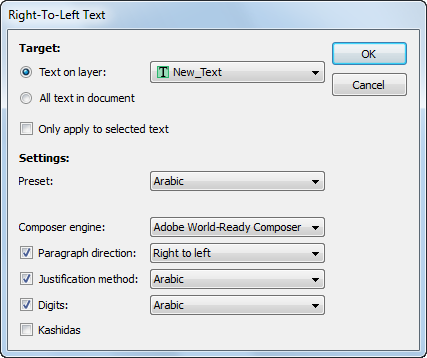
Once we apply the Right-to-Left text tool to these symbols, the Arabic characters will be reordered and altered to display the character appropriate to placement within the word and appropriate to surrounding characters. To apply the Right-to-Left text tool select Arabic from the preset drop-down menu. This populates the remaining settings with the correct parametrs.

Text Utilities Icons

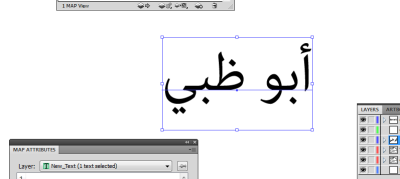
Clicking OK, the script now matches what is found in the MAP Attribute Table.

Text Utilities Icons

If you are using MAP LabelPro, you will also need to use the Right-to-Left text tool after labeling. However, there is a slight difference between Feature Labels and MAP LabelPro behaviour. Instead of displaying the box with “x” symbol, it will place the Arabic characters in reverse order from their proper placement in the MAP Attributes table.

Text Utilities Icons

The text on the left is placed by MAP LabelPro, with the text on the right having been corrected with the Right-to-Left text tool.

We’re excited that these text utilities are being incorporated into MAPublisher. Many users have been requesting more text options. We hope you’ll like them as much as we do. We’re putting the finishing touches on MAPublisher 8.4 and will be releasing it in a few weeks.

Working with Custom Highway Shield Symbols and Label Features

MAPublisher offers a variety of labelling options, ranging from the MAP Tagger tool used for hand labelling single pieces of art, the Label Features tool for automatic attribute labelling, and MAPublisher LabelPro™, a separately licensed advanced labelling engine.

MAPublisher LabelPro ships with nearly 100 highway shields from across North America into which attribute labels can be easily placed. Although LabelPro does not support adding custom symbols to its existing symbols library, the following instructions outline a manual method for adding a custom highway shield to your map, along with placing text on to this shield.

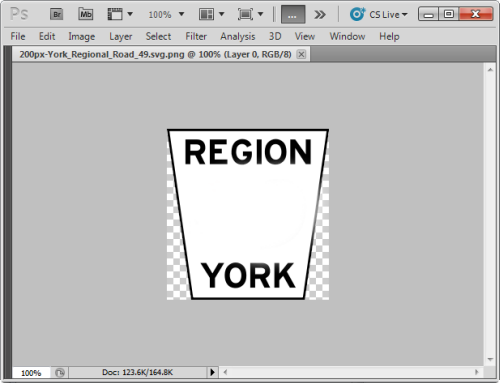
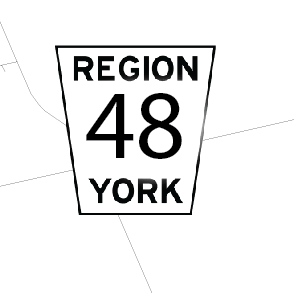
First we must setup our custom shield. This can be drawn in Adobe Illustrator, or produced from a pre-existing image brought into Illustrator using the File > Place menu option. For this exercise I have taken a highway shield I found online from York Region Ontario, and using Adobe Photoshop removed the highway number from the shield.

Working with MAPublisher for Adobe Illustrator

Once the shield is drawn and sized appropriately and placed in Illustrator, simply use the Selection Tool to drag the symbol into the Adobe Illustrator Symbols panel. Be sure to name the symbol, as you will need to access the symbol from a list later on; I named mine “York_Shield”

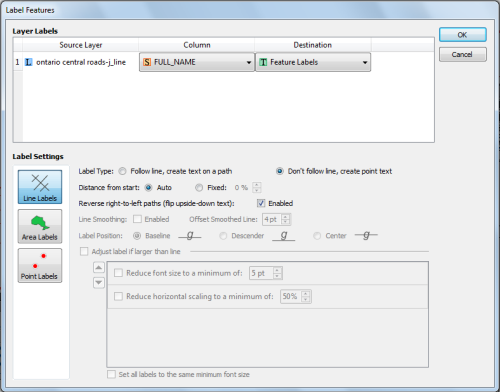
Our next step is to produce our feature labels. Using the Label Features tool, choose to label with the “Don’t follow line, create point text” option selected. Once the labels are placed on the map, use the Adobe Layers panel to select the labels and use the Paragraph panel or the Control Toolbar to centre justify the labels. This step is important for easily lining up our shields with the labels.

Label map features

We now need to create a point layer with a point corresponding to each label. This is easily done by using the MAP Attribute panel option menu to “Export Attributes..” of our newly created Feature Labels MAP Text Layer. Be sure to choose export all attributes under Options: Scope, and to check “Include column names on first line” as we will be using the hidden MAPX and MAPY attribute columns when importing this data back into the map as point data.

Export map attributes

Next, use the MAPublisher Simple Import tool to add the newly created .csv file of referenced attribute information. When prompted by the Settings dialog, choose the MAPX column as the column containng X coordinates, and MAPY for Y coordinates. Once the data is imported, if it has not been added to the MAP View containing your line and text layers, add it, and specify the coordinate system if necessary.

MAPublisher Settings

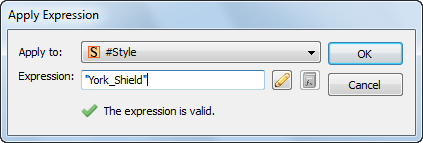
With the imported point data selected, open the MAP Attribute panel and right click a column heading to access the Show/Hide Columns > Show All option. double click the #Style column and change the style to your shield symbol. Use the Apply Expression tool in the option menu to apply the symbol to every item at once.

Apply expressions

Alternately, a MAP Stylesheet can be built to apply the symbol only to art with a specific range of attributes. In the Adobe layers panel move your label layer above your symbol layer.

If text and symbol do not line up as desired, the symbol geometry will need to be altered. If you are using CS5, doubble click the shield in the symbol panel to enter isolation mode, here you can drag the symbol to respecify the anchor point so that your symbol lines up as you would like it. If you are using CS3 or CS4, you will need to add some invisible art (no stroke/no fill) just below or above the symbol to adjust its extents, and where exactly the symbol’s centre point is located. As well, symbol and text rotation can be edited globally by changing the #Rotation attribute in the MAP Attributes panel.

MAPublisher highway shields

News Archive