My Account     Contact Us     Cart

Map-making for the #30DayMapChallenge: Day 4 – Hexagons

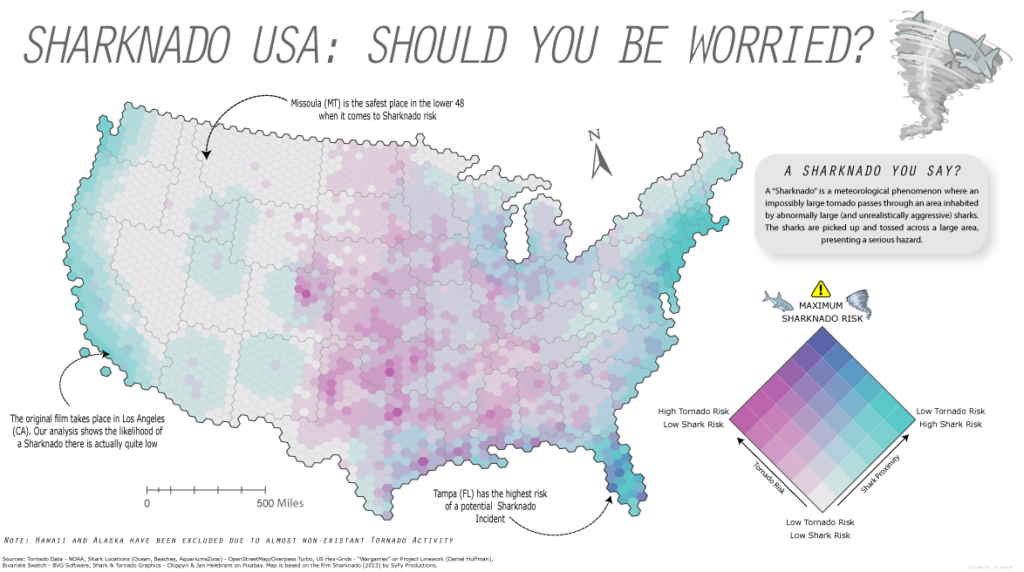
Yesterday was Day 4 of the #30DayMapChallenge, with the goal being to create a map using “Hexagons”. In the spirit of the challenge, we took a not-so-serious approach to create a fun map of “Sharknado Risk” based on the 2013 film “Sharknado” using MAPublisher tools and a really neat hexbin dataset for the United States. This map was in part created for NACIS 2021, and you can see how we created the map by watching the full video presentation included below. This blog also includes a few supplementary notes if you wish to follow along.

What exactly is a Sharknado?

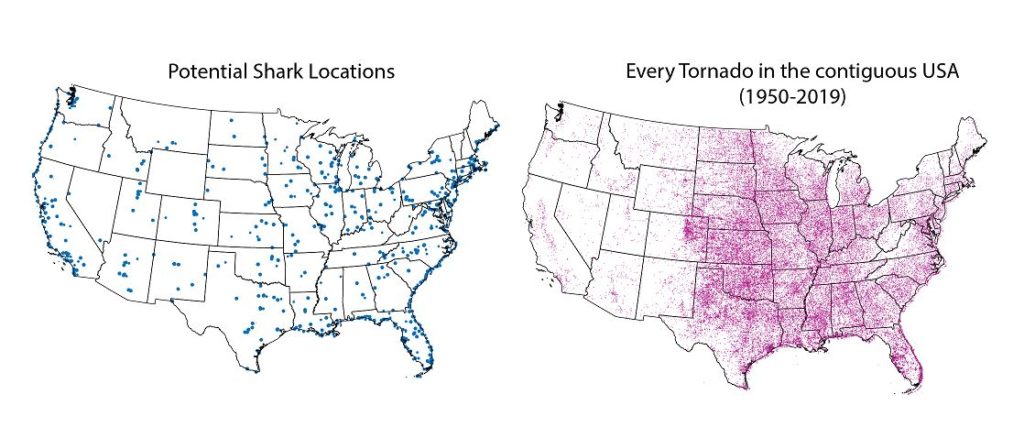
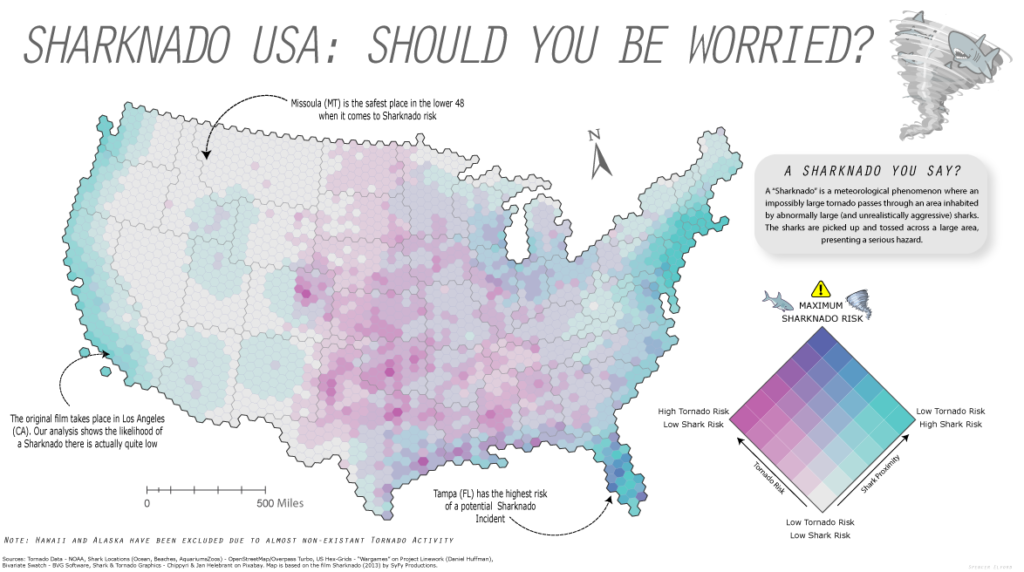
A sharknado is a fictional meteorological phenomenon that occurs when a large tornado scoops up some sharks, transports them some distance, and finally disperses across a populated area. Generally speaking, if a given area is close to potential shark habitats (be it an aquarium, a zoo, or even the ocean) and has a high frequency of tornadoes, the area is more “at-risk” of experiencing a sharknado. To that end, we gathered some great open datasets to help us map this risk. We collected a shapefile documenting point locations for every single tornado in the country dating back to 1950. With this dataset, we can determine the relative frequency of tornadoes for a given area. From OpenStreetMap, we estimated potential locations for sharks by collecting point coordinates for every aquarium, marine park, aquatic zoo, and ocean-facing beach. We used Overpass Turbo to query and extract these points to a spatial dataset and imported them into Illustrator using MAPublisher. Check out this great tutorial (produced by Steve Spindler!) that covers techniques for importing Overpass Turbo data into MAPublisher. The tutorial was part of our ongoing Mapping Class series, a video-focused series that provides helpful tips, techniques, and workflows from real-world cartographers.
Aggregate data with Spatial Join

Since the challenge of the day is hexagons, we needed a way to get our messy point data into our clean “hexbin” format. The Spatial Join tool allows us to aggregate our point data (Tornado and Shark Locations) into a single hex-grid polygon dataset.
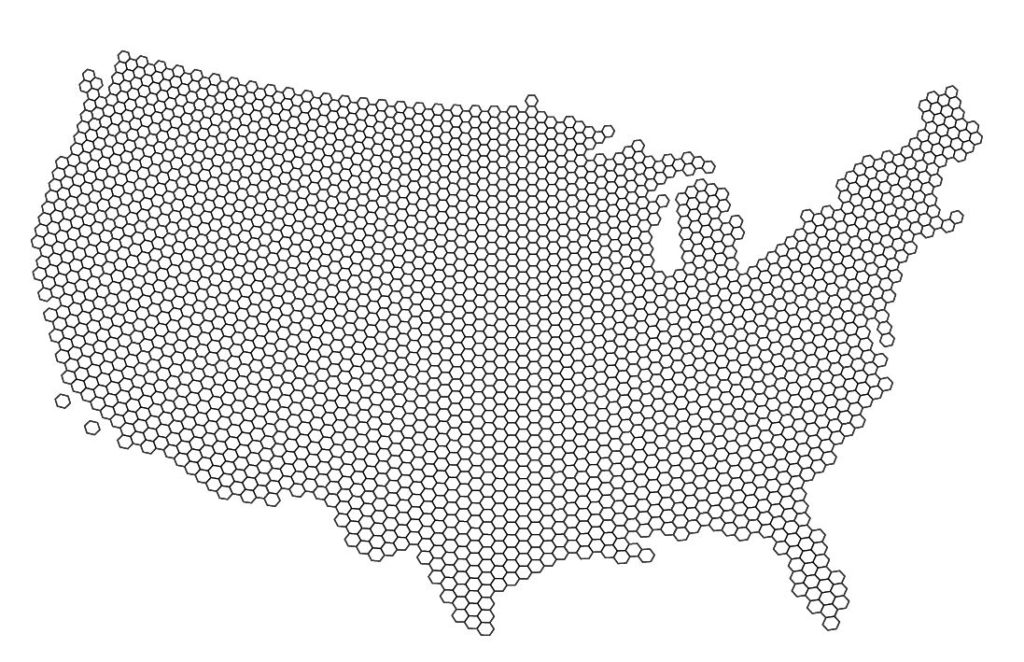
Credits to Daniel Huffman’s projectlinework.org for making this dataset available!

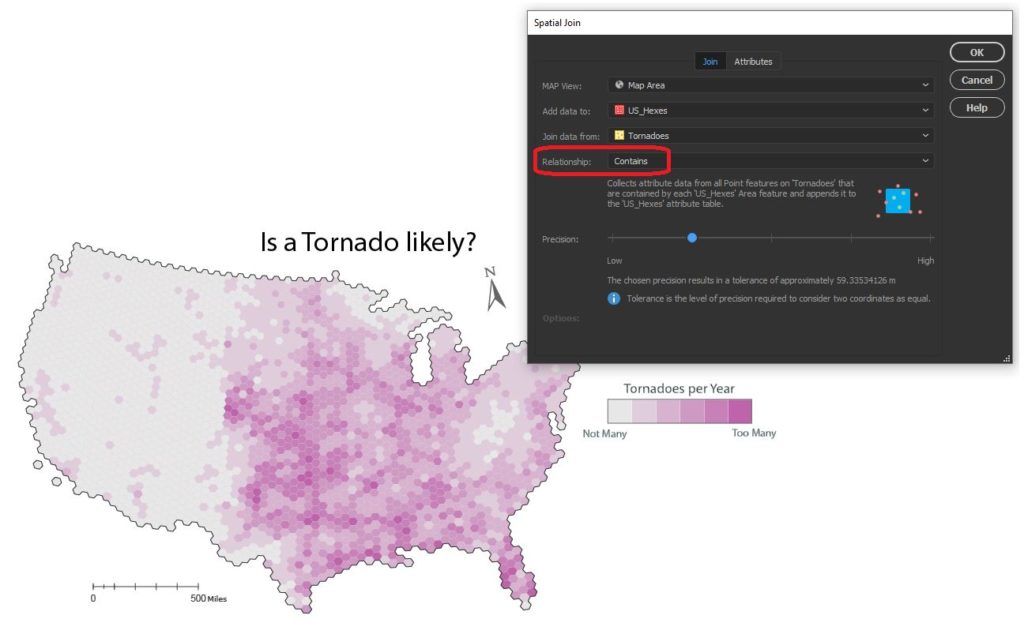
The Spatial Join tool includes several different options for “spatial relationships” that will determine how our point data is joined to the new hex-grid. We can also specify how the tool will aggregate the attribute information for our joined data. In this case, we join our Tornado point data based on a “contains”  spatial relationship. This will aggregate all tornado points that are “contained” within a given hexbin. We also specify that the tool should aggregate the attribute information for all “contained” tornados by tallying up the number of tornado points within each hex. Since we know the dataset spans a 69-yr period, we can easily calculate the average annual tornado frequency for each hexagon.
We apply a similar technique to our shark location data, this time specifying a “near” spatial relationship. We used some back-of-the-envelope math to estimate that a Sharknado (as it appears in the film) lasts substantially longer and travels farther than a normal tornado, meaning sharks as far away as 150 miles still present a potential risk. We can specify a search range of 150 miles and this will be applied to our spatial relationship as a cut-off distance. 
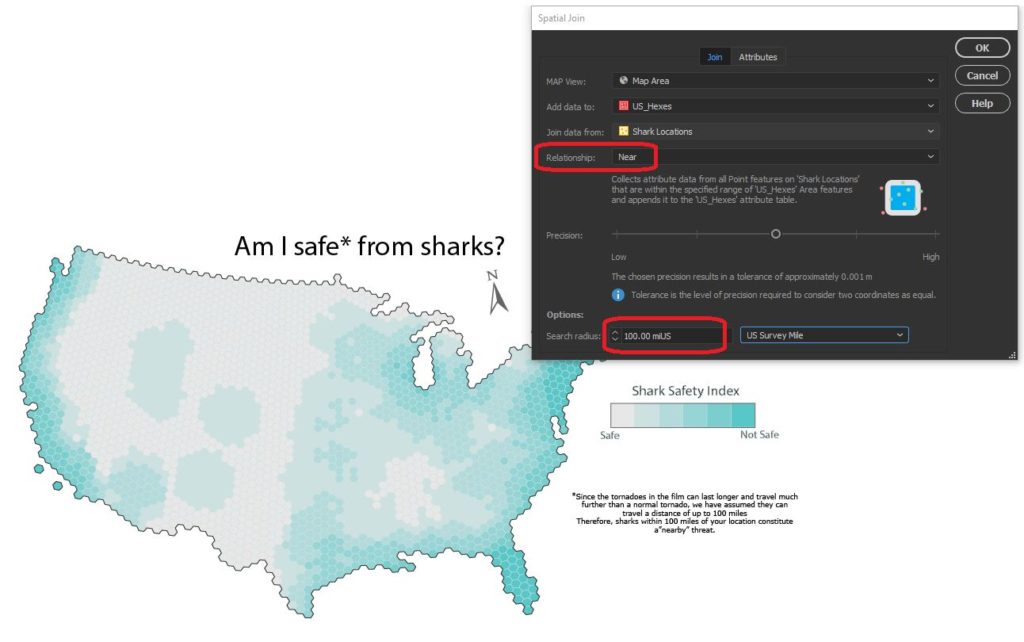
 

Edit attributes with expressions

We assumed that Sharknado risk is highest when a given area is prone to tornadoes and also has a high concentration of potential shark locations. Given this, we came up with a basic equally-weighted, bi-variate risk index to assign a “Sharknado Risk” score based on these two variables. To calculate this score for each hexagon in our hexbin grid, we applied some custom expressions using MAP Attributes. First, we assigned a Tornado risk score from 1 to 6 based on the low to high frequency of tornadoes. We assigned a similar score for “Shark proximity” based on the concentration of potential shark locations. Finally, we combined these values into 36 unique scores to evaluate sharknado risk.
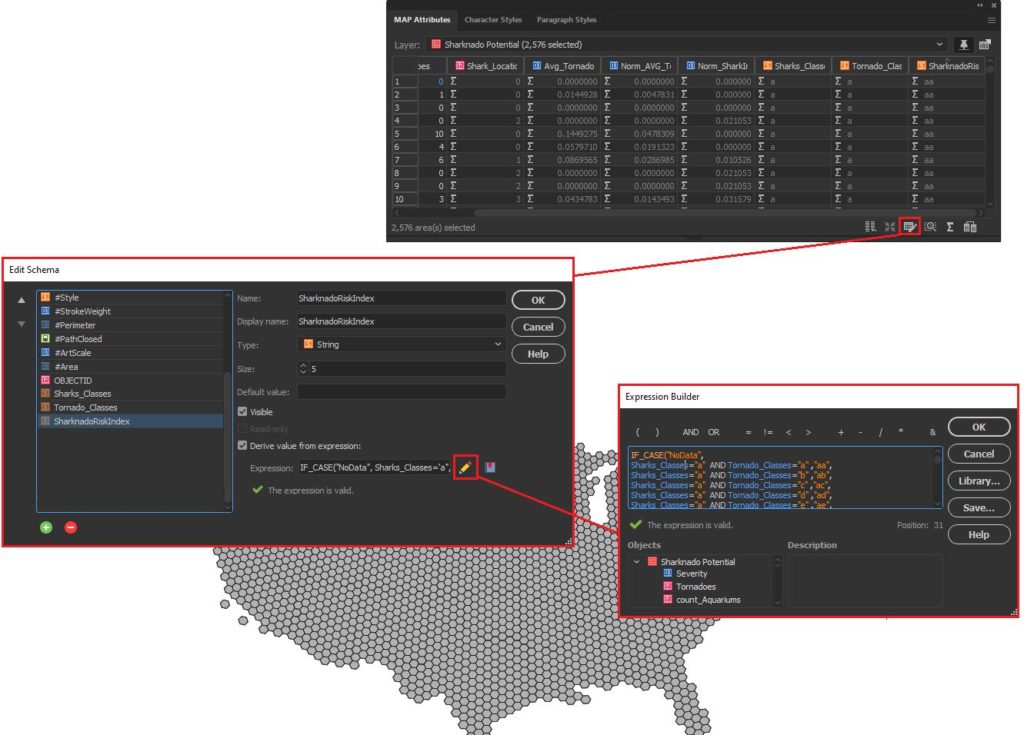
Stylize maps easily with MAP Themes

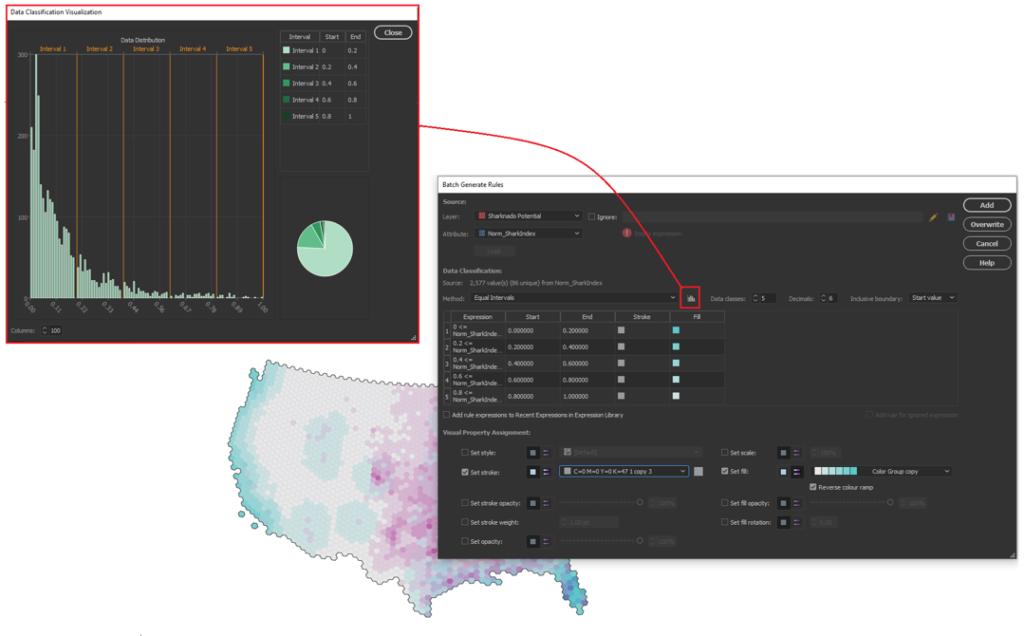
The final step is to stylize our map and create a layout. With MAP Themes, we can create rules-based stylesheets to easily stylize our map data in no time. MAPublisher comes with a great selection of built-in MAP Swatches, including several color brewer-based swatches that work great for choropleth-style maps like this. We used these swatches to create a custom, bi-variate swatch group to visualize each score of our “Sharknado Risk Index”. The MAP Themes tool also provided a neat data distribution viewer, which also allows us to inspect a histogram of our dataset. Although we used discrete categories for each of our risk scores, the data distribution viewer is very useful when working with continuous datasets since it allows you to see how your bin-widths will affect the display of colour on your choropleth.
The final touches

With stylization complete, Day 4 of the #30DayMapChallenge is almost in the bag. We can create a north arrow, and a scale bar and create a custom legend to facilitate easy interpretation. Since we are still within an Illustrator environment, we can use all the powerful native illustrator tools to add graphical design elements, text, and artwork to create a fun, infographic-style map. Although we were happy to call the map finished at this point, the great thing about making maps is there is also room to add more. For example, we might try using LabelPro to create custom labels that mark high and low-risk areas, or we could create insets to highlight specific regions of interest. The possibilities are endless!

We had a great time putting together this fun map for the #30DayMapChallenge, and we are excited to see what we can do for the remaining themes on the calendar! For those of you who are also making maps for the challenge, a reminder that the Avenza Map Competition is still accepting submissions. Share your map, compete with other map-makers in the community, and win some great prizes!

See a PDF version of the map here.
Mapping Class: Efficient Labeling using attribute expression builder with Steve Spindler

Welcome back to this month’s edition of Mapping Class. The Mapping Class tutorial series curates video tutorials and workflows created by experienced cartographers and Avenza software users. Joining us once again is Steve Spindler, a longtime MAPublisher user, and expert cartographer. Steve is here to show you a quick tip for using the attribute expression builder within MAPublisher to quickly perform batch edits of labels. 

Steve has produced a short video to demonstrate how he uses the expression builder to quickly edit street names. The Avenza team has produced video notes (below) to help you follow along.

***

Label efficiently using Attribute Expression Builder
by Steve Spindler (video notes by the Avenza team)

With MAPublisher, labeling your maps is a breeze. With powerful tools such as LabelPro, labeling is only a matter of selecting the data you want to label, and configuring a robust set of rules that control how each label is placed and styled. But before you can start labeling, you must have high-quality, accurate attribute information for your map data. Since labels are typically generated by displaying text values contained in an attribute column, it is important that attributes are not only accurate but are also formatted in a way that is optimized for display on a map. In many cases, cartographers need to spend time reformatting or editing attribute information before they can generate labels, a process that can become quite time-consuming. Nowhere else is this problem more common than when dealing with street names and road network data.

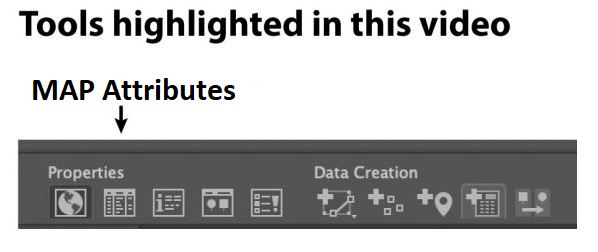
This image has an empty alt attribute; its file name is Tools.jpg

When labeling streets, cartographers often spend time correcting, or even generating brand new attribute information that can be used to create more concise, effective street labels. This typically involves changing street prefixes and suffixes to a condensed short form (i.e “North Cherry Boulevard” becomes “N Cherry Blvd”). For smaller projects, this can be done by manually editing the individual attribute values directly within the MAP Attribute panel. For large projects, especially those dealing with hundreds or even thousands of map features, manual editing would be very time-consuming.

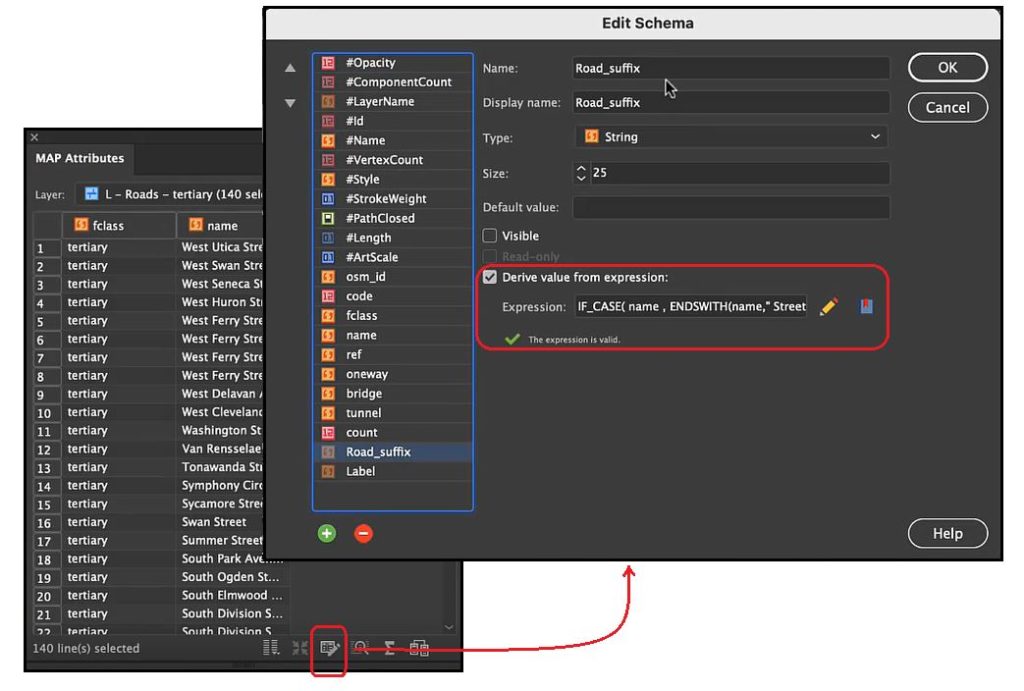
For a more efficient approach, Steve shows how you can use the Expression Builder to easily modify large selections of attribute values. The first step is to open the MAP attribute table, which displays all the attribute information contained within a specific map layer. Steve identifies the attribute column that contains the text street names and will use this to build out a new attribute column to create his labels.

This image has an empty alt attribute; its file name is Buiiklder-1024x691.jpg

Next, Steve opens the Edit Schema window of the attribute table. Here, you can access column information such as the data type, default value, field visibility, and most importantly; the expression builder.

The expression builder may seem intimidating at first, but with a little bit of effort, it can be an incredibly powerful tool for calculating attribute values and performing batch-edits on your data. The tool uses built-in operators and items in the objects list (attribute names and values, constants, functions) to calculate custom attribute information based on a specified set of expressions. In this case, Steve first creates an expression set that modifies the suffix values in the Street name field (i.e “Boulevard”) and substitutes them with the appropriate short form (“Blvd”). The expression is used to populate a new attribute column called “Road_suffix”. The end result means attribute values such as “East Utica Street” will be passed to a new attribute value of “East Utica St”.

This image has an empty alt attribute; its file name is inputs.jpg
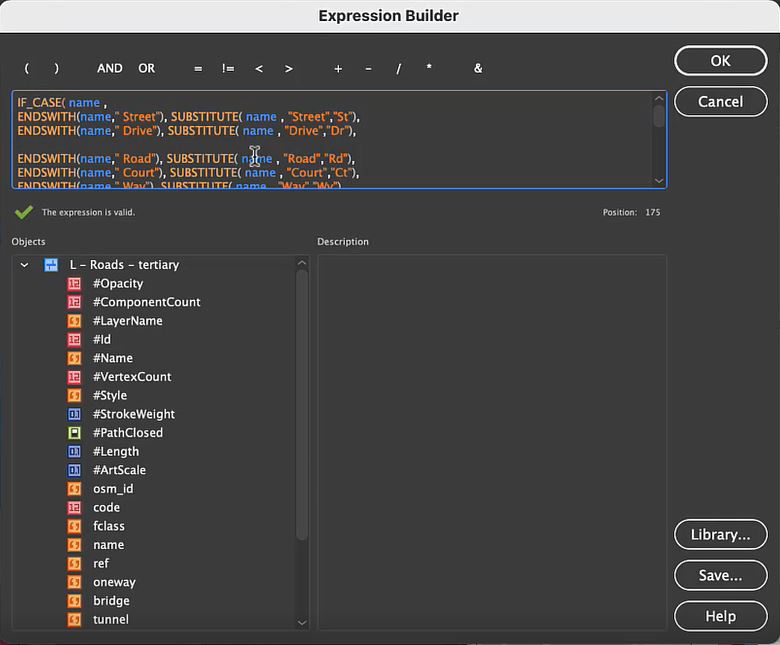
IF_CASE(name,
ENDSWITH(name, “ Street“),SUBSTITUTE( name , “Street”, “St”),
ENDSWITH(name, “ Drive“),SUBSTITUTE( name , “Drive”, “Dr”),
ENDSWITH(name, “ Road“),SUBSTITUTE( name , “Road”, “Rd”),
ENDSWITH(name, “ Court“),SUBSTITUTE( name , “Court”, “Ct”),
ENDSWITH(name, “ Way“),SUBSTITUTE( name , “Way”, “Wy”),
ENDSWITH(name, “ Lane“),SUBSTITUTE( name , “Lane”, “La”),
ENDSWITH(name, “ Route“),SUBSTITUTE( name , “Route”, “Rt”),
ENDSWITH(name, “ Boulevard“),SUBSTITUTE( name , “Boulevard”, “Blvd”),
ENDSWITH(name, “ Turnpike“),SUBSTITUTE( name , “Turnpike”, “Tpke”),
ENDSWITH(name, “ Avenue“),SUBSTITUTE( name , “Avenue”, “Ave”),
ENDSWITH(name, “ Place“),SUBSTITUTE( name , “Place”, “Pl”),
ENDSWITH(name, “ Circle“),SUBSTITUTE( name , “Court”, “Cr”),
ENDSWITH(name, “ Highway“),SUBSTITUTE( name , “Highway”, “Hwy”),
ENDSWITH(name, “ Expressway“),SUBSTITUTE( name , “Expressway”, “Exp”)
)


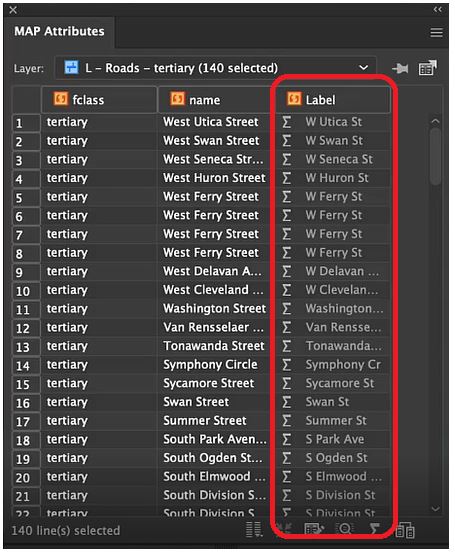
Next, Steve creates a second set of expressions that will further adjust his Road_suffix attribute column to substitute any street name prefixes (North, East, South, West) with their corresponding short-form (N, E, S, W). This second expression (see code block below) is used to populate another new attribute column called “Label”, which will ultimately be used to generate the final formatted label layer. 

((IF_CASE( Road_suffix ,
STARTSWITH(Road_suffix, “West “), SUBSTITUTE( Road_suffix, “West “, “W “),
STARTSWITH(Road_suffix, “South “), SUBSTITUTE( Road_suffix, South “, “S “),
STARTSWITH(Road_suffix, “North “), SUBSTITUTE( Road_suffix, “North “, “N “),
STARTSWITH(Road_suffix, “East “), SUBSTITUTE( Road_suffix, “East “, “E “)
))

This image has an empty alt attribute; its file name is ExpressionAttributes.jpg

Note that these expressions are specific to the dataset and map area Steve is using for his project. When using expression builders for your own maps, pay careful attention to the attribute values specific to your area of interest. The best part about expression sets is that they are highly flexible, meaning you can build upon and modify existing expressions, save them to your library, and even use them across multiple different mapping projects!

With his newly created “Label” attribute column, it’s simply a matter of configuring the LabelPro tool to display these formatted label values. With a bit of configuration, the end result is a clean, uncluttered, collision-free label layer. The labels now use all the correct prefixes and suffixes Steve required. By saving his expression sets to his library folder, Steve can now quickly and easily repeat the exact same batch-editing process for new maps with only a few clicks! 

This image has an empty alt attribute; its file name is ExpressionBuilder-1024x249.jpg

***

About the Author

Steve Spindler has been designing compelling cartographic pieces for over 20 years. His company, Steve Spindler Cartography, has developed map products for governments, city planning organizations, and non-profits from across the country. He also manages wikimapping.com, a public engagement tool that allows city planners to connect and receive input from their community using maps. To learn more about Steve Spindler’s spectacular cartography work, visit his personal website. To view Steve’s other mapping demonstrations, visit cartographyclass.com

Using MAP Themes to Automatically Style CanVec+ Data on Import in MAPublisher

Creating multiple maps that share cartographic styling is a common requirement for MAPublisher users. The most effective way to accomplish this is the use of MAP Themes. MAP Themes are a collection of thematic cartography tools designed to increase productivity by automating how styles and symbols are applied. Creating a number of MAP Themes based on regularly used layers with standard attribute schemas can greatly reduce the amount of time spent styling maps.

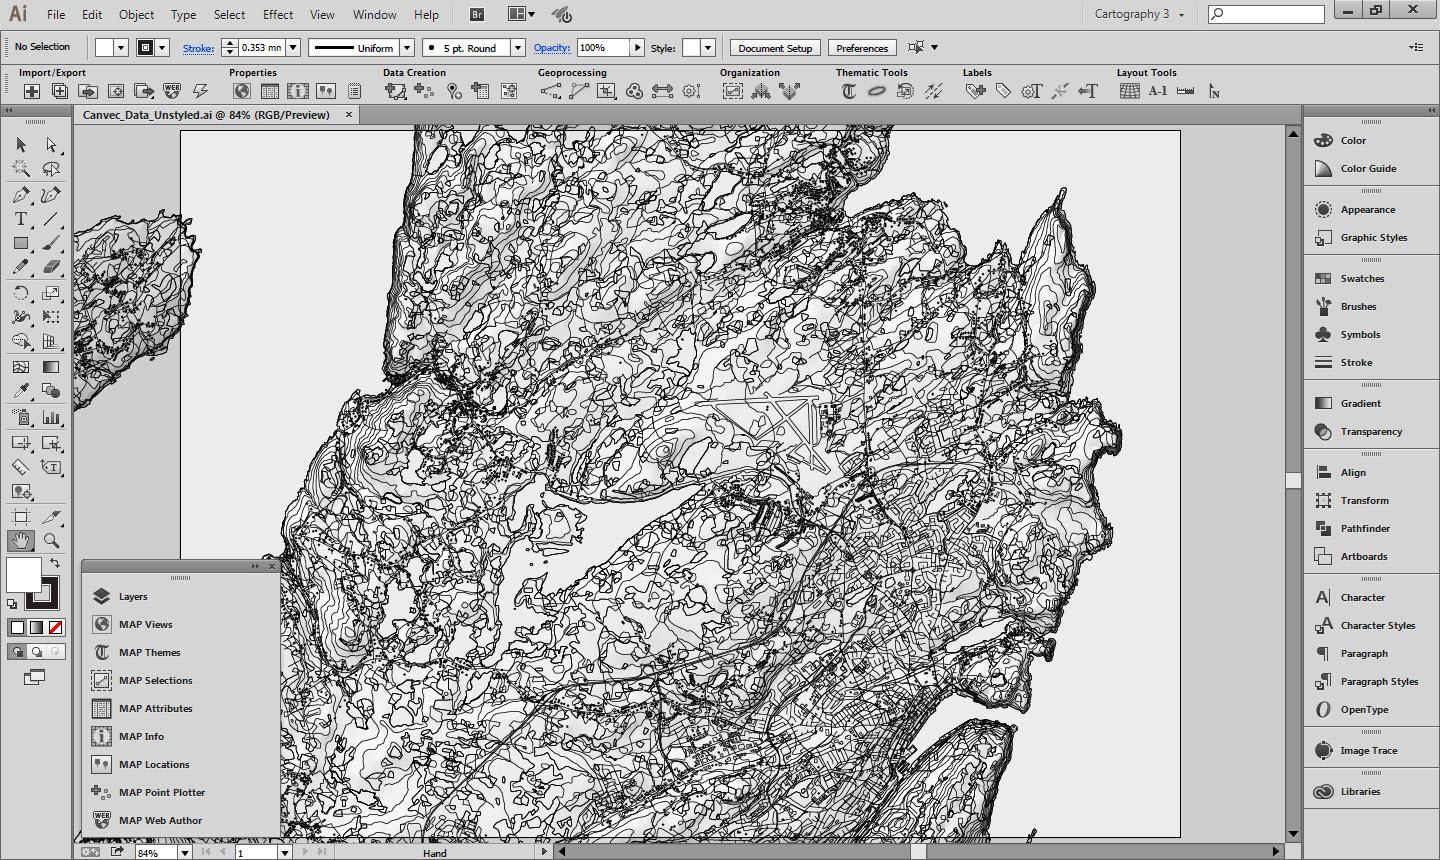
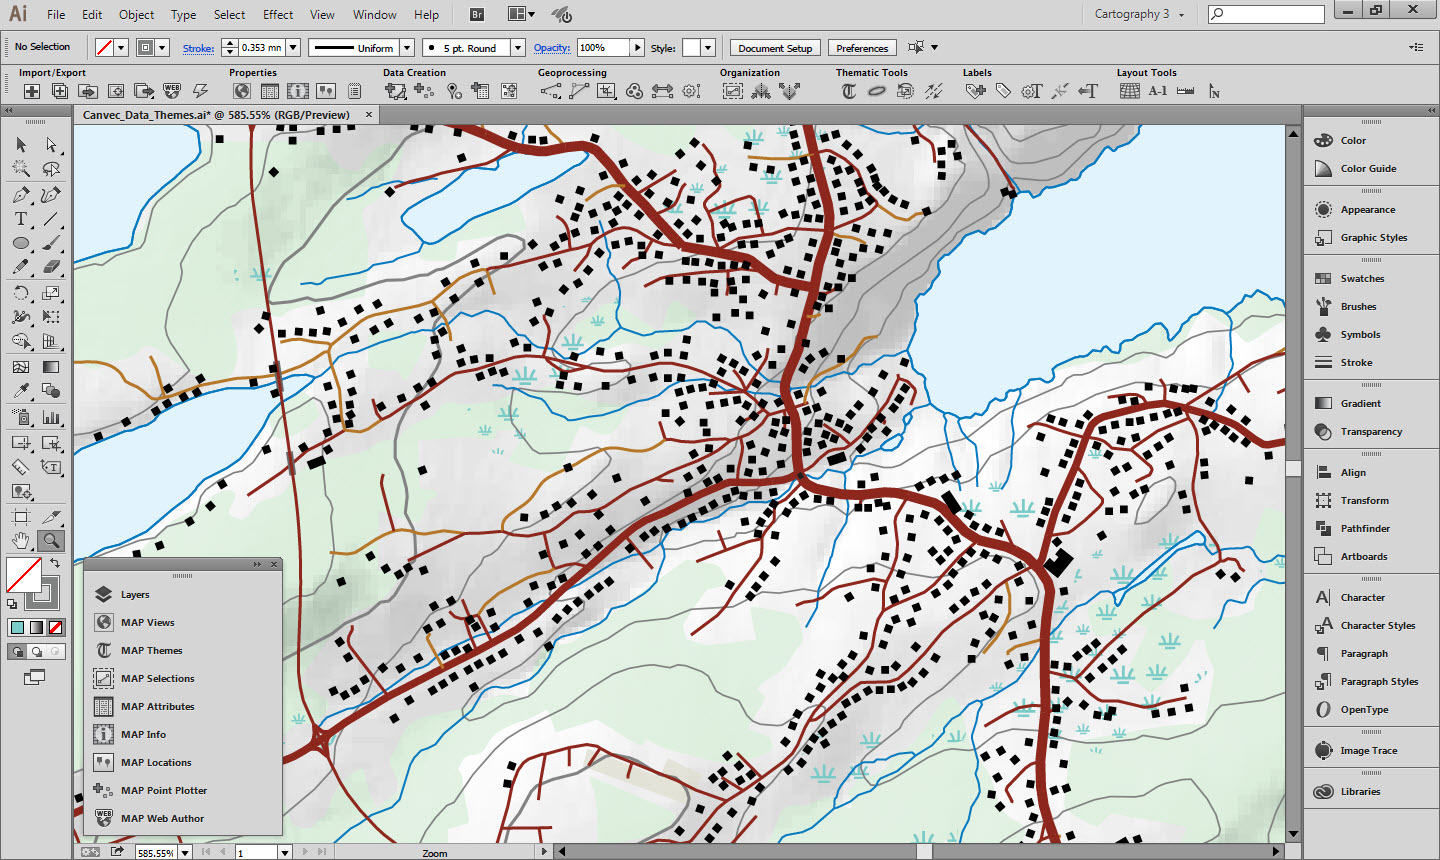
This guide will walk through creating and setting up MAP Themes to automatically apply to the appropriate layers upon import. If done correctly, rather than seeing this:


Unstyled CanVec+ layers


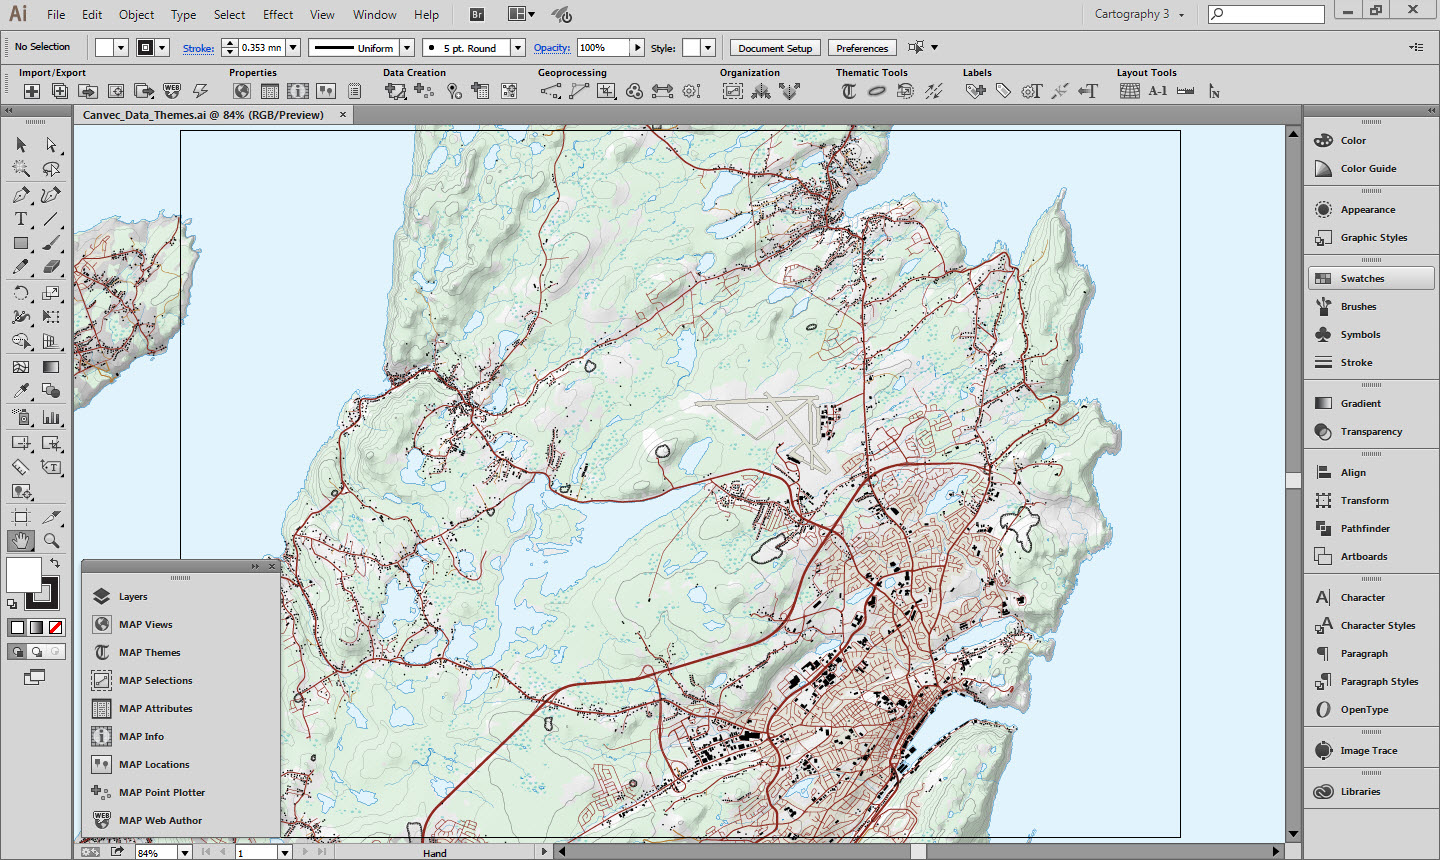
You will see this when importing data to MAPublisher:

Styled CanVec+ layers

1. Data Source

The data used in this guide comes from the publically available CanVec+ topographic database. CanVec+ contains a comprehensive set of layers optimized for display at 1:50,000 that are perfect for topographic mapping. In fact, many of these layers are used in the construction of the CanTopo Topographic mapping series available here.

The layers you receive from the CanVec+ download service will vary depending on what features are present in the extent chosen. The Geogratis Geospatial Data Extraction tool is the most convenient method to retrieve CanVec+ data. This guide uses a selection of CanVec+ layers styled similarly to the CanTopo maps.

All vector data was downloaded in an unprojected geodetic coordinate system and projected into a UTM projection MAP View.

The map shown above contains 12 vector layers and one raster layer, but we will only discuss the styling and configuration of three layers as the process is similar for the rest. You can download the Adobe Illustrator file at the bottom of the page if you want to examine the different layers, their graphic styles and MAP Themes.

MAP Themes are the primary method for applying attribute based cartographic symbology. A powerful feature is the ability to automatically do this on layer import based on geometry type or file name. By defining one or many graphic styles and a MAP Theme for each layer the layers can be automatically styled on import.
CanVec+ themes have a consistent naming scheme that makes them especially suitable for this sort of automated styling. Because each style is always named the same, it is simple to set up the MAP Themes to automatically apply when the layers are imported. The theme names are consistent but somewhat obscure, as are some of the attribute names and values. Luckily there is a specifications document that provides a guide to the various themes, datasets and attributes that are available. A link is provided in the useful resources section below. While the style guide is helpful, it can be difficult to navigate, so it has also been translated into a more easily readable Excel spreadsheet, which also available in the useful resources.

A CanTopo symbology guide is available for download and was used to help define the styles for the different layers used in this map. A link is available in the useful resources section at the bottom. The University of Toronto also hosts an old specifications guide, but as it is almost 14 years old it should not be assumed to be accurate. If you are looking for inspiration though, it is useful.


2. Example A: Building point locations

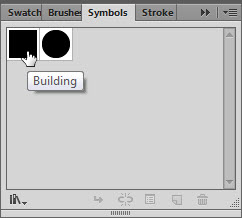
Building Symbols

2a. Building Point Symbol

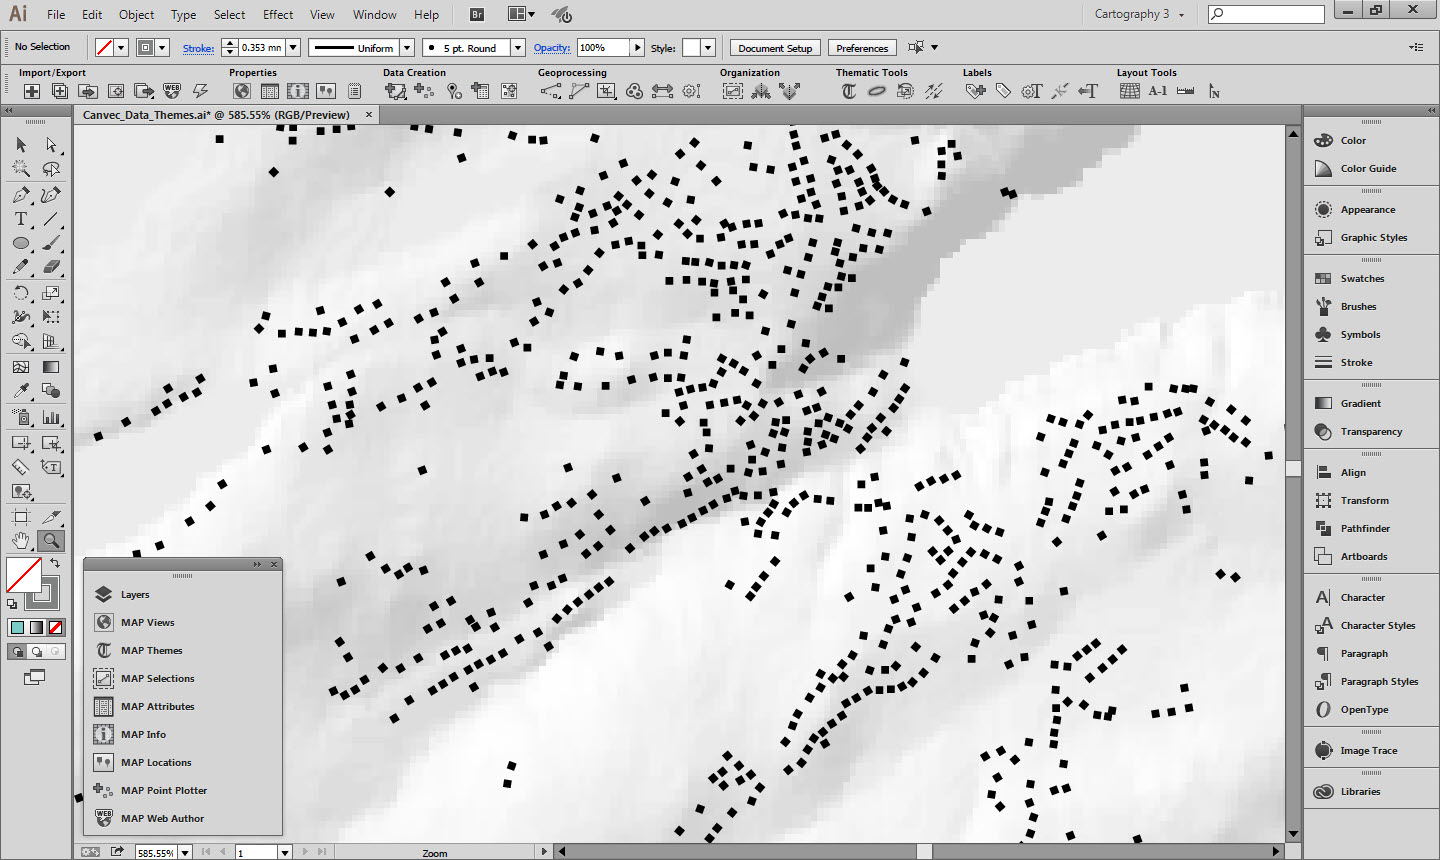
The Graphic style for the building symbols is a black square rotated to match the value in an orientation attribute. Using the CanTopo symbology guide a correctly sized square was created and then added to the symbol library.

Buildings Symbol

2b. MAP Theme

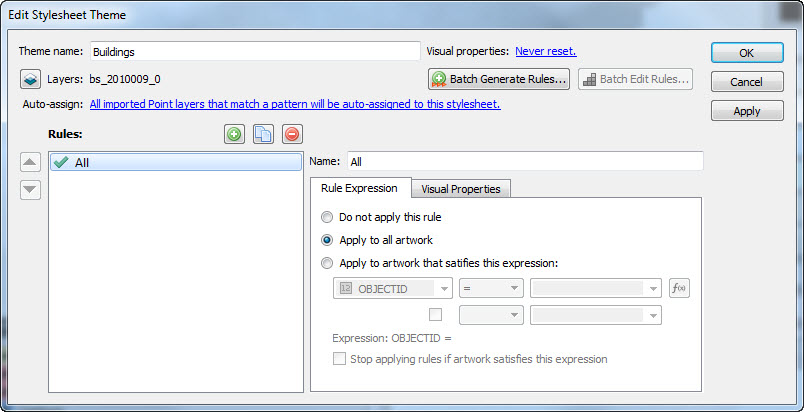
A new Point Stylesheet MAP Theme was created called Buildings. The appropriate layer “bs_2010009_0” was added to the Theme and a rule was created named “All” as it will apply to all the building point locations. The Rule Expression is set to apply the Theme to all artwork as we want all the building points to look the same.

Buildings Rule Expression tab

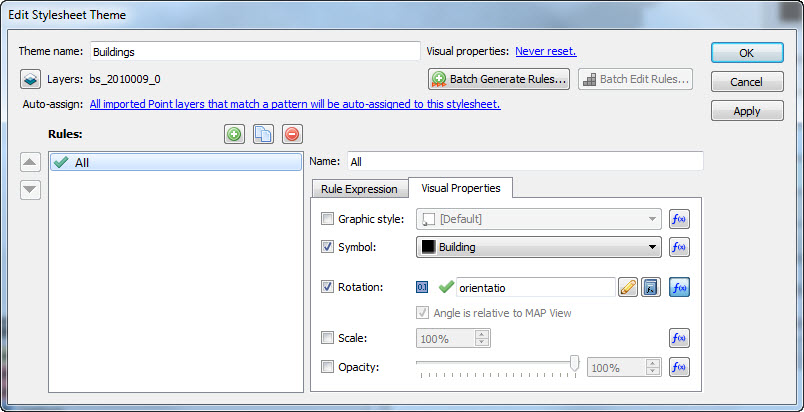
The Visual Properties tab was used to determine how the buildings would appear. The Symbol property was set to use the Building black square symbol created and added to the Symbol library earlier. The Rotation property was set to use the “orientatio” attribute. This ensures the buildings are oriented correctly.

Buildings Visual Properties tab

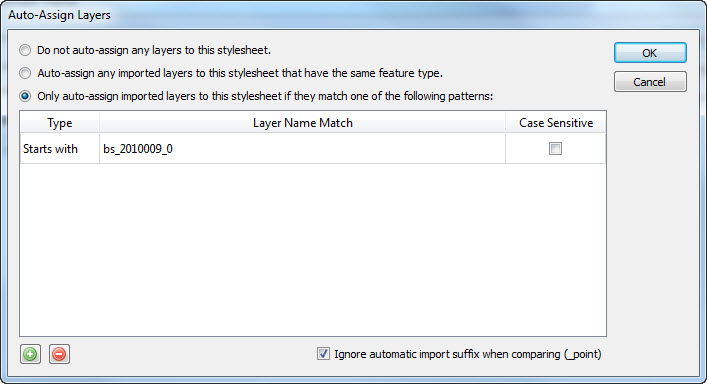
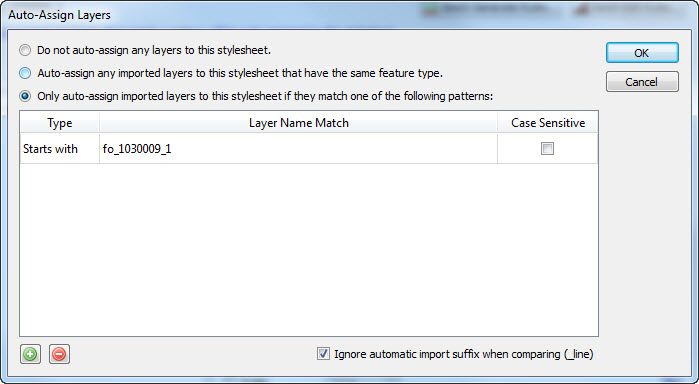
Finally, and most importantly for the MAP Theme automation, the Auto-assign option was set so that any layer that matches the filename of the imported shapefile would automatically be styled using this theme.

Buildings Auto-assign setting


3. Example B: Contours

Contours

3a. Contours Graphic Style

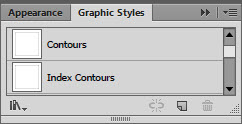
Two Graphic styles were created for the contours: one for the regular contours and one for the index contours at intervals of 100m. Both are grey, with the index contours slightly thicker (although it is hard to tell in the Graphic Styles panel.)

Contours Graphic Styles

3b. MAP Theme

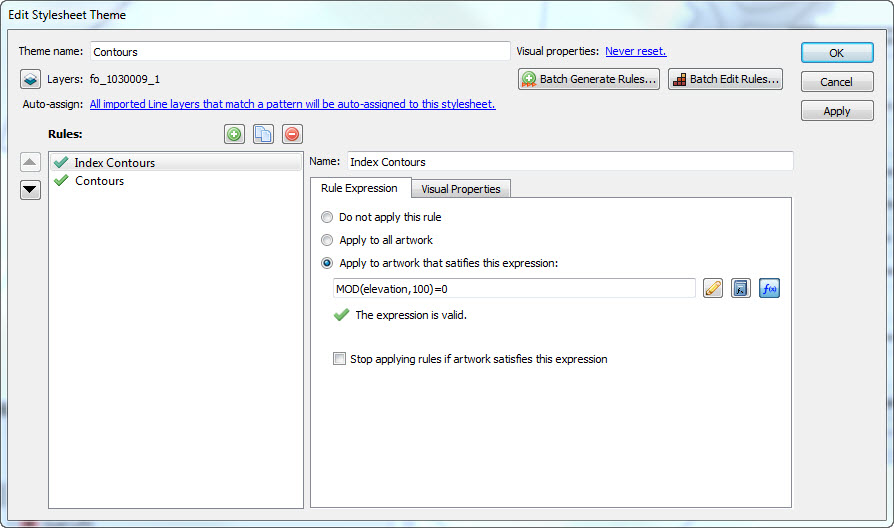
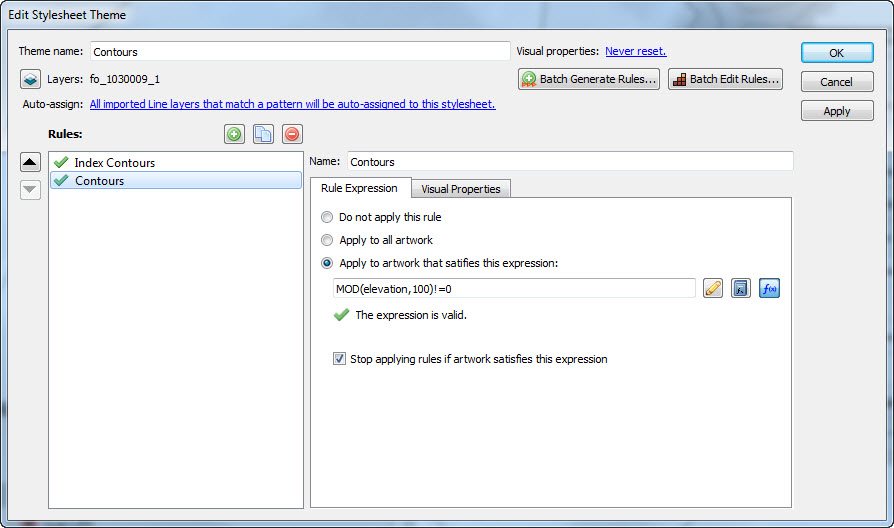
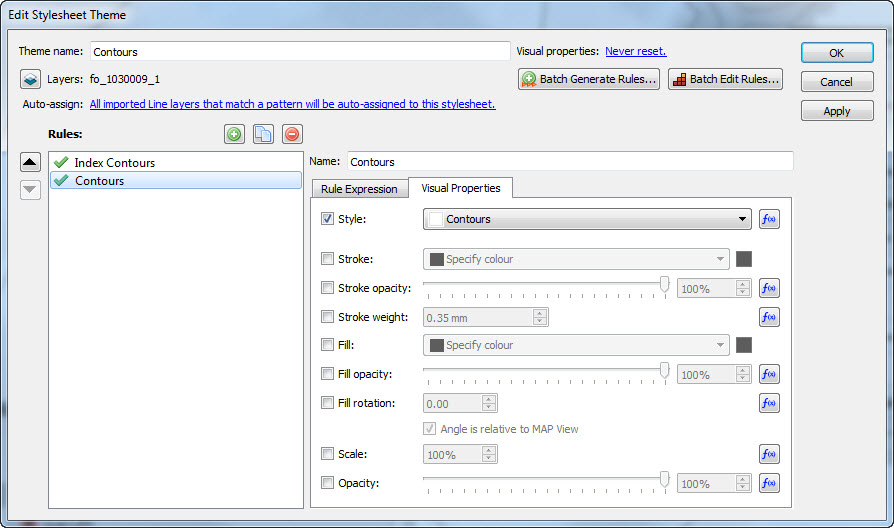
A Line Stylesheet MAP Theme was created called Contours. The layer “fo_1030009_1” was assigned to the MAP Theme. Two rules were created, one for index contours and one for regular contours. For the index contours, the Advanced Rule Expression builder is used to select any contour where the elevation is a multiple of 100, and the converse for the regular contours.

Index Contours Rule Expression

The Modulo (MOD) function makes this simple. For the index contours, the expression built as: “MOD(elevation,100)=0”. For the regular contours, the expression is “MOD(elevation,100)!=0”. The != operator means not equal to.

Contours Rule Expression

The Modulo function will be available with a future release of MAPublisher. If you are using an earlier version of MAPublisher, the same result for index contours can be had with this expression:

(elevation/100)-ROUNDDOWN(elevation/100,0)=0

If you do try and apply this MAP Theme with an earlier version of MAPublisher without changing the equations, it will not work and you will get errors.

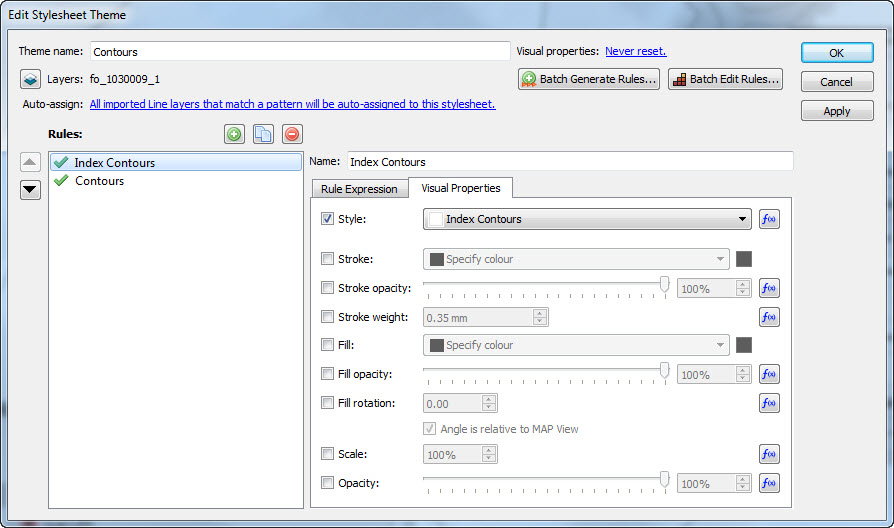
Each rule is assigned the appropriate graphic style applied in the Visual Properties. Creating Graphic Styles in advance is much easier than trying to remember specific stroke/colour combinations and makes them re-usable.

Index Contours Visual Properties

It is worthwhile organizing them in the Graphic Styles panel and naming the Graphic Styles appropriately so you can easily remember which is which later.

Contours Visual Properties

The layer is then set as auto-assigned so that when it is imported in the future this MAP Theme will automatically be applied.

Contours Auto-assign setting


4. Example C: Roads

Roads

4a. Graphic Style

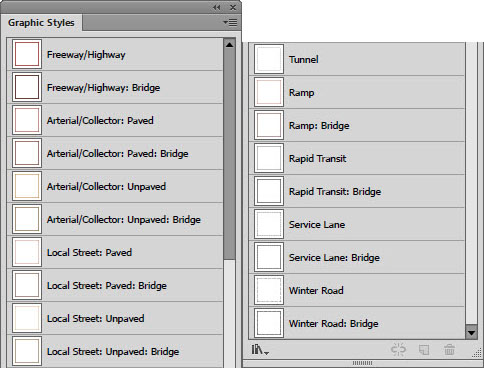
The Roads layer is the most complex as there are multiple different classes of roads, that are then broken down into sealed and unsealed surfaces, and can be at grade, tunnels or bridges. Several of the road classes are assigned the same Graphic Style, so each style was named after a representative road class and assigned to several MAP Theme Rules.

Roads Graphic Styles

4b. MAP Theme

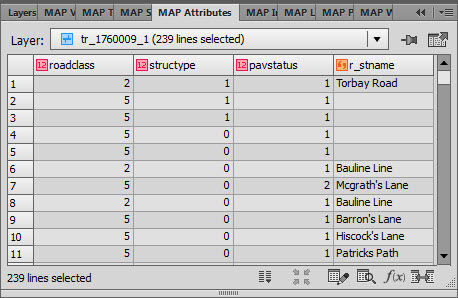
There are defined styles of roads in the CanTopo specifications, but these do not map directly to the attributes that are present in the CanVec roads dataset. There are several attributes that hold information about the composition of the road, but the ones that were used to define the MAP Theme Rules were:

  1. roadclass: a heirachy of road types
  2. structype: defines if the road is a road, a bridge or a tunnels
  3. pavstatus: contains information on the road surface, if it is paved or unpaved.
Roads Attributes (many others are hidden)

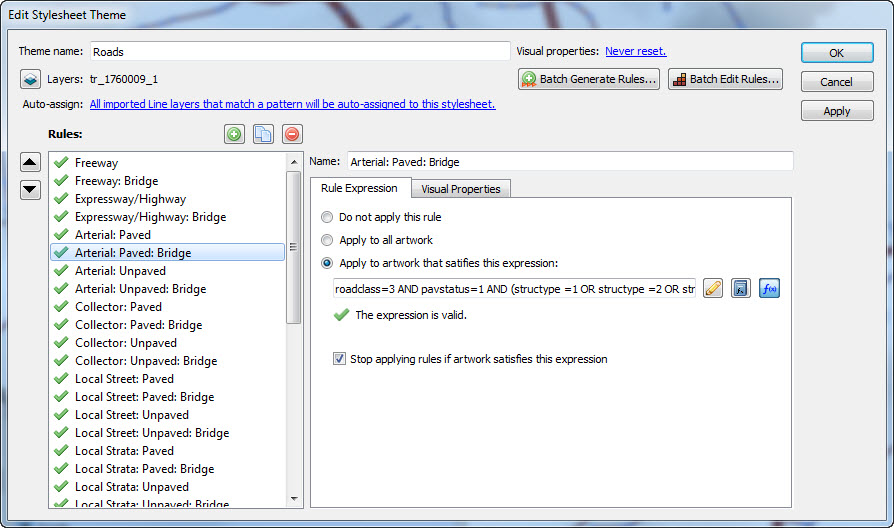
A Line Stylesheet Theme was created called Roads. The layer tr_1760009_1 was assigned to this Theme. Each road class has its own rule. The rule expression determine what class of road it is, if it is a bridge or a tunnel, and if it is paved or unpaved. An example of this is “Arterial: Paved: Bridge” with the expression:

roadclass=3 AND pavstatus=1 AND (structype =1 OR structype =2 OR structype =3 OR structype =4)

which simply says select art that is an Arterial Road (roadclass=3) is paved (pavstatus=1) and one of four different types of bridge (structype 1 through 4).

Roads Rule Expression

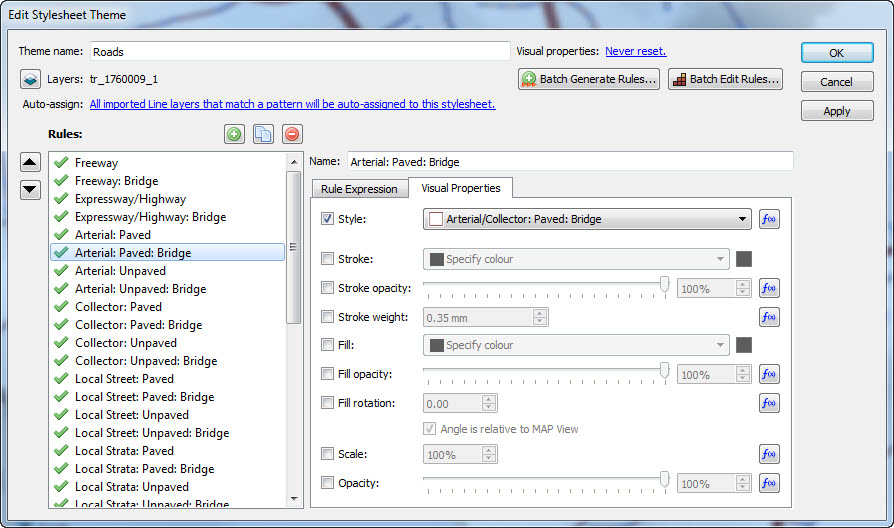
As in previous examples, each rule is assigned a Graphic Style in the Visual Properties tab.

Roads Visual Properties

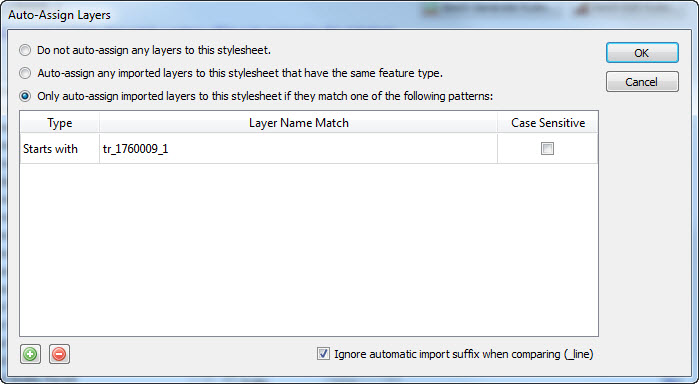
The layer is set to auto apply on import.

Roads Auto-assign setting

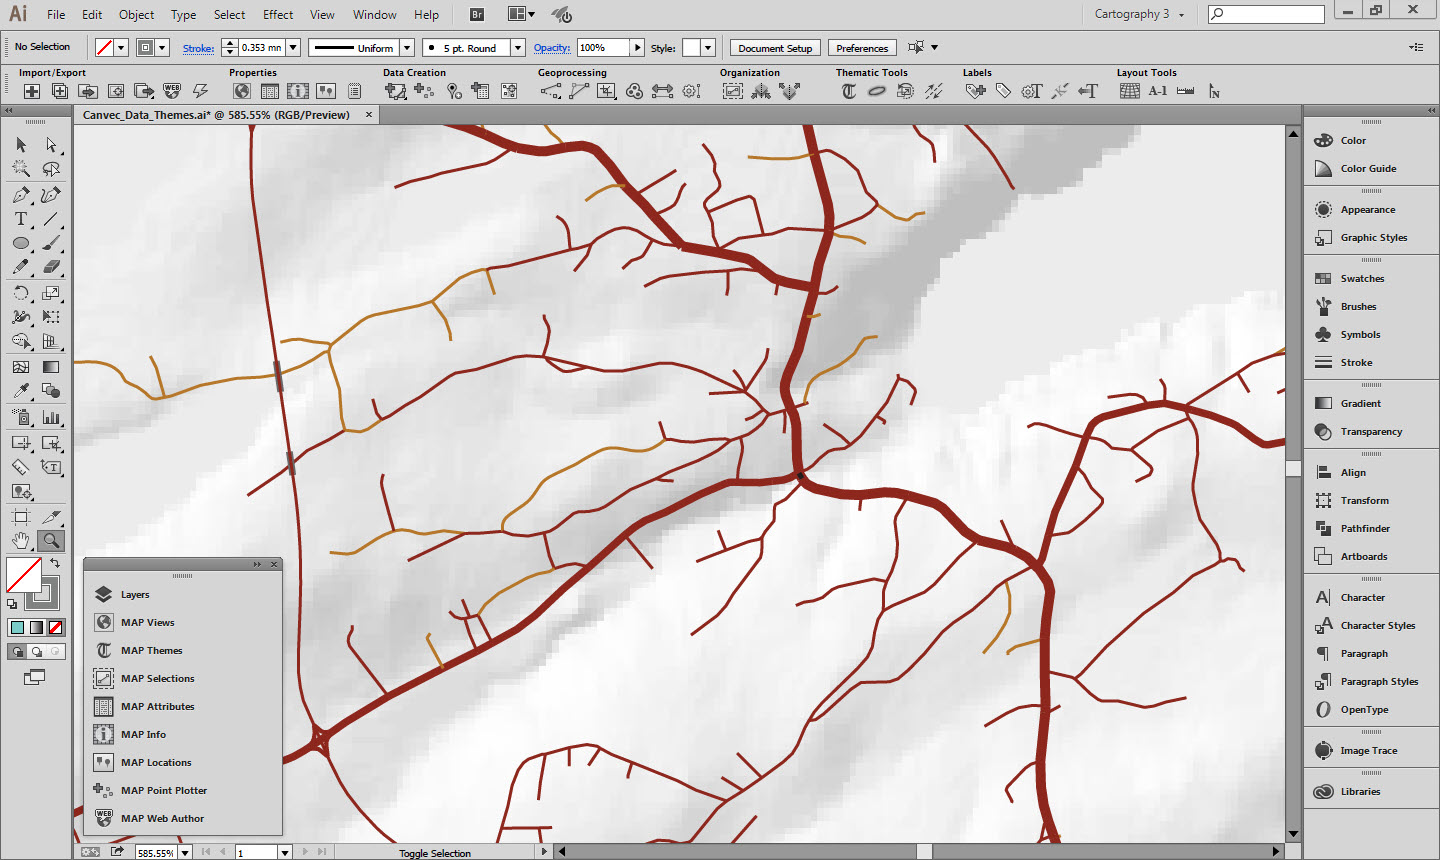
Once rules are created and applied to all the imported layers the end result looks like this:

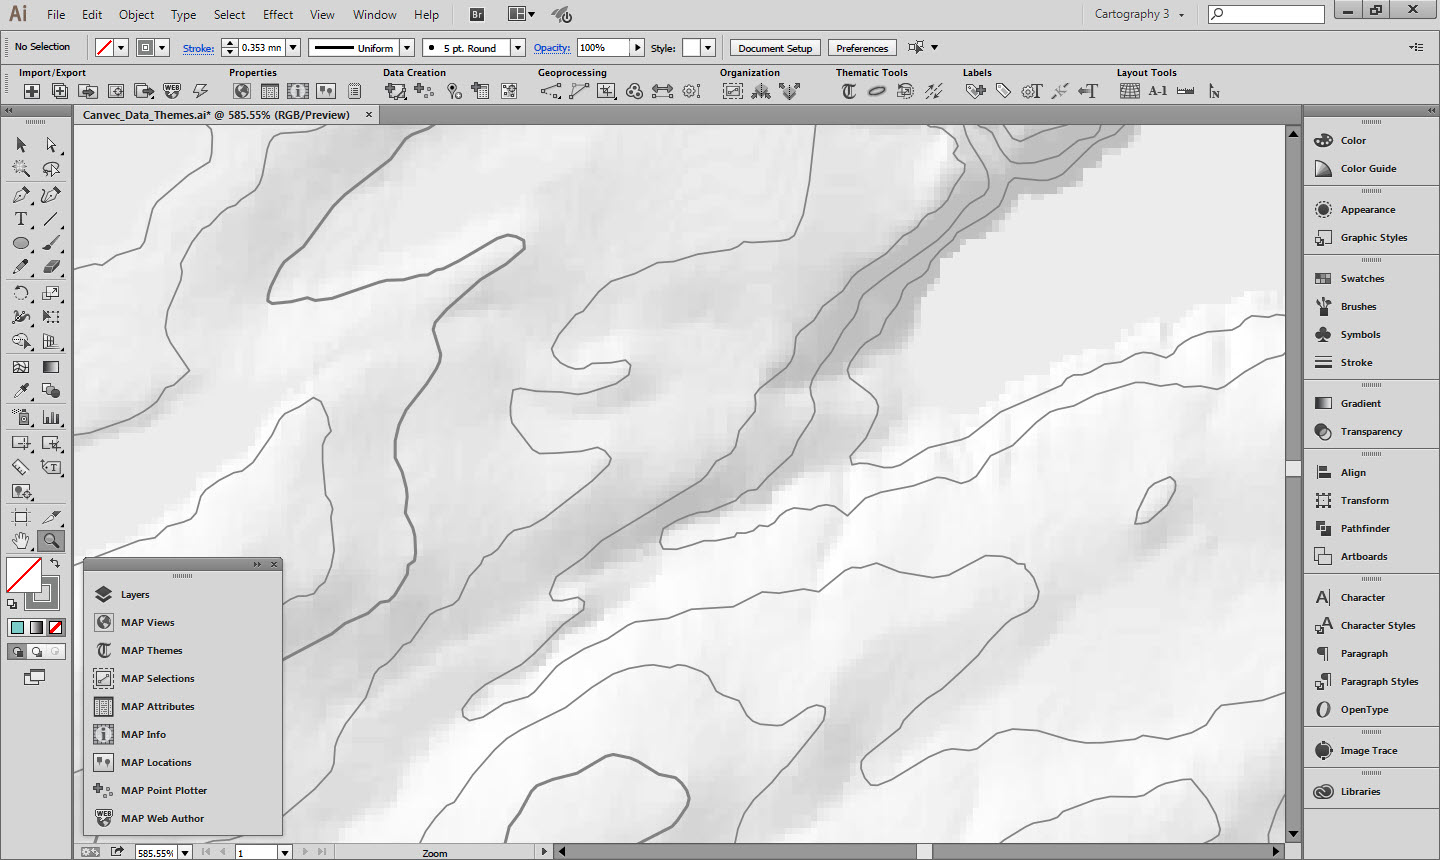
Styled Layers overlaid on hillshade


5. Hillshade

In addition to vector data, the GeoGratis portal has raster terrain data available for download. There are digital elevation models, digital surface models, and a variety of derived products such as slope and aspect. For this map we downloaded a hillshade and adjusted the opacity so it would blend with the map style. The forest cover layer and the built up areas layer also had their blending modes adjusted so the hillshade would show through.

The hillshade was downloaded in an unprojected geodetic coordinate system and Geographic Imager was used to transform it into the UTM projection used for this map.


6. Final words

In order for the defined MAP Themes to be automatically applied to any imported data, the imported layer filenames must match those defined in the MAP Theme Rules as discussed above. If you would like to try it out with your own CanVec data extract, do the following:

  1. Download the “Canvec_Data_Themes.ai” file linked below for the version of Illustrator you are using. Have a look at the data structure, layer names and MAP View properties of this document.
  2. Also download the appropriate “Canvec_Data_Themes_Empty.ai” file to use as a template.
  3. Download an extract of CanVec data as shapefiles.
  4. Use the Advanced Import functionality to import the shapefiles into the empty document. Reproject the map if desired.
  5. The imported data have the styles applied automatically. However, you will probably have a few layers that have no style. Use the methods detailed above to create new styles for those layers.


7. Useful resources

CanVec Demo. (Created with MAPublisher 9.5.3, AI CC2014) – File Download
CanVec Demo – No Layers. (Created with MAPublisher 9.5.3, AI CC2014) – File Download
CanVec Demo. (Created with MAPublisher 9.5.3, AI CS6) – File Download
CanVec Demo – No Layers. (Created with MAPublisher 9.5.3, AI CS6) – File Download
GeoGratis Website
GeoGratis FAQ’s
CanVec Style Guide for Adobe Illustrator – File Download
CanVec Feature Catalog
CanVec feature Catalog Spreadsheet (Unofficial, non-maintained. For information only.) – File Download
University of Toronto Topographic Cartographic Symbols Archive

Labeling Trick for MAPublisher

This blog post was written by Avenza reseller in The Netherlands, Hans van der Maarel of Red Geographics.

When you’re labeling point features (let’s say cities) in MAPublisher, using either Label Pro or Label Features, and you’re not placing a label for every single point, you’re left with the task of removing the points you haven’t labeled. This trick will have the text inherit the attribute structure of the points including a lat/long and guarantee that there are no orphan points.

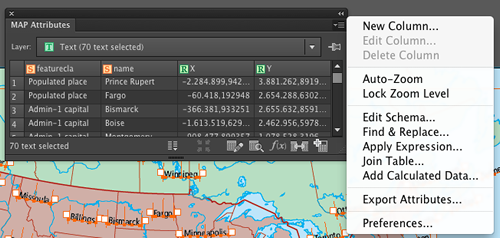
Take for example the above map. I want to label the cities, but not all of them. I’ll decide as I go along which city will get labeled, and which will get dropped. In order to more easily remove the unlabeled cities I need to do some preparation. I’ll create two columns in the cities layer, X and Y, and assign the expression #MapX and #MapY to them, respectively. It’s important that you do this through the Apply Expression option in the Map Attribute panel.

This gives two attributes with the original coordinates of the city points.

Next, I’ll create a layer for the labels and put it into the MAP View as a text layer, indicating that I want to copy the attribute structure of the cities layer.

Now that all the preparatory work is done, I’ll start the labeling. I’m going to be using the Label Features option, but this will work with MAP LabelPro as well.

If I select one of the texts and look at its attributes, I’ll see that the attributes from the city point have been transferred to the text, including the X and Y attributes which hold the position of the original city point.

Next, I’ll remove the city points layer, select all city labels and use the Export Attributes option in the MAP Attributes panel:

This will export a comma-delimited text file (CSV). Make sure to check the “Field names on first line” option. It’s not exactly necessary, but it will make things a lot easier.

Import the CSV file back into MAPublisher. Make sure to specify that the projection of the data is the same as the existing MAP View. Once the data is imported, you can apply any existing Stylesheets that you had in place to style the cities, or create a new one. This way, you end up with just the symbols for the cities you’ve actually labeled.

Changing the Point Angle using Expressions and Attribute Values in MAPublisher

Here we have placed point symbols for a MAP Point layer. However, we want to change the point angle using the Attribute values.

Step 0: my point (not rotated)

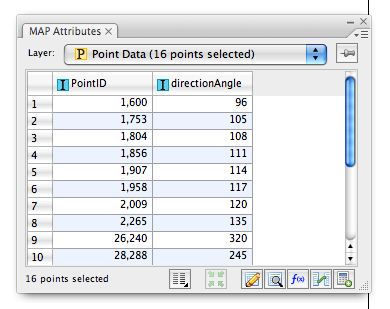
Below is the attribute table for the point data shown above. The field directionAngle is the field containing the symbol rotation value. With MAPublisher, it’s possible to assign this value to every symbol in this layer.

step 1: Attribute data

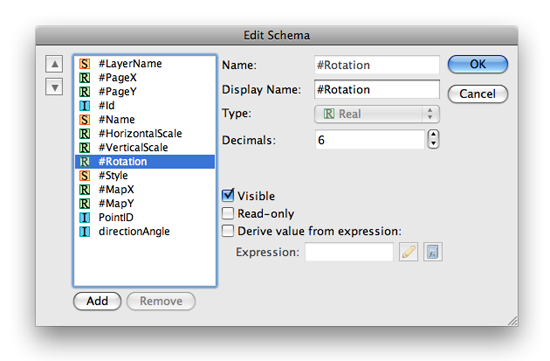
Open the Edit Schema dialog box from the MAP Attribute panel. Find the field called #Rotation from the attribute field list. This #Rotation field is hidden/invisible by default. Click the Visible option to enable it and click OK.

MAP Attributes > Edit Schema

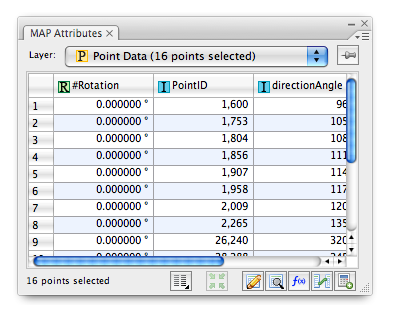
In the MAP Attributes panel, you can see that the #Rotation field shown. The values in this field is 0.00 degree for every point in the layer. We’ll assign the angle value from the directionAngle field to the #Rotation value .

MAP Attributes panel with the #Rotation field displayed

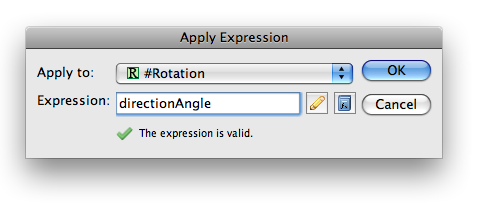
Open the Apply Expression dialog box from the MAP Attributes panel. Enter the column name directionAngle for the Expression and ensure that the value will be applied to the field #Rotation.

MAP Attributes panel > Apply Expression

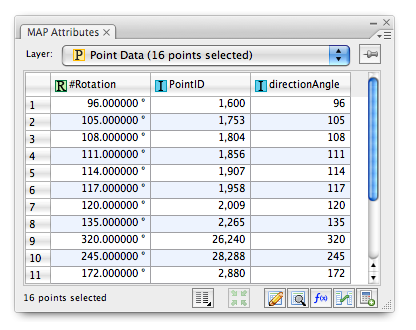
Every value from the directionAngle field is now inherited by the #Rotation field.

MAP Attributes: Angle value assigned

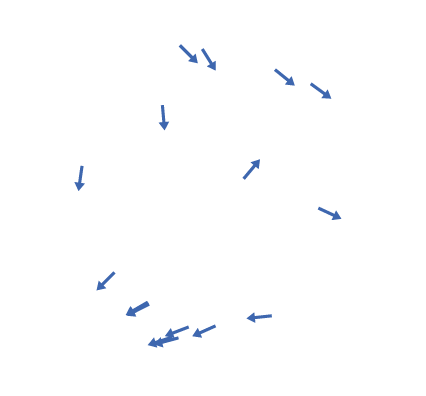
As a result, the rotation angle is now applied to every point.

Point symbols after the angle values are assigned

The origin of the rotation is at each point’s registration point. With Adobe Illustrator CS4 and earlier, the registration point is set at the centre of the point symbol. With Adobe Illustrator CS5, the registration point can be flexibly placed. This will be discussed with some examples in a later topic. Stay tuned!

Working with Custom Highway Shield Symbols and Label Features

MAPublisher offers a variety of labelling options, ranging from the MAP Tagger tool used for hand labelling single pieces of art, the Label Features tool for automatic attribute labelling, and MAPublisher LabelPro™, a separately licensed advanced labelling engine.

MAPublisher LabelPro ships with nearly 100 highway shields from across North America into which attribute labels can be easily placed. Although LabelPro does not support adding custom symbols to its existing symbols library, the following instructions outline a manual method for adding a custom highway shield to your map, along with placing text on to this shield.

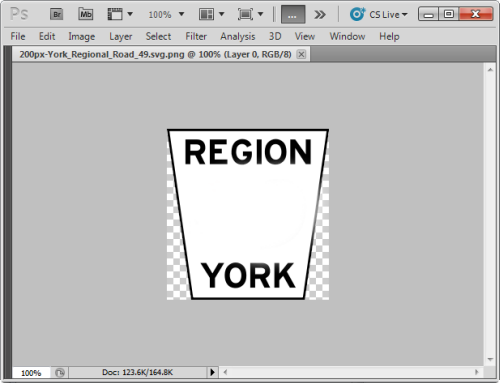
First we must setup our custom shield. This can be drawn in Adobe Illustrator, or produced from a pre-existing image brought into Illustrator using the File > Place menu option. For this exercise I have taken a highway shield I found online from York Region Ontario, and using Adobe Photoshop removed the highway number from the shield.

Working with MAPublisher for Adobe Illustrator

Once the shield is drawn and sized appropriately and placed in Illustrator, simply use the Selection Tool to drag the symbol into the Adobe Illustrator Symbols panel. Be sure to name the symbol, as you will need to access the symbol from a list later on; I named mine “York_Shield”

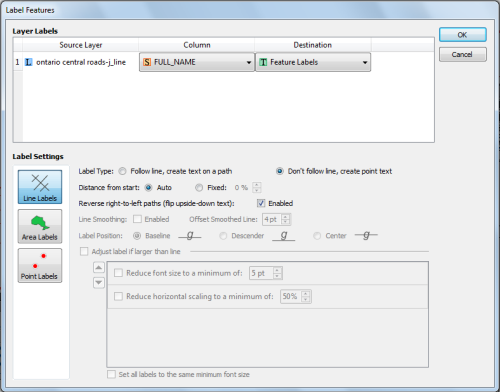
Our next step is to produce our feature labels. Using the Label Features tool, choose to label with the “Don’t follow line, create point text” option selected. Once the labels are placed on the map, use the Adobe Layers panel to select the labels and use the Paragraph panel or the Control Toolbar to centre justify the labels. This step is important for easily lining up our shields with the labels.

Label map features

We now need to create a point layer with a point corresponding to each label. This is easily done by using the MAP Attribute panel option menu to “Export Attributes..” of our newly created Feature Labels MAP Text Layer. Be sure to choose export all attributes under Options: Scope, and to check “Include column names on first line” as we will be using the hidden MAPX and MAPY attribute columns when importing this data back into the map as point data.

Export map attributes

Next, use the MAPublisher Simple Import tool to add the newly created .csv file of referenced attribute information. When prompted by the Settings dialog, choose the MAPX column as the column containng X coordinates, and MAPY for Y coordinates. Once the data is imported, if it has not been added to the MAP View containing your line and text layers, add it, and specify the coordinate system if necessary.

MAPublisher Settings

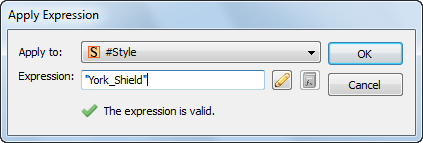
With the imported point data selected, open the MAP Attribute panel and right click a column heading to access the Show/Hide Columns > Show All option. double click the #Style column and change the style to your shield symbol. Use the Apply Expression tool in the option menu to apply the symbol to every item at once.

Apply expressions

Alternately, a MAP Stylesheet can be built to apply the symbol only to art with a specific range of attributes. In the Adobe layers panel move your label layer above your symbol layer.

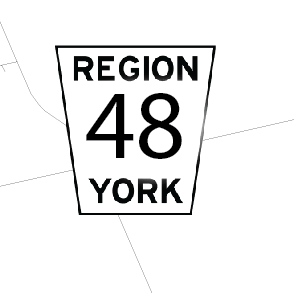
If text and symbol do not line up as desired, the symbol geometry will need to be altered. If you are using CS5, doubble click the shield in the symbol panel to enter isolation mode, here you can drag the symbol to respecify the anchor point so that your symbol lines up as you would like it. If you are using CS3 or CS4, you will need to add some invisible art (no stroke/no fill) just below or above the symbol to adjust its extents, and where exactly the symbol’s centre point is located. As well, symbol and text rotation can be edited globally by changing the #Rotation attribute in the MAP Attributes panel.

MAPublisher highway shields

News Archive