My Account     Contact Us     Cart

Using MAP Themes to Automatically Style CanVec+ Data on Import in MAPublisher

Creating multiple maps that share cartographic styling is a common requirement for MAPublisher users. The most effective way to accomplish this is the use of MAP Themes. MAP Themes are a collection of thematic cartography tools designed to increase productivity by automating how styles and symbols are applied. Creating a number of MAP Themes based on regularly used layers with standard attribute schemas can greatly reduce the amount of time spent styling maps.

This guide will walk through creating and setting up MAP Themes to automatically apply to the appropriate layers upon import. If done correctly, rather than seeing this:


Unstyled CanVec+ layers


You will see this when importing data to MAPublisher:

Styled CanVec+ layers

1. Data Source

The data used in this guide comes from the publically available CanVec+ topographic database. CanVec+ contains a comprehensive set of layers optimized for display at 1:50,000 that are perfect for topographic mapping. In fact, many of these layers are used in the construction of the CanTopo Topographic mapping series available here.

The layers you receive from the CanVec+ download service will vary depending on what features are present in the extent chosen. The Geogratis Geospatial Data Extraction tool is the most convenient method to retrieve CanVec+ data. This guide uses a selection of CanVec+ layers styled similarly to the CanTopo maps.

All vector data was downloaded in an unprojected geodetic coordinate system and projected into a UTM projection MAP View.

The map shown above contains 12 vector layers and one raster layer, but we will only discuss the styling and configuration of three layers as the process is similar for the rest. You can download the Adobe Illustrator file at the bottom of the page if you want to examine the different layers, their graphic styles and MAP Themes.

MAP Themes are the primary method for applying attribute based cartographic symbology. A powerful feature is the ability to automatically do this on layer import based on geometry type or file name. By defining one or many graphic styles and a MAP Theme for each layer the layers can be automatically styled on import.

CanVec+ themes have a consistent naming scheme that makes them especially suitable for this sort of automated styling. Because each style is always named the same, it is simple to set up the MAP Themes to automatically apply when the layers are imported. The theme names are consistent but somewhat obscure, as are some of the attribute names and values. Luckily there is a specifications document that provides a guide to the various themes, datasets and attributes that are available. A link is provided in the useful resources section below. While the style guide is helpful, it can be difficult to navigate, so it has also been translated into a more easily readable Excel spreadsheet, which also available in the useful resources.

A CanTopo symbology guide is available for download and was used to help define the styles for the different layers used in this map. A link is available in the useful resources section at the bottom. The University of Toronto also hosts an old specifications guide, but as it is almost 14 years old it should not be assumed to be accurate. If you are looking for inspiration though, it is useful.


2. Example A: Building point locations

Building Symbols

2a. Building Point Symbol

The Graphic style for the building symbols is a black square rotated to match the value in an orientation attribute. Using the CanTopo symbology guide a correctly sized square was created and then added to the symbol library.

Buildings Symbol

2b. MAP Theme

A new Point Stylesheet MAP Theme was created called Buildings. The appropriate layer “bs_2010009_0” was added to the Theme and a rule was created named “All” as it will apply to all the building point locations. The Rule Expression is set to apply the Theme to all artwork as we want all the building points to look the same.

Buildings Rule Expression tab

The Visual Properties tab was used to determine how the buildings would appear. The Symbol property was set to use the Building black square symbol created and added to the Symbol library earlier. The Rotation property was set to use the “orientatio” attribute. This ensures the buildings are oriented correctly.

Buildings Visual Properties tab

Finally, and most importantly for the MAP Theme automation, the Auto-assign option was set so that any layer that matches the filename of the imported shapefile would automatically be styled using this theme.

Buildings Auto-assign setting


3. Example B: Contours

Contours

3a. Contours Graphic Style

Two Graphic styles were created for the contours: one for the regular contours and one for the index contours at intervals of 100m. Both are grey, with the index contours slightly thicker (although it is hard to tell in the Graphic Styles panel.)

Contours Graphic Styles

3b. MAP Theme

A Line Stylesheet MAP Theme was created called Contours. The layer “fo_1030009_1” was assigned to the MAP Theme. Two rules were created, one for index contours and one for regular contours. For the index contours, the Advanced Rule Expression builder is used to select any contour where the elevation is a multiple of 100, and the converse for the regular contours.

Index Contours Rule Expression

The Modulo (MOD) function makes this simple. For the index contours, the expression built as: “MOD(elevation,100)=0”. For the regular contours, the expression is “MOD(elevation,100)!=0”. The != operator means not equal to.

Contours Rule Expression

The Modulo function will be available with a future release of MAPublisher. If you are using an earlier version of MAPublisher, the same result for index contours can be had with this expression:

(elevation/100)-ROUNDDOWN(elevation/100,0)=0

If you do try and apply this MAP Theme with an earlier version of MAPublisher without changing the equations, it will not work and you will get errors.

Each rule is assigned the appropriate graphic style applied in the Visual Properties. Creating Graphic Styles in advance is much easier than trying to remember specific stroke/colour combinations and makes them re-usable.

Index Contours Visual Properties

It is worthwhile organizing them in the Graphic Styles panel and naming the Graphic Styles appropriately so you can easily remember which is which later.

Contours Visual Properties

The layer is then set as auto-assigned so that when it is imported in the future this MAP Theme will automatically be applied.

Contours Auto-assign setting


4. Example C: Roads

Roads

4a. Graphic Style

The Roads layer is the most complex as there are multiple different classes of roads, that are then broken down into sealed and unsealed surfaces, and can be at grade, tunnels or bridges. Several of the road classes are assigned the same Graphic Style, so each style was named after a representative road class and assigned to several MAP Theme Rules.

Roads Graphic Styles

4b. MAP Theme

There are defined styles of roads in the CanTopo specifications, but these do not map directly to the attributes that are present in the CanVec roads dataset. There are several attributes that hold information about the composition of the road, but the ones that were used to define the MAP Theme Rules were:

  1. roadclass: a heirachy of road types
  2. structype: defines if the road is a road, a bridge or a tunnels
  3. pavstatus: contains information on the road surface, if it is paved or unpaved.
Roads Attributes (many others are hidden)

A Line Stylesheet Theme was created called Roads. The layer tr_1760009_1 was assigned to this Theme. Each road class has its own rule. The rule expression determine what class of road it is, if it is a bridge or a tunnel, and if it is paved or unpaved. An example of this is “Arterial: Paved: Bridge” with the expression:

roadclass=3 AND pavstatus=1 AND (structype =1 OR structype =2 OR structype =3 OR structype =4)

which simply says select art that is an Arterial Road (roadclass=3) is paved (pavstatus=1) and one of four different types of bridge (structype 1 through 4).

Roads Rule Expression

As in previous examples, each rule is assigned a Graphic Style in the Visual Properties tab.

Roads Visual Properties

The layer is set to auto apply on import.

Roads Auto-assign setting

Once rules are created and applied to all the imported layers the end result looks like this:

Styled Layers overlaid on hillshade


5. Hillshade

In addition to vector data, the GeoGratis portal has raster terrain data available for download. There are digital elevation models, digital surface models, and a variety of derived products such as slope and aspect. For this map we downloaded a hillshade and adjusted the opacity so it would blend with the map style. The forest cover layer and the built up areas layer also had their blending modes adjusted so the hillshade would show through.

The hillshade was downloaded in an unprojected geodetic coordinate system and Geographic Imager was used to transform it into the UTM projection used for this map.


6. Final words

In order for the defined MAP Themes to be automatically applied to any imported data, the imported layer filenames must match those defined in the MAP Theme Rules as discussed above. If you would like to try it out with your own CanVec data extract, do the following:

  1. Download the “Canvec_Data_Themes.ai” file linked below for the version of Illustrator you are using. Have a look at the data structure, layer names and MAP View properties of this document.
  2. Also download the appropriate “Canvec_Data_Themes_Empty.ai” file to use as a template.
  3. Download an extract of CanVec data as shapefiles.
  4. Use the Advanced Import functionality to import the shapefiles into the empty document. Reproject the map if desired.
  5. The imported data have the styles applied automatically. However, you will probably have a few layers that have no style. Use the methods detailed above to create new styles for those layers.


7. Useful resources

CanVec Demo. (Created with MAPublisher 9.5.3, AI CC2014) – File Download
CanVec Demo – No Layers. (Created with MAPublisher 9.5.3, AI CC2014) – File Download
CanVec Demo. (Created with MAPublisher 9.5.3, AI CS6) – File Download
CanVec Demo – No Layers. (Created with MAPublisher 9.5.3, AI CS6) – File Download
GeoGratis Website
GeoGratis FAQ’s
CanVec Style Guide for Adobe Illustrator – File Download
CanVec Feature Catalog
CanVec feature Catalog Spreadsheet (Unofficial, non-maintained. For information only.) – File Download
University of Toronto Topographic Cartographic Symbols Archive

Making a Map Without Knowing What the Final Extent or Scale Will Be

Ever have the problem that you want to make a map and you are waiting on the final extent or scale, but you want to get started adding data and working on the layout? Here are a couple of tips to make your life easier.


1. Move artboards around without moving your data

Geographic features in Adobe Illustrator are generally referenced to a known coordinate system. This coordinate system is mapped to Adobe Illustrator’s “Global Coordinate System” which has its origin at the top-left corner of the first artboard in a document. What this implies is that artboards can be moved around within this reference system in order to show different geographic data on the page. However, by default, moving an artboard moves any art that overlaps it as well. Obviously moving any referenced data around is going to ruin its spatial accuracy so this is something we want to avoid. Luckily there are two ways of doing this.

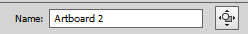
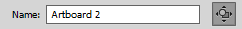
The first is to select the Artboard tool and click the Move/Copy artwork with artboard button to the right of the artboard name in the control panel above the document window.

Active artboard tool at the top left.
Deactivated Move/Copy artwork with artboard button at right.

With this option turned off, you are free to move the artboard around without disturbing any of the geographic data.

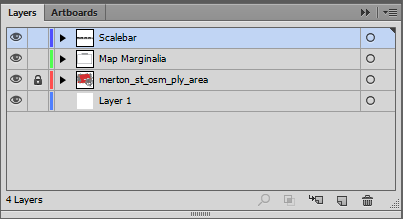
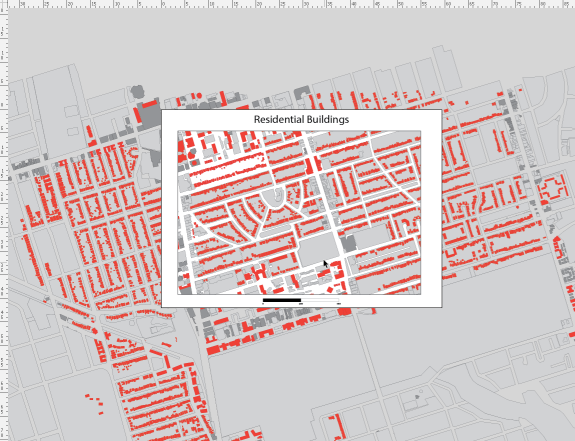
There is one downside to this though: you may have map elements such as titles, legends, grids, masks etc. that you want to stay locked in place on the artboard while you move it around the geographic data. The easiest way to do this is to simply lock any layers that contain geographic features, unlock the map elements, and activate the Move/Copy art with artboard option.

Non-map layers are unlocked while the layer that contains geographic data is locked.
Activated Move/Copy artwork with artboard button at right.

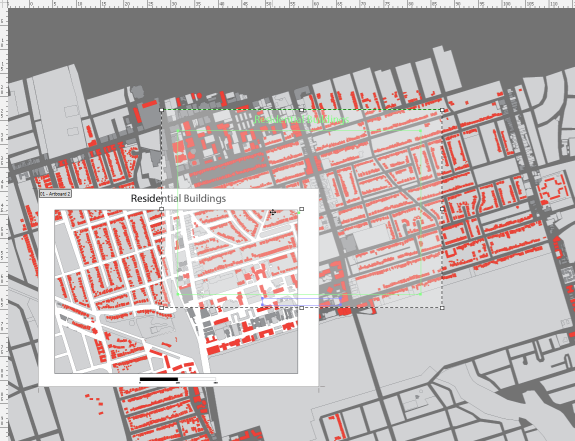
When the artboard is repositioned, your data will stay in the correct geographic location and your map elements will move with the artboard, keeping the same relative position.

Three images showing an artboard moving while the geographic data stays put.

2. Set up a clipping mask in conjunction with a grid

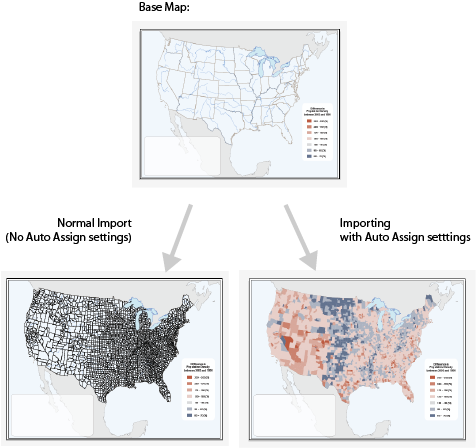
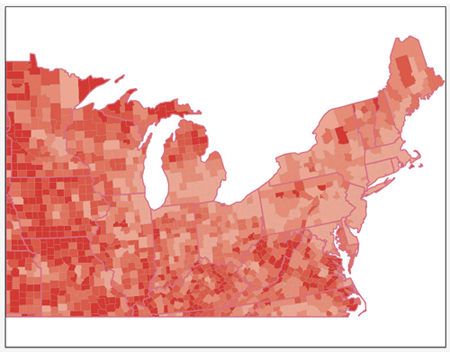
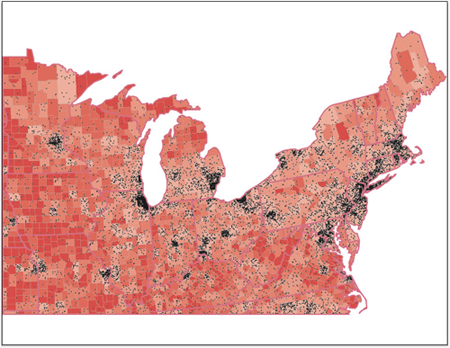
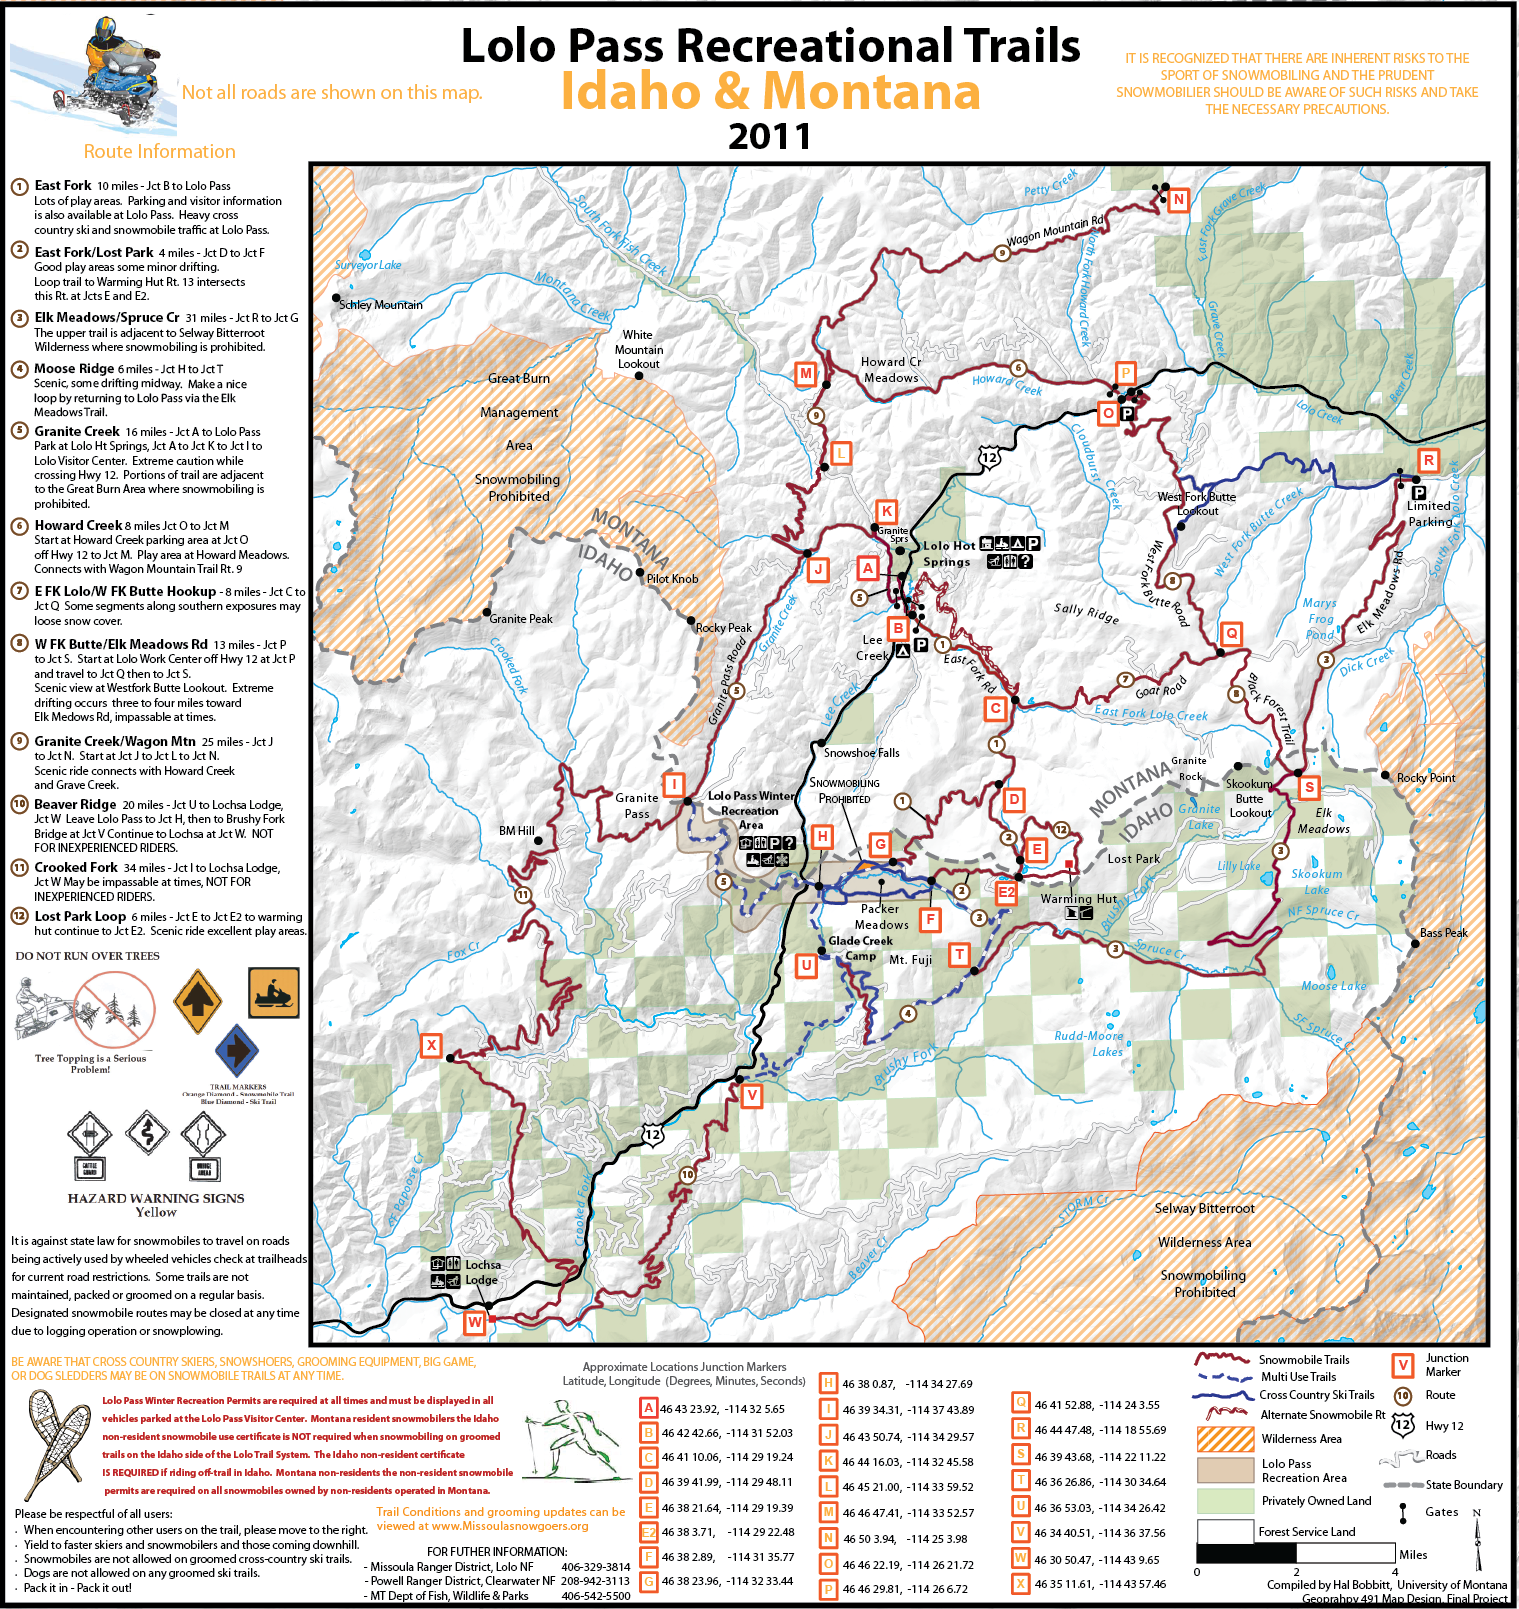
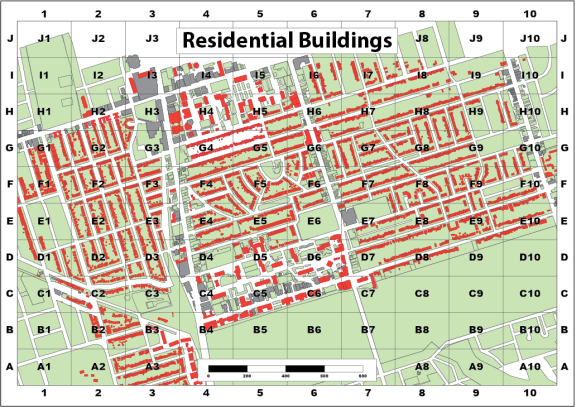
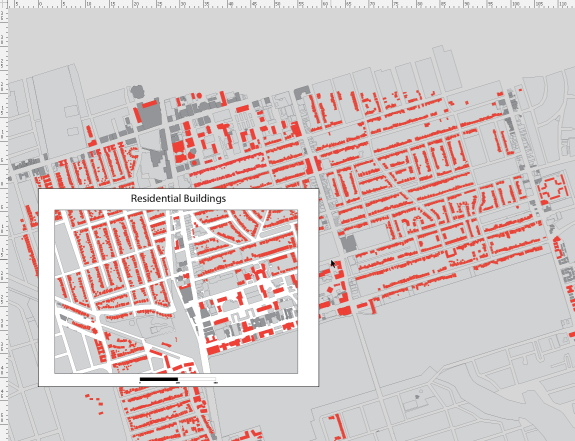
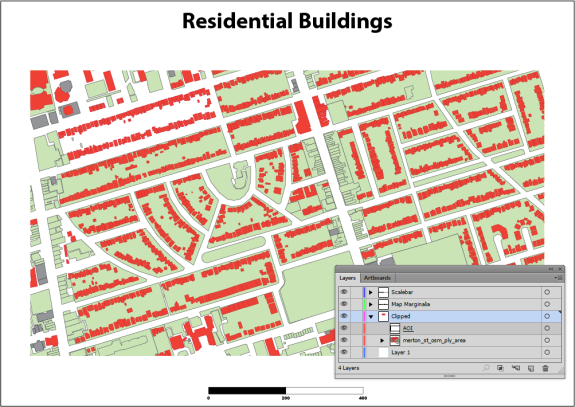
The previous example used a white polygon with a hole in the middle as a mask to provide whitespace around the edge of the map. Another way to achieve this is to use a clipping mask to hide geographic features outside the extent of the mask. This works well by itself, or when combined with a grid or graticule layer.

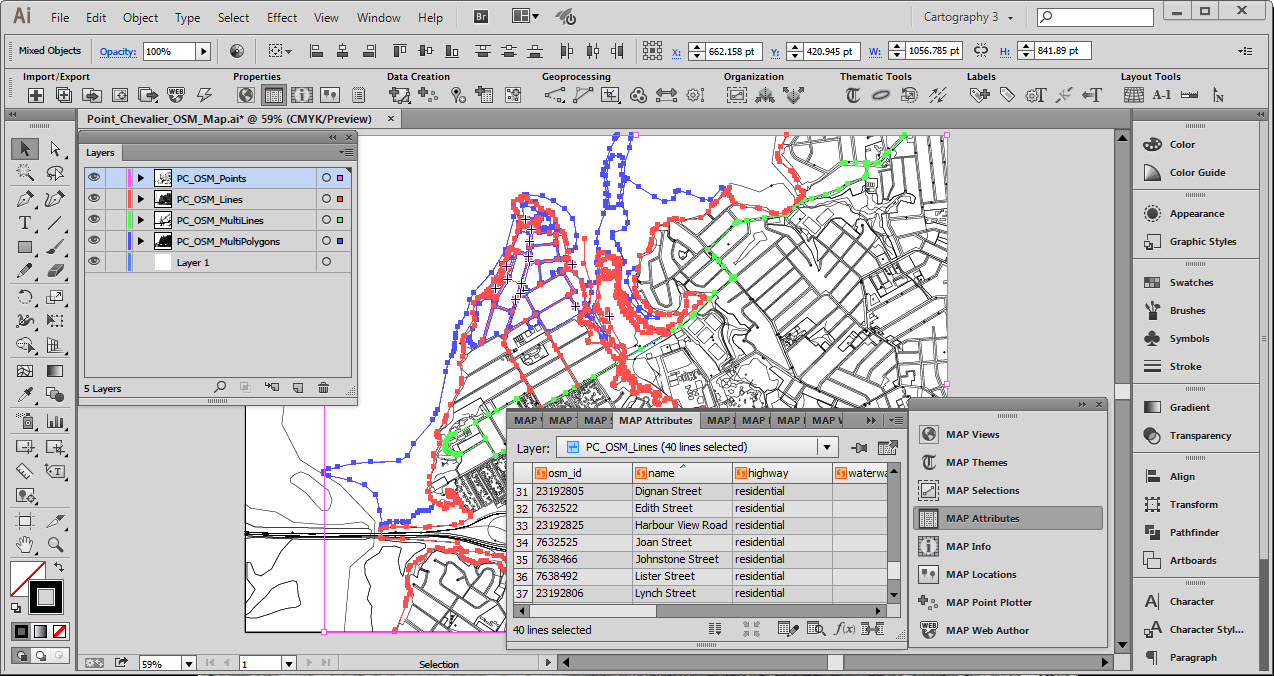
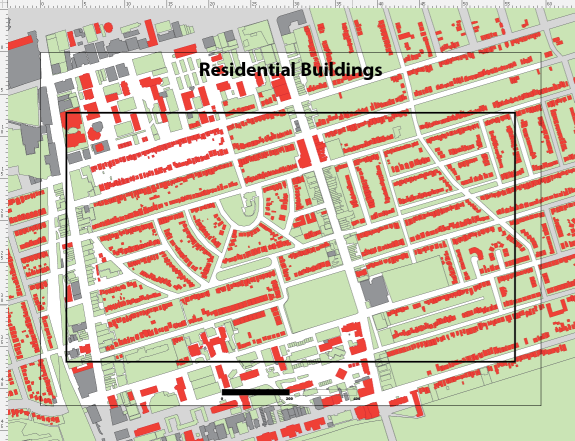
We have taken the previous example, deleted the mask and adjusted the colour of the background polygons slightly. We have also added an AOI polygon that will serve as the clipping mask extent.

Artboard extents are visible along with some data, a title, a scalebar and the clipping polygon.

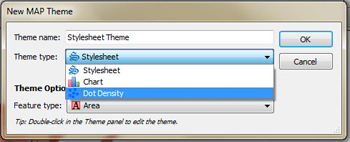
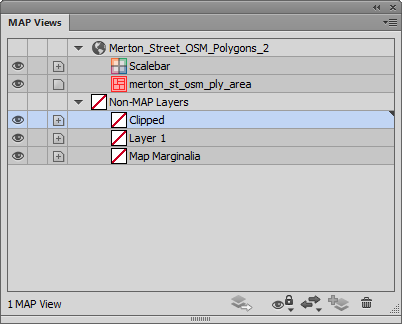
To create a clipping mask, the first thing we’ll make a new layer called Clipped. Make sure that it is a non-MAP layer (verify this in the MAP View panel).

The new Clipped layer can be seen in both the Layers panel and the MAP Views panel.

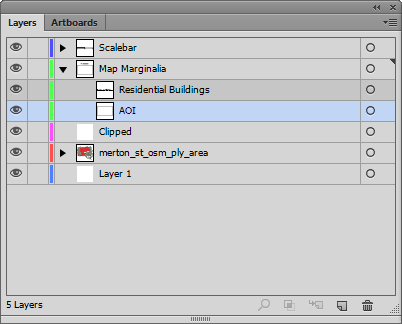
Next, drag both the AOI layer and layers that contain geographic data into the Clipped layer making sure that the AOI rectangle is above the layer holding the geographic features.

The AOI layer and the MAP Layer are added to the Clipped layer.

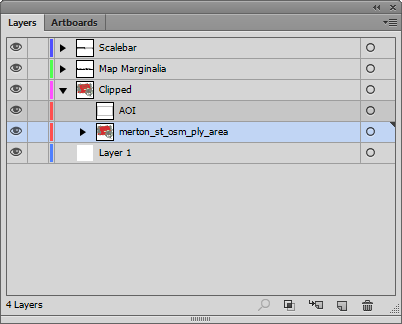
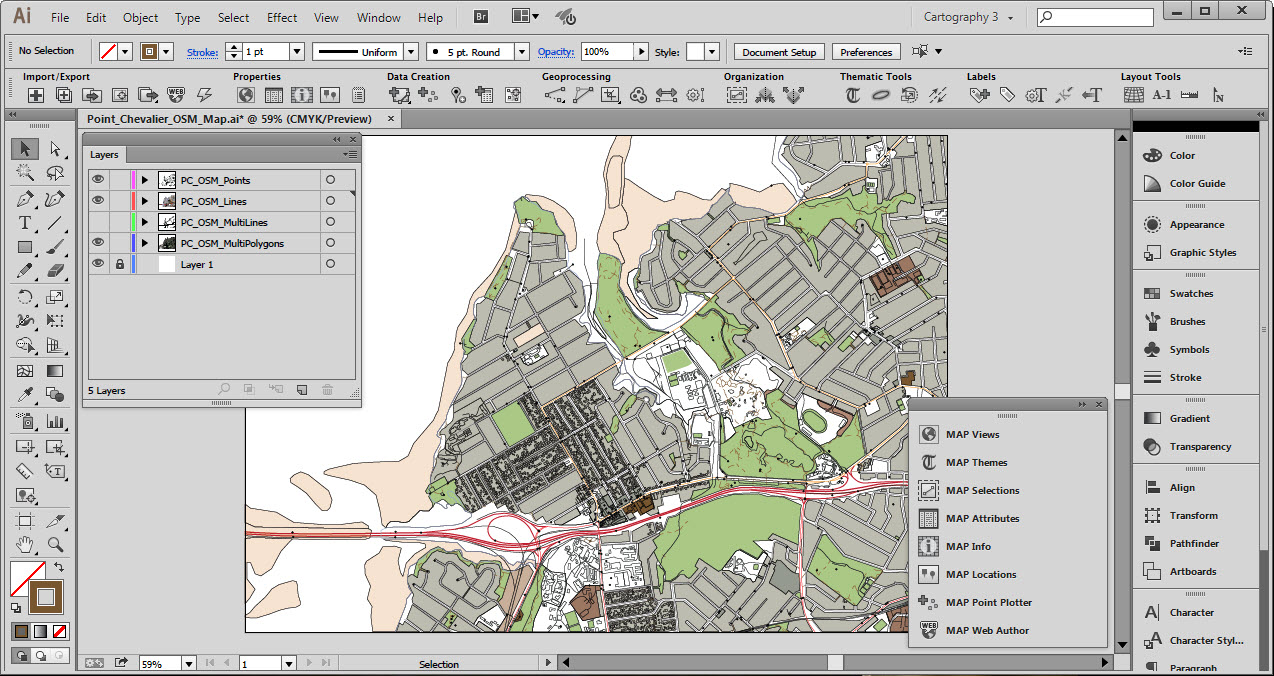
Now if we select the Clipped layer and click on the Make/Release Clipping Mask button (Second from the left at the bottom of the panel) we should see the AOI rectangle become invisible and the MAP layer is visible within the extent of this path.

The clipping path gets underlined in the Layers panel and the geographic features are clipped to its shape.

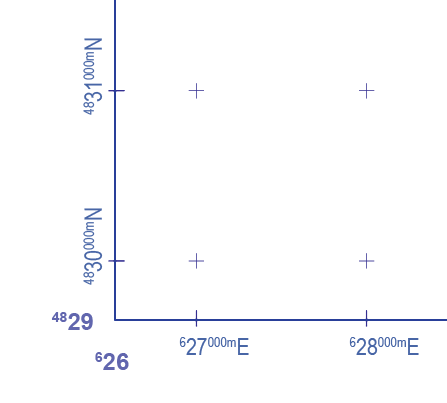
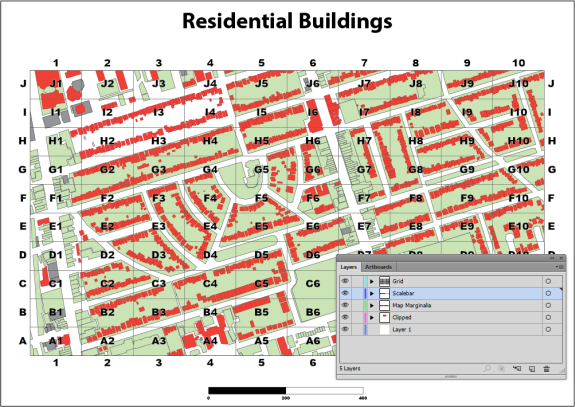
We can now add a grid over the top of the clipped area using the Grids & Graticules tool. You will find that the default extent of the grid is the same as the spatial data. You will need to resize the grid to match the clipping mask.

Index/reference grid overlaid on the map.

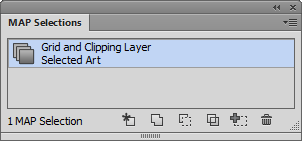
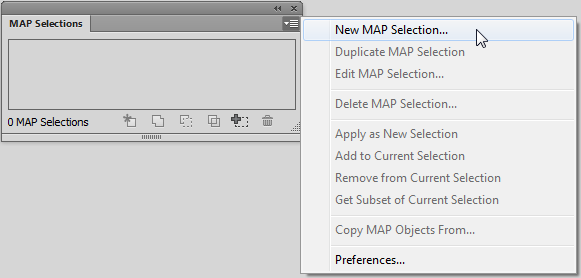
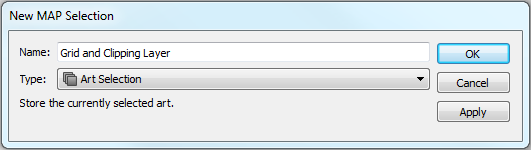
If you want to change the spatial extent of the map you have to adjust both the clipping polygon and the grid. It would be nice to group them and resize it together, but Adobe Illustrator doesn’t allow groups to span multiple layers. One way around this is to use a saved selection. To do this, select the clipping mask and the MAPublisher Grids, then choose Select | Save Selection. Give the selection a name like Grids and Clipping Mask.

Grid and Clipping Mask selected.
New MAP Selection
Art Selection

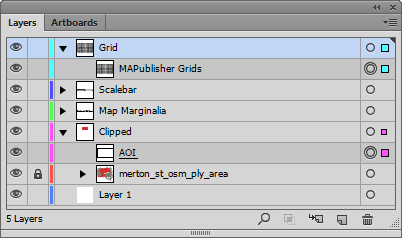
Now if you need to adjust the spatial extent of the map you can quickly choose the saved selection and resize the clipping mask and grid or move them both around the artboard simultaneously.

The saved selection can be applied by clicking the Apply as New Selection button on the left.
Map grid and clipping mask have been enlarged together. The scale has also been made smaller.

MAPublisher MAP Themes: Assign Symbology and Styles upon GIS Data Import

With MAPublisher 8.6 or higher, you can apply styles to GIS data upon import using the MAP Stylesheet Auto Assign feature.

MAP Theme Auto Assign  upon import

You will need to prepare MAP Stylesheet theme(s) and set the Auto Assign settings within every stylesheet. In this example, there is only one stylesheet.

MAP Theme Panel

In the “Edit Stylesheet Theme” window, there is a link to click next to the “Auto-assign” right below the layer option. Once you create all the rules for stylization using attribute values, click the link to open the Auto Assign Layers dialog window.

MAPublisher MAP Theme Auto Assign: link

MAPublisher will check the layer name of all the layers being imported if the Auto-Assign Layers settings are made. In this example below, one layer named “USA 2000.shp” will be imported. There may be other layers called “USA 2001.shp”, “USA 2002″…. and so on. There is a pattern in the layer name among the layers to be imported. We will specify here “Start with” for the Type, and “USA” for the Layer Name Match option.

MAPublisher MAP Theme Auto Assign

For the Type option, there are five: Equals, Start with, Ends with, Contains, and Wildcard. All my layers start with “USA” in the example above.

MAP Theme Auto Assign: Layer name pattern option

Let’s import one layer called “USA 2000.shp” (you can import mutiple layers at once, of course).

Importing a shapefile for an example

If the Adobe Illustrator document has this Auto-assign setting ready, MAPublisher will detect it and it will give you an option whether or not you would like to apply the styles to the layer(s) being imported. We’ll click the first option “Apply MAP Themes to imported layers now”.

MAP Theme Auto Assign window upon import

As a result as shown on the very top screencapture image, every polygon in the layer “USA 2000.shp” is stylized with the rules available in the MAP Stylesheet theme upon import.

MAPublisher: Enhanced Grids and Graticules Allows You to Share Grid Settings

If you haven’t noticed yet, we released an enhanced version of the Grid and Graticules tool (MAPublisher 8.7 and higher). With the new Grid and Graticules tool, you will find that you can export grid settings and save them. Most importantly, these grid settings files can be shared and imported to another document.

Once a grid is created, save the settings to a *.cfg file. Two configuration files are created per grid: grid settings and label settings.

settings files for grid and graticules

Grid settings configuration files store information for all related grid options (e.g. ticks, intervals, offsets, borders). Label settings configuration files store information for all related label options (e.g. axis labels, fonts, styles), even for multiple grids. Label settings are saved with _labelData suffixed to the file name.

Share the files and load the *.cfg file in the Grid and Graticules dialog box.

exchanging the settings for grid and graticules

Some of the major functions of the new Grid and Graticules tool are adding tick marks along border lines, placing cross hair symbol instead of lines for grid/graticule lines, styling lines and text more flexibly, and having more label options available. You can share the settings by exporting one and importing to another document as well. You can make a set of grid lines looking like this below.


A basic example of grid lines

MAPublisher FME Auto: File Automation from FME Workbench to Adobe Illustrator

MAPublisher FME Auto

Do you use FME Workbench in your workflow and produce cartographic products with MAPublisher for Adobe Illustrator? Would you like to automate the data import process to MAPublisher after preprocessing the data with FME workbench? If so, you might be interested in our new add-on product MAPublisher FME Auto.

MAPublisher FME Auto was introduced with MAPublisher 8.6

FME is a powerful software that you can open many GIS formats and transform data including reprojection and geometry operations. Once you complete the data processing with FME Workbench, you can bring those processed data into Adobe Illustrator. Furthermore, you can automate this process from FME Workbench to MAPublisher with FME Workbench file (*.fmw).


System Requirements:

  • Adobe Illustrator with MAPublisher 8.6 or higher
  • FME Workbench 2011 SP3 or later
    • for 32 bit
    • for 64 bit FME Workbench, you will have two choices:
      • install both FME 64 bit and FME 32bit on your computer
      • install FME re-distributable available from our download page
  • valid license for
    • FME
    • MAPublisher 8.6 or higher and MAPublisher FME Auto


More information:


In a future post we will look into greater detail about the MAPublisher FME Auto workflow.

Sell Your Maps Digitally to Mobile Devices

As we have all seen over the last decade, the distribution and consumption of music, videos and books has moved to a digital model and so, the question then becomes, why not maps? Similarly to the aforementioned media types, maps are also very conducive to both the distribution and use in a digital and mobile way. As we see organizations like Borders, Blockbuster and Kodak succumb to this digital revolution, we map-makers must adapt or suffer a similar fate.

Many of you may be struggling with the issue of selling your maps digitally, tackling the question of the “mobilization” of your content and wondering how to attack the new markets.

But what if there were a generic iTunes/iBooks/Kindle type environment where a map publisher, like many of you reading this, could offer their maps for sale just like musicians and book publishers currently do with their songs and books? There is and it’s called the Avenza Map Store, accessible through the PDF Maps app.

Right now, the Avenza Map Store has more than 100,000 maps from publishers all over the world and we are looking for more as we strive to become the “iTunes of maps”. Map sales in January have already more than doubled December in terms of both units and dollars and December was higher than previous months already.

Signing up to become a map store vendor is free. We encourage and invite everyone to do so.

So here is the gist of the system and the thinking behind it.


What is PDF Maps?

The award winning PDF Maps app is an all-encompassing solution for the use, distribution, and sale of digital versions of paper maps to mobile devices. It includes both an app for users to use, discover and purchase maps directly using their devices as well as an in-app store to facilitate the transaction and delivery of the maps.

Think of it like iTunes, iBooks or Kindle, but for maps.

The app loads georeferenced maps and has functionality for locating (via GPS), measuring, plotting points, importing and exporting points and much more, this goes well beyond traditional paper map usage.


Why PDF Maps? What are the advantages?

The PDF Maps app and the connected map store responds to the demand of both map users and map producers for a 21st century digital map consumption and delivery solution. In an era where a vast amount of content is shifting from analog to digital delivery and use, the map industry demands a similar solution for its users and producers.

For the user it solves four major problems:

  1. How can I use a map I really like on my mobile device instead of the often less-desirable ones Google and other streaming services offer?
  2. Google and other streaming services fail to perform when there is no Internet connection such as when hiking or traveling in remote unconnected areas.
  3. Services that rely on a bandwidth connection are very undesirable when outside your home network area due to the high cost of data roaming charges.
  4. Google and other streaming services, as well as many existing mobile apps, do not always offer a useful map for a particular purpose such as hiking, boating, and visiting national parks which leaves much desire for a “better” map.


For publishers it responds to the following specific needs:

  1. With paper map sales declining, how can I get my content into the digital age for the mobile device market?
  2. Devices like Garmins, TomToms and in-car navigation systems are usually closed to outside map content and thus map producers cannot easily, if at all, make their maps available to users of these systems.
  3. In an effort to get into the digital marketplace it has to be easy, efficient, and inexpensive to repurpose existing content and map libraries. In most cases existing map libraries can be easily ported to the PDF Maps system and existing production processes do not need to be drastically modified, if at all, in order to produce new content for PDF Maps and the Avenza Map Store
  4. With digital map use there is no printing, production quantity guesswork, inventory to manage, distribution and returns to account for.
  5. Updates to the maps are controlled by the vendor and can be instantly made available to the marketplace, while at the same time, older redundant content can be instantly removed and discontinued.
  6. Immediate, easy and effortless entry into the digital map marketplace.


Available now for iOS. For more info visit PDF Maps site and the Avenza Map Store site.

Hope to see your content in the map store soon.

How to get Open Street Map data into Adobe Illustrator with MAPublisher

Edit: Updated with a new QGIS workflow (November 21, 2014)

The following tip is courtesy of Hans van der Maarel of Red Geographics.

————-

For many areas on Earth, OpenStreetMap is a viable alternative to commercially offered data sources. However, it is not always easy to process. This blog tutorial explains the steps needed to load OpenStreetMap data into MAPublisher.

1. Download and install QGIS, this is a free GIS application, available for Windows, Mac and Linux computers. QGIS now comes with built in tools for downloading Open Street Map Data.

2. Open QGIS and zoom in to an area of interest. Use the OpenLayers plugin for a basemap if you do not have any imagery or mapping of your own. Keep in mind that downloads from the OpenStreetMap website are limited in the number of exported objects, so for larger areas you will have to combine multiple downloads yourself, or look for other options (for example Geofabrik).

Bing Basemap

3a. Go to the Vector Menu and Choose OpenStreetMap and then Download data.

OSM Download Menu

3b. Choose how you want the extent of the downloaded data to be defined. The easiest way is to use the Map Canvas.

OSM Download Dialogue

4. Open your downloaded .osm file in QGis using the Add Vector Layer tool. Select all the Layers and choose OK.

Select vector layers to add

This results are shown in several layers depending upon what is present in the extent you have downloaded. In this case there are points, lines, multilinestrings and multipolygons. Note that QGIS only imports features that fall completely within the extent specified. So make sure you choose an area larger than your actual area of interest to ensure it is completely covered.

OSM layers loaded in QGIS

5. Export these layers one by one. Right-click and choose “Save As, then ESRI shapefile”.

Save Points to Shapefile

6. The shapefiles can be imported into Adobe Illustrator using MAPublisher. After reprojecting, scaling and cropping we’ve ended up with the raw OpenStreetMap vectors in Adobe Illustrator, with all attributes still maintained.

OSM Layers loaded in MAPublisher

7. Once within the data is imported successfully, you may now use any of the MAPublisher and Adobe Illustrator tools to style and customize the map in any way you want.

OSM Layers loaded and themed in MAPublisher


MAPublisher Dot Density Maps

Dot density themes are sometimes called dot distribution maps because they show where particular data characteristics occur. It uses dots or other symbols to represent the number of occurrences of a given data characteristic in a particular location. Starting at MAPublisher 8.4, the ability to create dot density maps is available through the provision of Dot Density Themes.

When creating a new MAP Theme simply choose “Dot Density” from the available theme types. The creation of a dot density theme is facilitated through the MAP Themes panel. The dot density theme is an Adobe Illustrator effect applied to an area layer.

Item 2: Coordinate system of the map

As dot density maps are most useful for showing where particular data occur, they may only be generated for MAP Area type layers. Most often, symbols are used to represent data occurring within a bounding polygon such as a census tract, zip code or county polygons.

Item 2: Coordinate system of the map

Dot density effects are created on a per layer basis, based on various user defined settings. Data ranges can be determined from selected attribute columns and then a dot value can be assigned a corresponding symbol at which point MAPublisher will map the appropriate results. Users may apply default symbols or load custom ones based on Illustrator symbol sets

In this example, population tallies per county have been loaded, assigned a dot value of 10,000 with a designated symbol of a 2pt black dot.

This screenshot displays the map prior to applying the dot density effect.

Item 2: Coordinate system of the map

The screenshot below displays the map after having applied the Dot Density Theme using the parameters displayed within the dialog .

Item 2: Coordinate system of the map

University of Montana Student Map Submissions

MAPublisher is popular with educators and students because, in no time at all, new users can begin to create great looking maps. Working seamlessly with the Adobe Illustrator environment, users can spend more time on map details and less time fighting with complicated importers and data format conversions.

Avenza Systems Inc. recently received student work submitted by the Univeristy of Montana’s Digital Design course. These maps show some excellent terrain shading, good colour choices, and a knack for making complex cartographic detail legible.

We wish to thank the students for generously allowing us to distribute their work, and we wish them luck in their upcoming mapping endeavours.

Click the maps to load high-resolution versions.

Buffalo Bill State Park Wyoming

by: Nathan TaylorBuffalo Bill smaller


Crown of the Continent

by: Nathan BaldingCrown of the Continent smaller


Lolo Pass Recreational Trails

by: Hal Bobbitt Lolo Pass Recreational Trails

News Archive