A teacher by day and a cartographer by night, Thorfinn Tait (a native of Scotland) has been teaching high school in Japan for almost 20 years while making maps of fantasy lands in his spare time.
Mapping is a hobby for Tait, and his deep love of atlases, along with fantasy role-playing games (known as RPGs), helped drive him towards creating his own maps of fantasy worlds. He started in 2005, making maps in Adobe Illustrator. His goal was to create an atlas of a fantasy world, that included the same variety of maps that you’d find in any traditional world atlas — topographical, political, thematic — along with all the tables of data typically found in an atlas. He chose to map the world of Mystara, a popular Dungeons & Dragons (D&D) campaign setting from the 80s and 90s.
Tait set out to compile all of the original maps of Mystara (more than 250 of them) into a cohesive whole. “One of my biggest struggles was trying to work out what projection Mystara’s maps used. But there was a fundamental disconnect for me in that Illustrator alone did not have the functions I needed,” says Tait. “For example, to change the projection of a map, I tried to use it in tandem with other GIS software, but it was very troublesome having to constantly import and export elements between programs.”
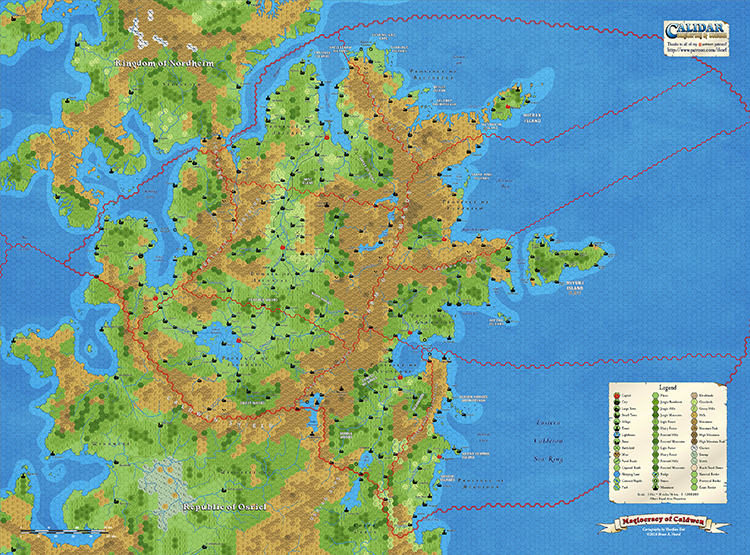
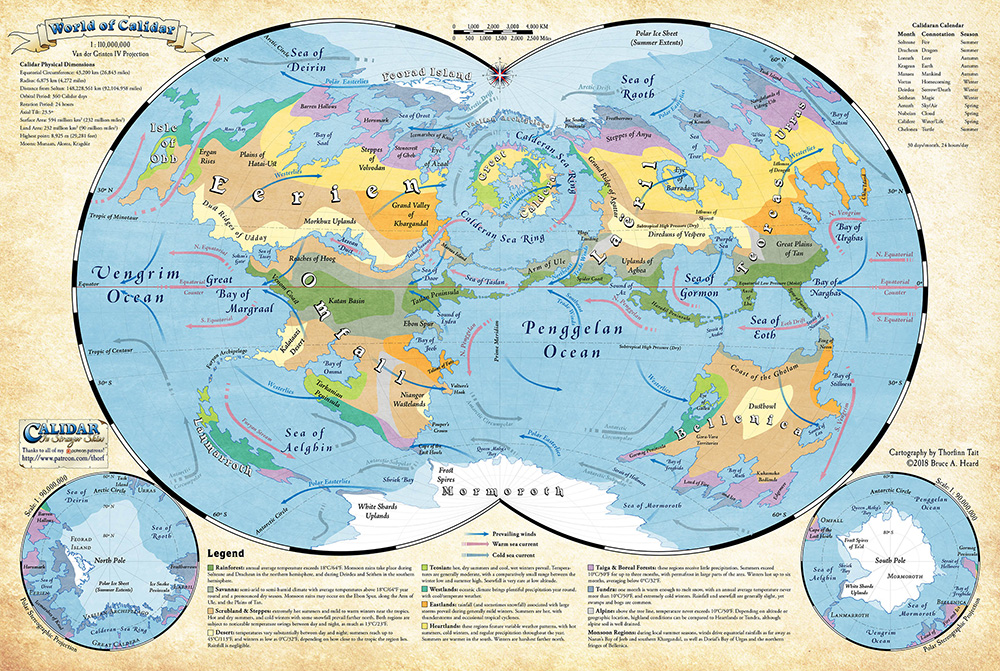
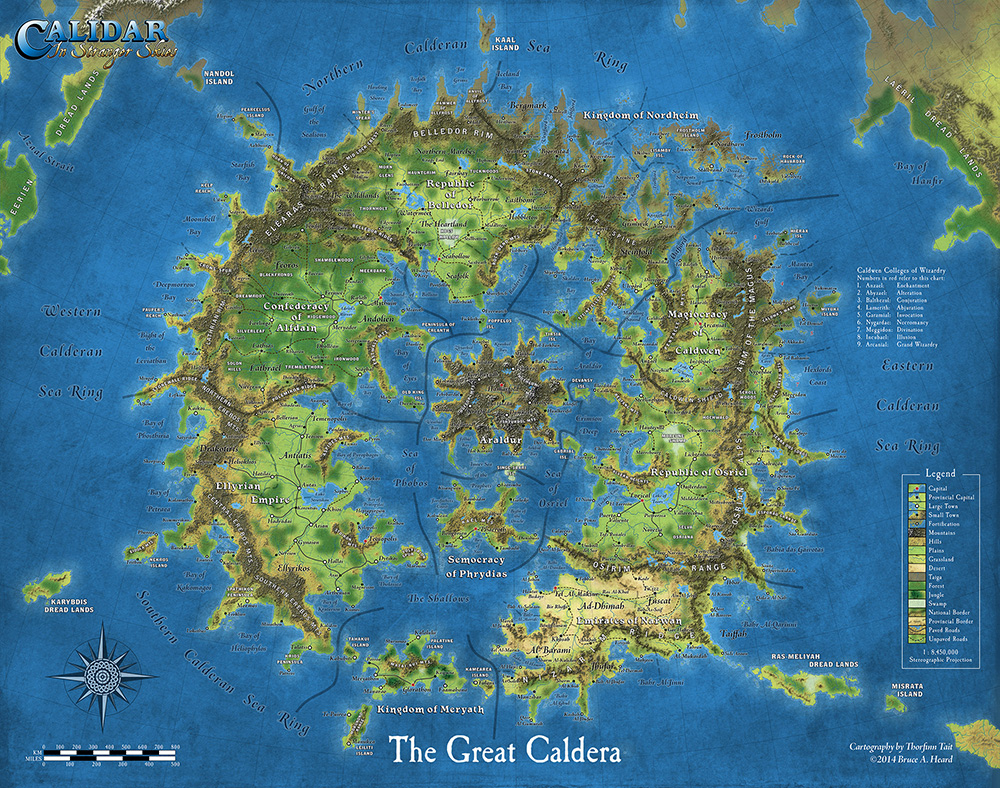
While working on the Atlas of Mystara project, an original Mystara author made a return to the industry, and Tait volunteered to remake his maps in Illustrator. The year after, that same author commissioned Tait to map a new RPG world, the World of Calidar. Determined to avoid the same problems he’d encountered with Mystara, he began establishing dimensions of the new world and creating custom projections based on them. But, working between Adobe Illustrator, Adobe Photoshop and GIS software was still very complicated.
“I managed to complete the first assignment with just those tools, but as soon as I got my first commission, I invested it right back into my maps by purchasing MAPublisher and Geographic Imager.” With MAPublisher, a plug-in for Adobe Illustrator and Geographic Imager, a plug-in for Adobe Photoshop, Tait could work natively in both Illustrator and Photoshop.
“My favourite aspect of MAPublisher is without a doubt the custom coordinate system. It allows me to create resources for fantasy worlds just like they already exist for the real world, and then repurpose them across all of my maps,” says Tait. He also uses MAP Attributes and adds data to the world’s geography. “For example, it’s easy for me to track things like road and river lengths, land areas, dimensions of coastlines and political borders, and so on — MAPublisher calculates all of these things for me automatically.”
MAPublisher has allowed Tait to take his previous work and convert it to the newly established custom coordinate systems, without losing any of the GIS attributes he’d created over previous years. Tait also uses Geographic Imager to create Digital Elevation Models (DEMs) for the World of Calidar. DEMs can help bring maps to life, adding an intricate level of detail and depth.
Tait’s tagline for his freelance business is “Mapping fantastic worlds with real-world accuracy”. “I couldn’t do this without MAPublisher and Geographic Imager,” he says. “The software allows me to create and work with data for a fantasy world just like other people map the real world, the only difference is that I am creating all the data myself!”
“MAPublisher has truly expanded my horizons as a cartographer and has also changed the course of my projects. Without it, my current work would simply not be practical — in fact, probably not possible at all.”
Tait is currently working on georeferencing existing Mystara maps and tagging elements with their original sources. Check out more of his mapping projects on his website!
In a previous blog post, we defined a few common cartography terms that you might be likely to encounter while using MAPublisher and Geographic Imager; however, that was just the tip of the iceberg when it comes to cartography and GIS jargon. Here, in no particular order, are several additional terms used by cartographers, GIS professionals and people who work with spatial imagery.
Topology
Topology is a key principle in GIS for data management and integrity, ensuring the data quality of spatial relationships is maintained. In general, a topological data model defines how spatial objects (point, line, and area features) are represented, and defines and enforces data integrity rules (for example, there should be no gaps between polygons).
Azimuth
The horizontal angle, measured in degrees, between a baseline drawn from a center point and another line drawn from the same point. Normally, the baseline points true north and the angle is measured clockwise from the baseline.
Neatline
All 2-dimensionally rendered maps have to compromise somewhat on accuracy, even if only just a little by moving or scaling features to improve readability. However, the neatline is never adjusted, making it the most accurate element on a map.
The neatline is the border defining the extent of geographic data on a map and separating the body of the map from the map margin. It demarcates map units such as meridians and parallels, and depending on the map projection and the units selected, the neatline may not have 90-degree corners.
Geodatabase
A Geodatabase, a database or file structure used primarily to store, query, and manipulate spatial data,stores geometry, a spatial reference system, attributes, and behavioral rules for data. An advantage of geodatabases over shapefiles is that various types of geographic datasets can be collected within a geodatabase, including feature classes, attribute tables, raster datasets, network datasets, topologies, and many others.
Geoprocessing
Geoprocessing is an operation used to manipulate a GIS data resulting in a new set of data. Common geoprocessing operations include geographic feature overlay, feature selection and analysis, topology processing, raster processing, and data conversion. Geoprocessing allows for the definition, management, and analysis of information used to make decisions based on patterns within the GIS data.
Shapefile
An Esri Shapefile is a vector data storage format for storing the location, shape, and attributes of geographic features. A shapefile is stored as a set of related files and contains one feature class. An alternative to using shapefiles to store GIS data is a geodatabase, however, shapefiles have some advantages in terms of relative simplicity and wide-ranging compatibility with many applications. Related files contain additional information that is read by the shapefile when opening/importing in GIS applications, as long as these related files have the same name and reside in the same directory – the *.dbf (database) file contains attribute information, and the *.prj (projection) file contains coordinate system information. Shapefiles also have limitations such as the inability to support raster files, and large file sizes.
Buffer
A zone around a map feature measured in units of distance or time is called a buffer. Buffers are useful for proximity analysis.
Geodesy
Geodesy is the science concerned with the measurement and mathematical description of the size and shape of the earth and its gravitational fields. Geodesy includes the large-scale, extended surveys for determining positions and elevations of points, in which the size and shape of the earth must be taken into account to achieve accuracy.
Vector vs Raster
The terms vector and raster are encountered often in cartography though they are not often defined. In a nutshell,
Raster data is made up of pixels (sometimes referred to as grid cells). Each pixel can have a range of values used to represent data points. For example, in a satellite image, every pixel has a red, green and blue value.
Vector data is not made up of a grid of pixels. Instead, vector graphics are comprised of vertices and paths where the vertices are x,y coordinates. In GIS systems, they are a latitude and longitude with a spatial reference frame.
Mosaic
A Mosaic is a single raster dataset composed of two or more merged raster datasets—for example, one image can be created by assembling multiple aerial photographs whose edges usually have been torn or cut selectively and matched to the imagery on adjoining images to form a continuous representation of a portion of the Earth’s surface.
Orthorectification
The process of correcting the geometry of an image so that it appears as though each pixel were acquired from directly overhead. Orthorectification is used to correct terrain distortion in aerial or satellite imagery.
Alison DeGraff Ollivierre caught the geo/carto-bug from an introductory geography course in her first semester at Middlebury College, quickly realizing that the discipline was the perfect combination of her diverse interests in global affairs, conservation, history, and sociology. Now a cartographer at National Geographic Maps, Ollivierre works on the Trails Illustrated topographic outdoor recreation map products from an office in Colorado, making it easy for her to always be planning her next hike or trip to a National Park.
Ollivierre began her professional career as a Geography Intern at National Geographic in 2011, working with NatGeo Live and the Giant Traveling Maps. During her internship, she had the opportunity to make maps for a few NatGeo Explorer lectures and Giant Traveling Map fact cards, but what really stuck with her was how the incredible breadth of geography was used every day at NatGeo (and meeting Sylvia Earle—she thought that was pretty cool!). Since then she has gone on to win multiple awards for her cartography and was recently recognized by xyHt Magazine as a 40 Under 40 Remarkable Geospatial Professional for 2018.
As a certified GIS Professional, with a master’s degree in Geoinformatics from the University of the West Indies, Ollivierre knows geospatial data and how to handle it but also understands that—while the data is important—there is more that goes into making a good map than just the data. ‘I believe strongly in the importance of great design.’ explains Ollivierre. ‘It has the power to make geospatial data more engaging, interesting, and accessible to its audience.’
Ollivierre started using MAPublisher—a cartography plug-in for Adobe Illustrator—in 2016 when she returned to work at NatGeo after facilitating a participatory mapping project in the Eastern Caribbean, working as a cartographer and GIS specialist in Maine, and conducting freelance cartographic work for organizations across the globe. ‘I had played briefly around with a trial version of MAPublisher before that and heard a lot of great things about the software, so I was excited to learn how to use it at NatGeo Maps.’ says Ollivierre. ‘We complete 99% of our daily tasks in Illustrator + MAPublisher so its power is clearly evident in our workflow.’
Making quality maps that bring to life complex geospatial data requires a mix of science, art, and specialized tools to get it right. ‘I love the process of turning raw data into a map that clearly (and attractively!) gets its point across.’ says Ollivierre. ‘For me, MAPublisher is the obvious choice to bridge that gap between GIS and cartography.’
The field of cartography is filled with jargon and terminology that can pose a challenge for newcomers learning to use mapping software such as MAPublisher to make beautiful maps, and those who don’t have a formal background in cartography. It also doesn’t make it easier when different software packages have their own variations on certain terms. To help the cause, we have compiled a short list of common cartography terms or “carto-jargon” that you may encounter while using MAPublisher or Geographic Imager.
Basemap
A basemap is a background image which can include aerial imagery, topography, terrain and streets and other fundamental layers and is used as a starting point to create a new map. The basemap is georeferenced and is usually the most accurate source of spatial information within the data system that makes up the finished map. Additional layers of data such as labels, symbols and paths are then added to the basemap to create the final product.
Feature
Any real-world object that is represented on a map is a feature. Features can encompass large areas of a map, such as bodies of water and mountain ranges, or they can be discreet objects like parking areas, public washrooms or fire hydrants.
Attribute
Attribute data is information about spatial features and is stored in tables. It is also the information that specifies the appearance and labeling of features on a map. For example, the graphic attributes of a river might include the thickness of the line, line length, color, and the name used for labeling.
Control Point
A control point is a location on the map with known pixel (x,y) coordinates. Control points are used in georeferencing to allow for extrapolation of the relative location of other points whose exact coordinates may not be known.
Coordinate System
A coordinate system is a reference system used to represent the locations of geographic features on a map. It provides the basis for identifying locations on the earth’s surface. There are thousands of different coordinate systems, most of which are limited in use to highly specialized purposes.
Projection
The earth is not flat and so imagining that it is for the purpose of putting it on a 2-dimensional map results in some distortion. A projection is a method by which the curved surface of the earth is portrayed on a flat surface and is based on a mathematical transformation of the earth’s lines of longitude and latitude onto a plane. There are many different projections, each of which distorts distance, area, shape, and direction is some way, therefore no projection can result in a perfectly accurate flat map. Check out theAvenza Projections Guide for a more detailed information.
Georeferencing
Georeferencing involves aligning geographic data to a known coordinate system so it can be viewed, queried, and analyzed relative to other geographic data on the same map. Georeferencing may involve shifting, rotating, scaling, skewing, and in some cases warping, rubber sheeting, or orthorectifying the data to improve accuracy.
Graticules and grids
Graticules are the network of longitude and latitude lines on a map or chart that relates points on a map to their true locations on the earth. You can think of this a grid system – in fact, the terms are sometimes used interchangeably, but there is a subtle difference. Graticules are derived from 3-dimensional ellipsoidal shape of the earth and are formed by the the lines of latitude (parallel lines circling the earth), and lines of longitude (non-parallel lines converging at the earth’s poles). A grid system is comprised of a set of parallel and perpendicular lines that are superimposed on a flat projection of the earth, creating an x,y coordinate system. An example of a grid system is the Universal Transverse Mercator (UTM) system.
Themes
In MAPublisher, MAP Themes are a collection of thematic cartography tools designed to automate how styles and symbols are applied, charts are produced, and data is plotted. There are three themes which you can be customized to suit your needs: Stylesheet, Chart, and Dot Density. MAP Themes offer a lot of flexibility as they can be edited, applied, duplicated, automated, exported, and cleared without affecting the spatial referencing of map features.
This is just a small sampling of the more robust glossary of terms available in the ourMAPublisher andGeographic Imager documentation packages.
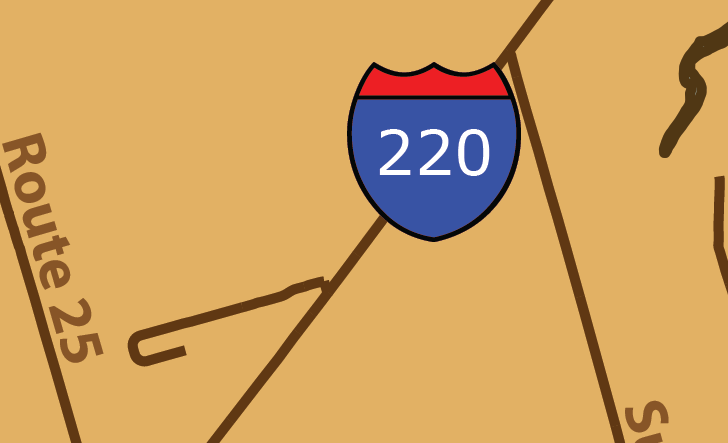
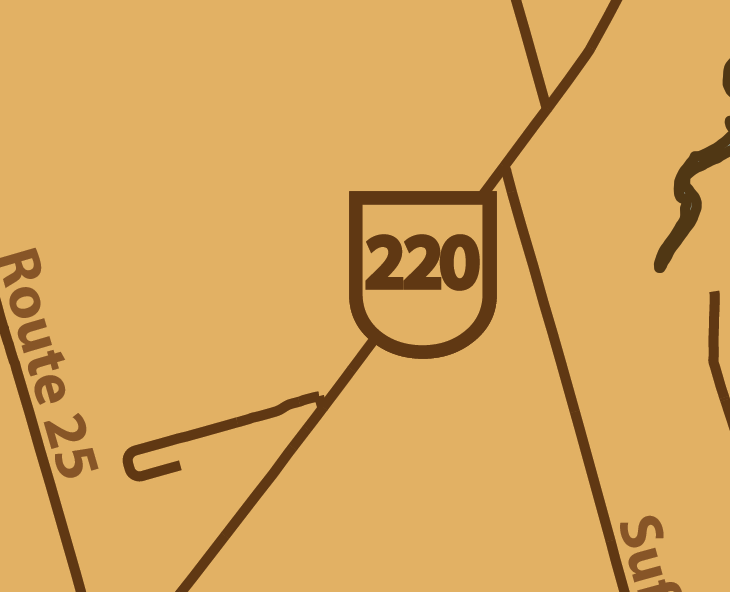
MAPublisher LabelPro intelligently labels your map layers using custom rules and styles. One of the popular uses of this feature is to create highway shields. The result is a cleaner map and is widely used on road maps around the world. While MAPublisher has many default options for highway shields, it is possible to create custom shields to improve your map as well. This blog will outline the steps to create and customize highway shields for your map.
Step One
Import your data into MAPublisher, ensuring your road line data has an attribute field for highway route numbers. Highway shields can work with any data type, however, traditional highway shields are created with a highway number with no additional characters. Using the integer data type enforces this and is recommended for highway shields.
Step Two
On the MAPublisher toolbar, in the Labels subsection, click the MAP LabelPro button.
Step Three
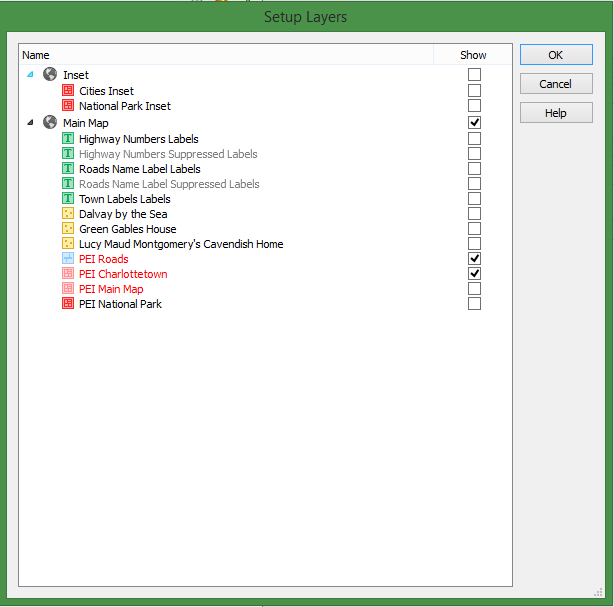
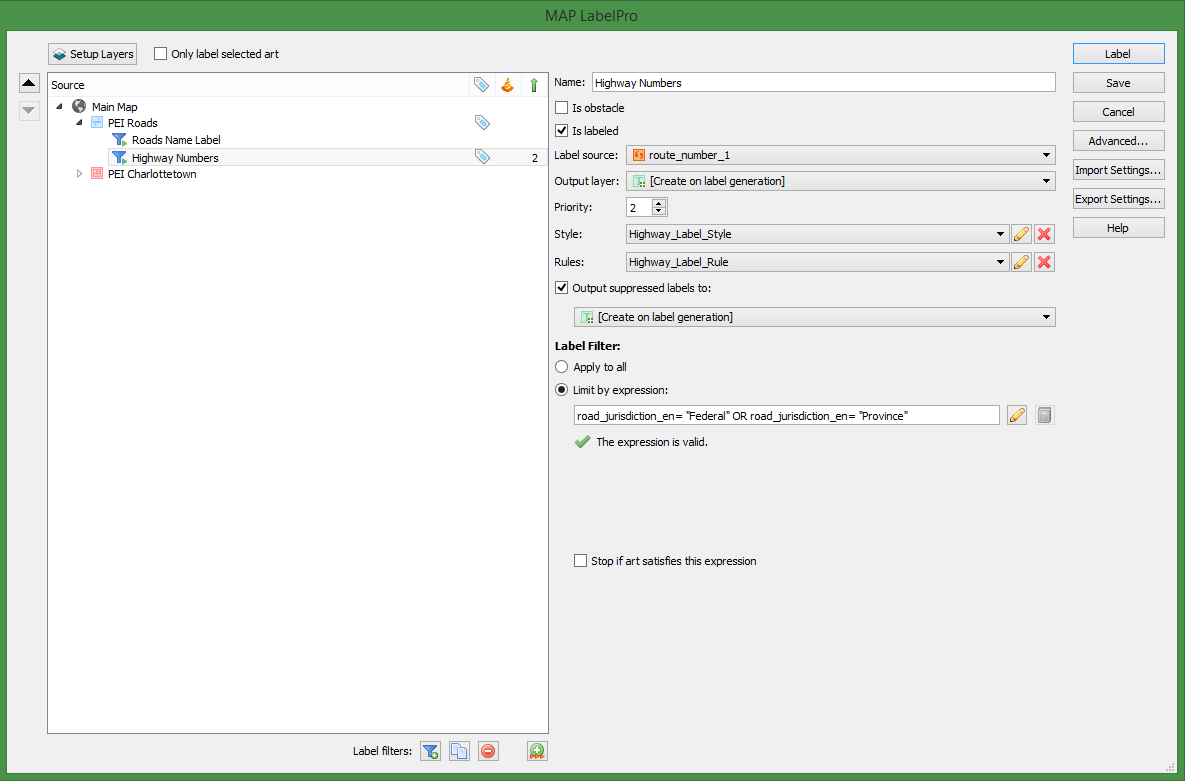
On the MAP LabelPro dialog box, click the Setup Layers button. This allows you to select which layers are going to be labeled or used as obstacles. This means you can label multiple features at the same time as the highway shields. Click the checkbox next to your roads layer and click OK.
Step Four
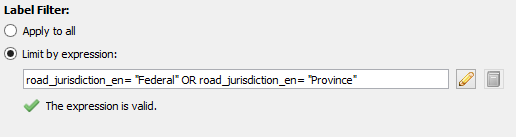
Optionally, you may want to only create highway shields on some of the roads within your road layer. For example, if your roads layer also contains roads that are not highways, you don’t want them labelled with a highway shield. The solution is to create a Label Filter. To do this, first create a new filter by clicking Add label filter button at the bottom of the dialog box. Next, in the Label Filter section, select Limit by expression and click the Edit icon. This opens the Expression Builder dialog box. In this example, the expression entered selects only roads that have a jurisdiction designated as “Federal” or “Province”. Only these roads will be labelled with a highway shield.
Step Five
If you didn’t create a label filter, click the layer in the Source list you would like to label. On the right side, ensure that the “Is labeled” checkbox is checked. Immediately below, in the Label Source drop-down, select the field that contains the highway route numbers.
Step Six
Select or create a rule from the Rules drop-down. The pre-defined Highways and Interstate rules that are included with MAPublisher follow conventional mapping patterns, but if you want to customize the setup of your shields, click the Edit button. Once you are satisfied with your rules, click OK to return to the MAP LabelPro dialog box.
Step Seven
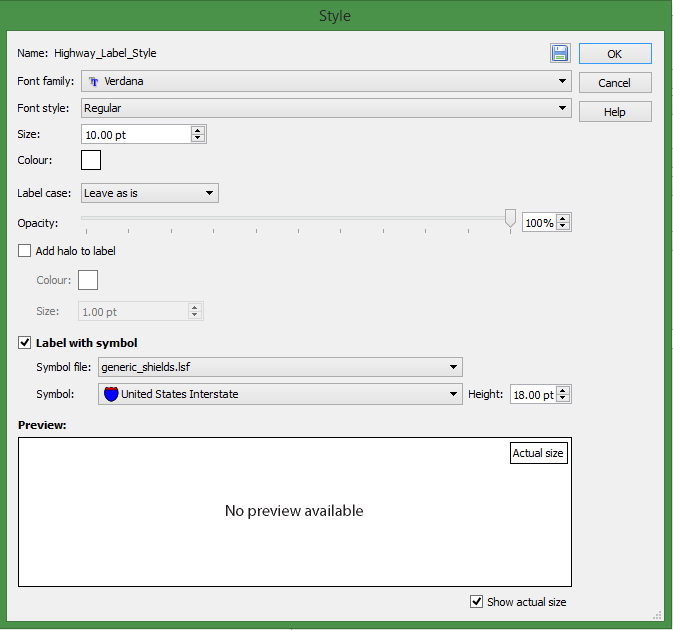
To customize the appearance of the shields, click the Edit button beside the Style drop-down. To add highway shields, click the Label with symbol check box to enable its settings. The Symbol file is the shield library, where you can pick between Canadian, US State and generic shields. The Symbol drop-down is where you can pick the shield from the shield library specified. All shields will have the same symbol, if you want multiple shield shapes on your map, you’ll have to create label filters as outlined previously in step four. The Font family, Font Style, Size, Colour and Label case affect the appearance of the text within the shield. Click OK when finished setting the style.
Step Eight
Back in the MAP LabelPro main dialog box, click the “Output suppressed labels to” check box. This moves all excess labels such as duplicate shields or shields that clash with other features on your map to a Suppressed layer. You can view features on the Suppressed layer after to see which labels were not included and you can decide to keep or delete them.
Step Nine
Click Label to begin the labeling process.
Step Ten
When all of your shields are generated, you can do some additional customization. In the Illustrator Layers panel, select all of your shields. From here, any changes to the colour, stroke colour and other settings you would use on objects, will be applied to your shields. With this functionality, you can create the exact shields you want for your map.
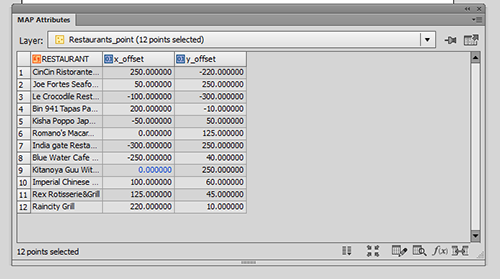
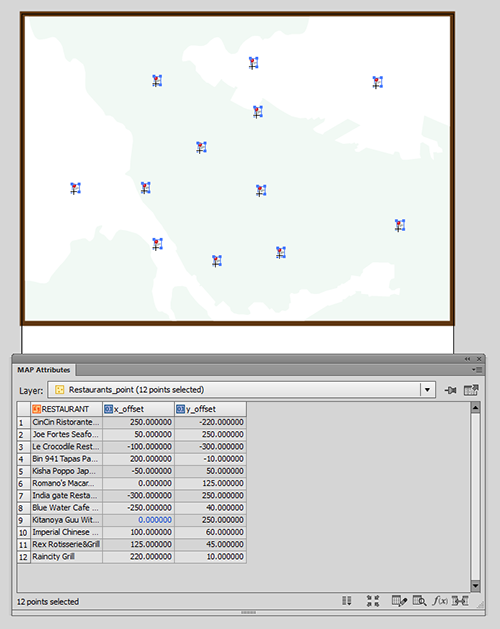
Having introduced some background information about text insertion point coordinate values in a previous post, it would be good to explore if this method works when trying to place text objects (annotations/labels) with a specific offset value. For example, if you have a point layer and there is an attribute for the offset value so that every object has a different offset value.
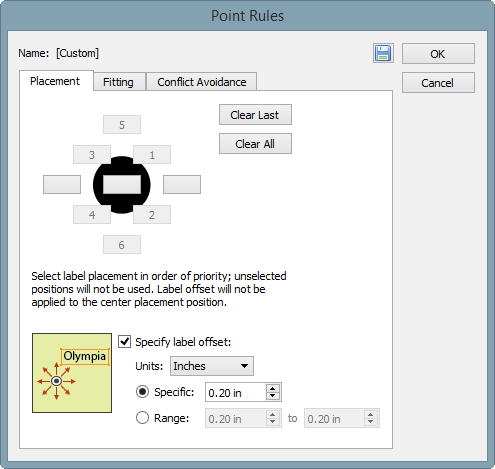
Placing text objects with a specific offset is possible in MAP LabelPro. You can specify the Label Offset value in the MAP LabelPro dialog box. However, this setting will be applied to all text labels. In the example below (see screenshot), all the text will be placed 0.2 inches away from the object. However, that does not help when every point has different offset value like this example. Also, MAP LabelPro uses page units, not the world/map units. In this example, the offset distance was specified in the world/map unit (metres).
There are two methods you can accomplish to make the text placed with offset value. The first method is the same as the step shown above. You can adjust the text placement position by calculating the “ideal” coordinate for the text insertion point. From a MAP layer (point, line, or area), generate text with a MAPublisher feature (MAP LabelPro or Feature Label). Then adjust the text position (maybe you will have to calculate a new position by adding/subtracting the offset values from the current point), then apply it to #MapX and #MapY. The second method is to adjust the position of the points first before labeling.
In the example below, a point layer with offset values in the attribute: x_Offset and y_Offset.
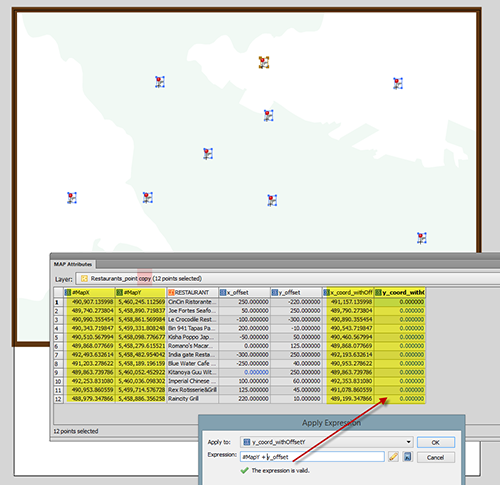
Step 1: Calculate coordinates with offset.
Create a copy of the layer just because the point value will be adjusted.
Make the #MapX and #MapY visible (so that it’s easy to see when calculating).
Create new columns (here we created “x+coord_withOffsetX” and “y+coord_withOffsetY”).
Calculate the new coordinate of the points for X and Y (here we used Apply Expression) as shown below.
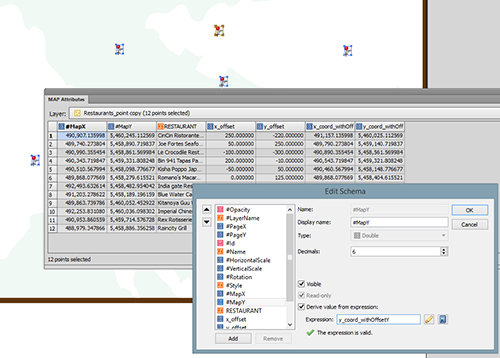
Step 2: Move the points to the calculated coordinates with the offset values.
Use the same method as the one introduced in the previous post. This method works for the Point layer as well. Open the Edit Schema window and apply “x_coord_withOffset” and “y_coord_withOffset” to #MapX and #MapY, respectively.
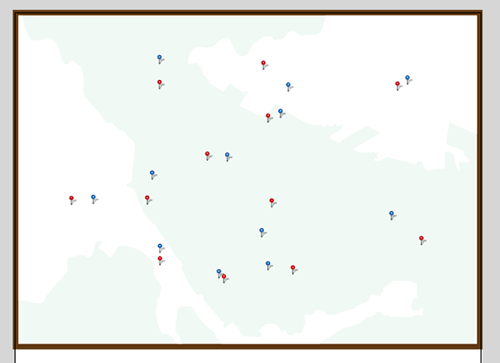
Now, the points are moved to new position. The red point is the original and the blue points are the ones moved to the offset. Now you can label each points. After placing labels for the point layer (blue), you can make the point layer invisible.
Now you can run the label engine (MAP LabelPro / Label Feature) for the new point layer with offset.
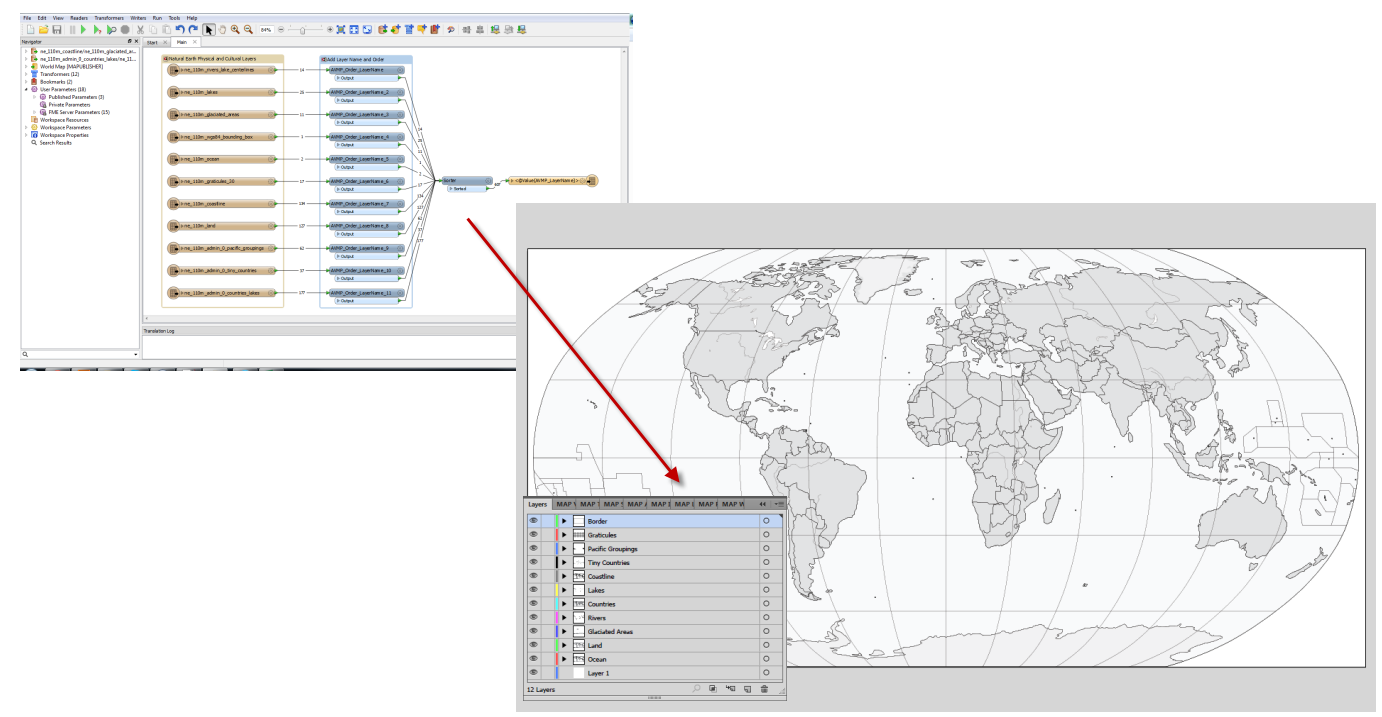
In this blog post we’ll look at how you can control the order of layers in MAPublisher when using FME Auto.
FME Auto to MAPublisher
FME currently doesn’t provide a way to explicitly define the output order of Feature Types in a workspace. In the Navigator you can reorder Readers and Writers to control the order in which they are run, but unfortunately you cannot do the same with the Feature Types they read and write respectively.
By default when you write layers to MAPublisher from FME using FME Auto, the layers are arranged first by geometry (text first, then Points, Lines, Polygons and lastly Images), then alphabetically by layer name. This behaviour can be changed by unchecking the FME Auto Parameter “Sort Layers by Geometry”. Once this has been turned off, MAPublisher will display layers in the order they are received from FME. Using this behaviour, some FME transformers and a Feature Type fanout (or new to 2015.1, specifying the Feature Type name) we can control the order of the layers in MAPublisher for optimal cartographic output.
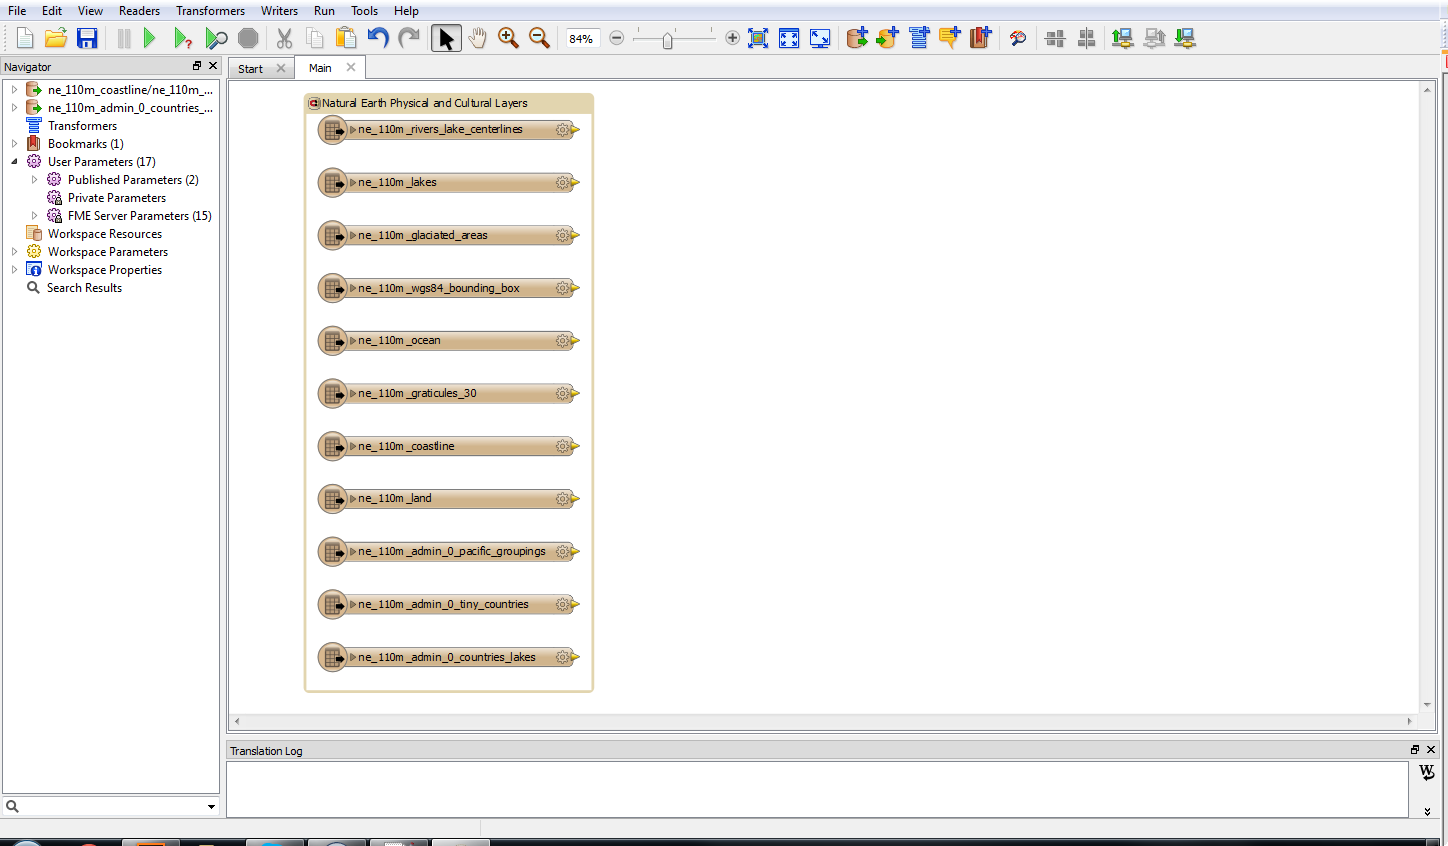
The first thing we want to do is to add some input Feature Types.
Natural Earth Shapefiles (Click for larger version)
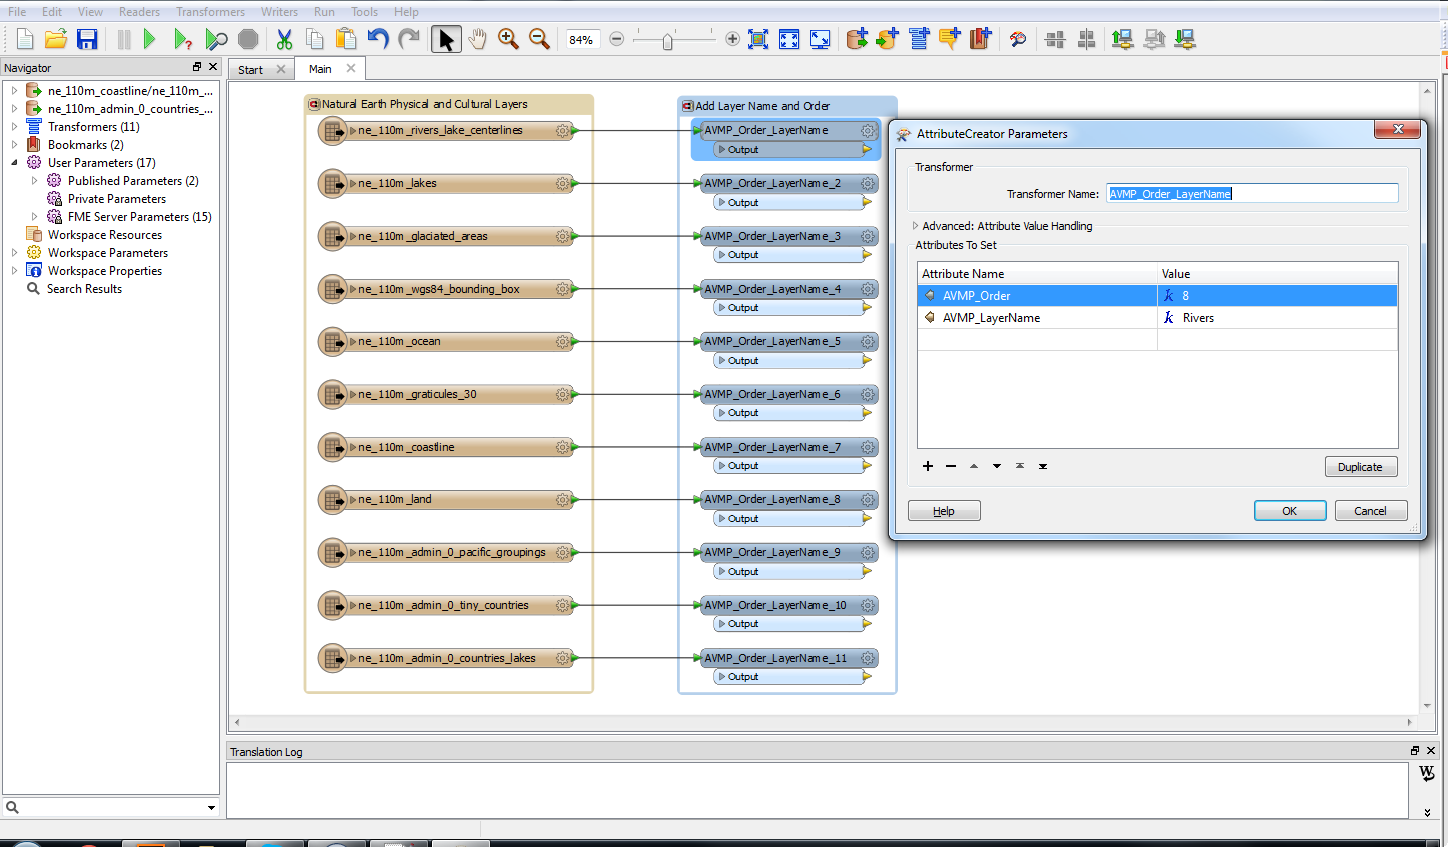
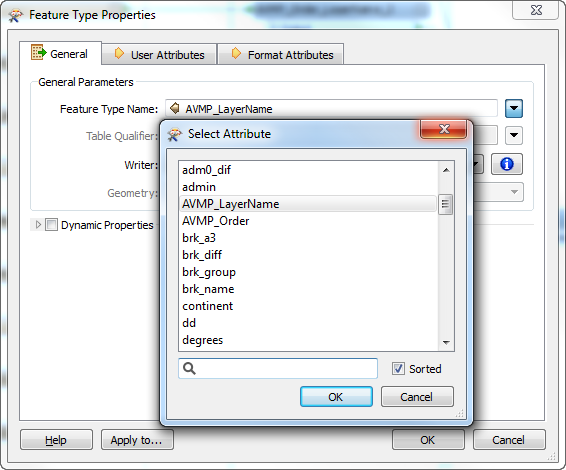
We will then create a template AttributeCreator Transformer to give each layer two attributes: MP_LayerName and MP_Order. MP_LayerName will define the name of the layer in MAPublisher and MP_Order will determine the order the layer is passed to MAPublisher; hence the order in which it is displayed.
AttributeCreator Transformer to add MAPublisher Specific attributes
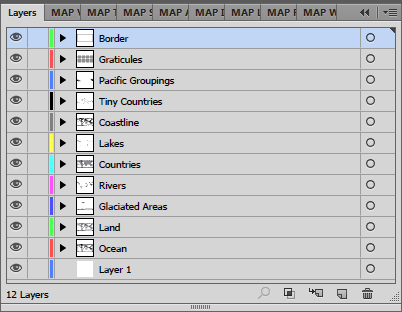
Each Feature Type will be connected to a copy of the AttributeCreator Transformer and the values will be populated for that layer. The layer with an order of 1 will be on top with larger numbers descending below.
Layer Name
Order
Border
1
Graticules
2
Pacific Groupings
3
Tiny Countries
4
Coastline
5
Lakes
6
Countries
7
Rivers
8
Glaciated Areas
9
Land
10
Ocean
11
AttributeCreator Transformers connected to input Feature types (Click for larger version)
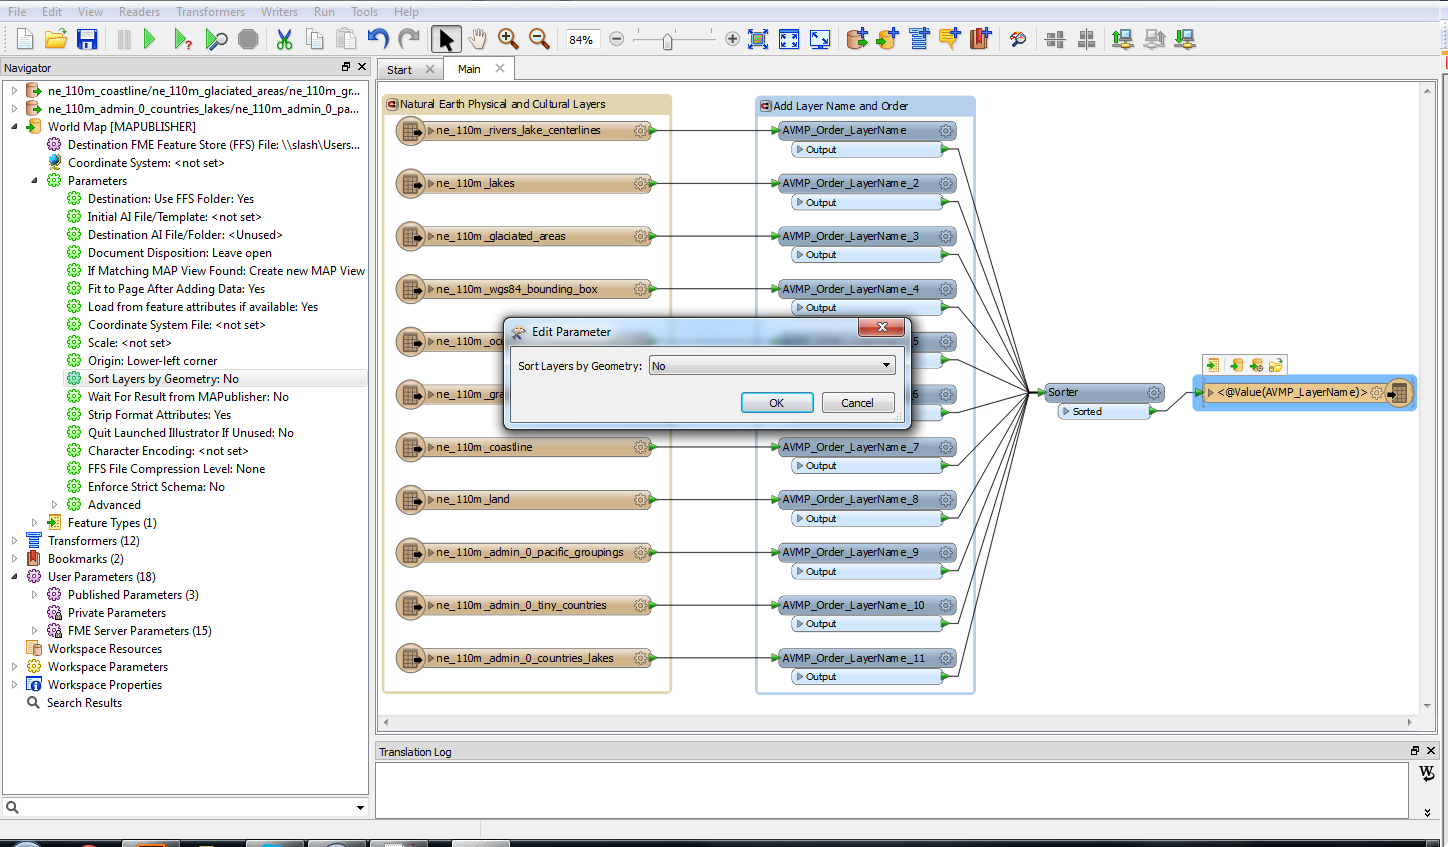
Once this is done, all the inputs can be connected to a Sorter Transformer. The Sorter will be set to numeric and ascending.
Sorter Transformer (Click for larger version)
Finally, the MAPublisher writer is added. The Sort by Geometry parameter needs to be set to No and the Feature Type name should be set by the MP_LayerName attribute we created earlier. This replaces Feature Type fanouts and has slightly new behaviour at FME 2015.1. It is explained more fully (here).
MAPublisher writer added with Sort by Geometry Set to No (Click for larger version)Output Feature Types are defined by the LayerName attribute
Once we run the workspace, we’ll see the layers in the Adobe Illustrator Layers panel in the exact order we specified.
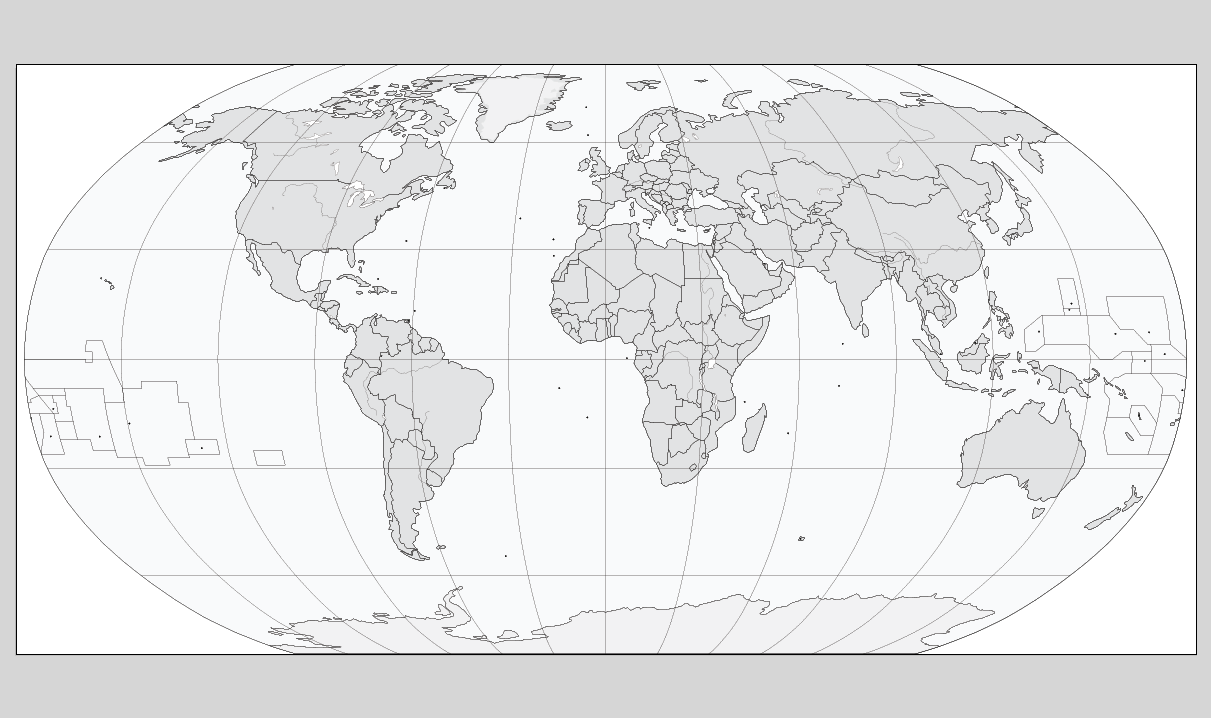
Layers in Adobe Illustrator are in the correct orderThe final map after some cartographic styling (Click for larger version)
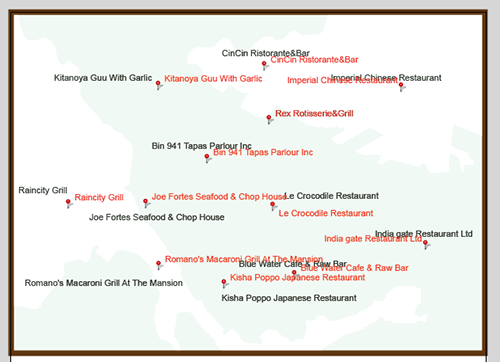
After a text placement engine places labels (e.g. annotations or labels) some manual adjustment is usually required. The major reason for this task is to avoid text colliding with other objects and to improve map aesthetics and composition. Here is an example map with the position of labels manually placed and adjusted. What do you usually do when updating your map and you have to update those labels?
An example with labels. The goal is to place the updated labels at the exact same position.
When running a text placement engine, it is common that the placed labels (in red) do not match with the position of the existing labels (in black). Have you ever thought that it would be useful if the updated labels can be positioned in the same place as existing labels? This is definitely possible using a combination of MAPublisher features.
A result after labels were placed with MAP LabelPro or Label Features.
Workflow involved to perform this task:
Obtain the position coordinate of existing text objects
Create new attributes to record #MapX and #MapY of each text object insertion point
Export the attribute table as a text file
Transfer the deteremined coordinte values of the text objects to the MAP layer (point layer in this example)
Join Tables using a common attribute between two tables
Place labels for the MAP layer
MAP LabelPro or Label Features
Adjust the position by those determined coordinate values for the text objects
Applying the recorded value to #MapX and #MapY
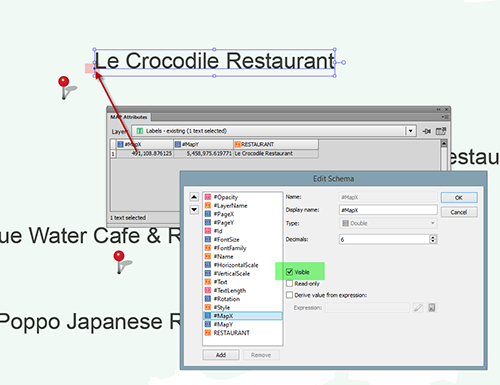
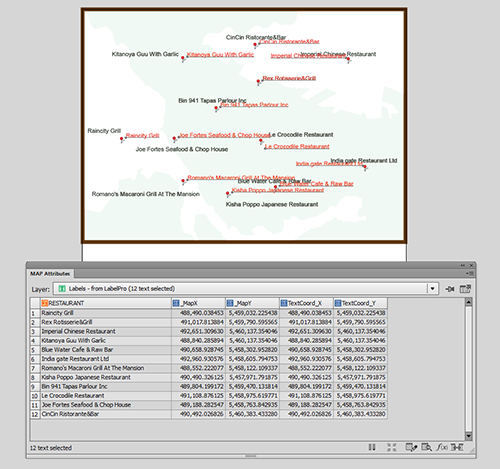
Step 1: Find the coordinates of the text insertion point from a text layer.
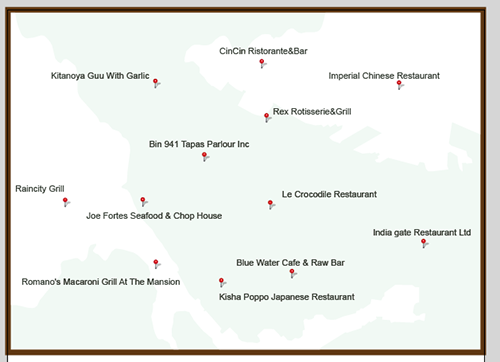
Every map object (point, line, area, image, and text) has a coordinate. MAPublisher calculates an insertion point when map objects are added to the artboard. For labels, a text insertion point can be seen as an anchor point or the square dot that is at the beginning of a text object. In this example, the text insertion point is placed at the lower-left corner of the word “Le Crocodile Restaurant” (highlighted in the red color in the screencapture below). The coordinate of this text insertion point is represented by the #MapX and #MapY attributes in the MAP Attribute panel. These two attributes are considered MAPublisher properties and are usually hidden. To display them, change their setting to “Visible” in the Edit Schema window as shown below.
Step 1: Finding the coordinate of the text insertion point from a “good existing text” layer
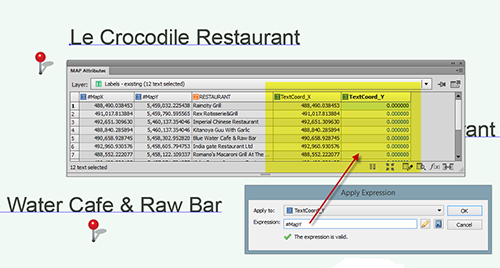
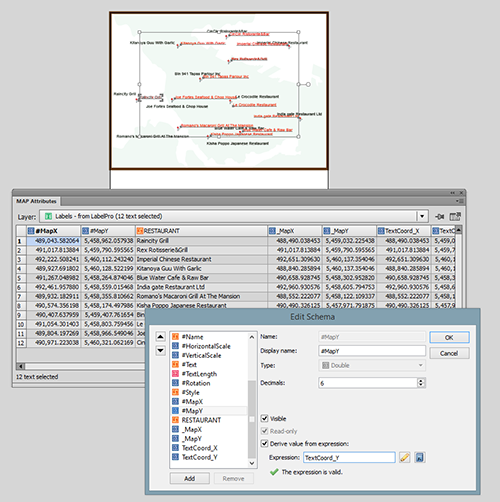
Step 2: Record the coordinates of the text insertion point from a text layer.
Make the #MapX and #MapY coordinate values as useable attributes. Create new attributes called “TextCoord_X” and “TextCoord_Y”, then copy the values from #MapX and #MapY using Apply Expression.
Step 2: Recording the coordinate of the text insertion point from a “good existing text” layer
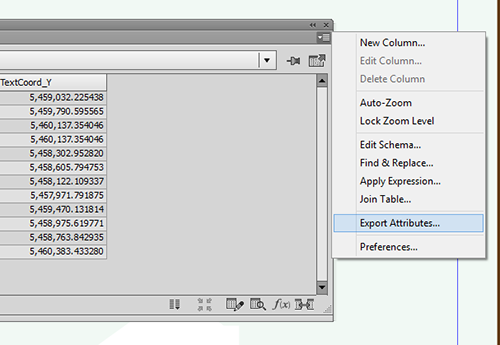
Step 3: Prepare to copy coordinates of existing labels to the point layer.
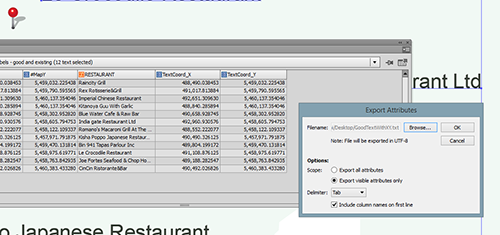
The coordinate values of the text insertion coordinate of a text layer are now copied. The next step is to copy these coordinates from the text layer to the point layer. A simple method to do this is to use Join Tables based on a common attribute. In this example, the string field “RESTAURANT” is the common field in both text and point layers to make a connection. If you already have some other attributes (i.e. object ID or feature ID in both the text layer and the point layer, you should use that). Export the attributes as a text layer from the MAPublisher Attributes panel options menu.
Step 3: Preparing for bringing the coordinates of good, existing labels to the point layer
Step 3: Preparing for bringing the coordinates of good, existing labels to the point layer (2)
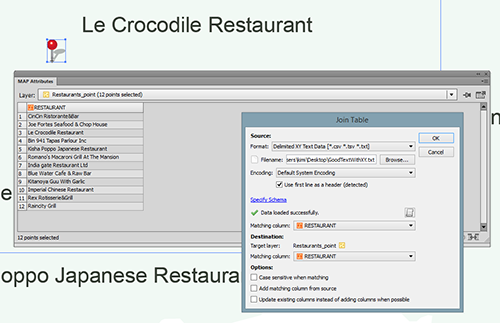
Step 4: Join the Point layer to the exported attributes table.
Now, create a table join between the point layer table and the exported attribute table using the Join Table feature.
Step 4: Joining Tables with the exported Text layer and Point layer
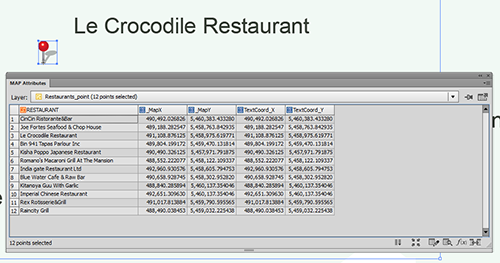
Below is the result from joining the tables together. There are also _MapX and _MapY columns because all visible attributes were exported. While the the step of copying attribute to TextCoord_X and TextCoord_Y was not totally be necessary, having columns named _MapX and _MapY could avoid some confusion because the point layer also has #MapX and #MapY columns. In this case, having attributes clearly indicating the values from the text insertion point is what is most important.
Step 4: Result from Join Tables
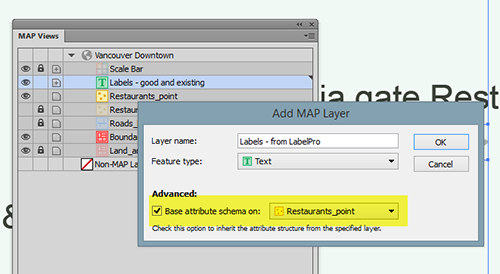
Step 5: Place labels with MAPublisher (inherit the attribute values from the point layer to text layer)
Now, place labels with MAPublisher using either Feature Label or MAP LabelPro. The important step here is to inherit the attributes from the point layer to the text layer (the target layer for generating new, updated labels).
When creating a new Text MAP layer, make sure that the “Base attribute schema on:” option is checked. This will allow the text layer to inherit the attributes from the point layer.
Step 5: creating a new MAP Text layer with the same attribute structure as the MAP Point Layer
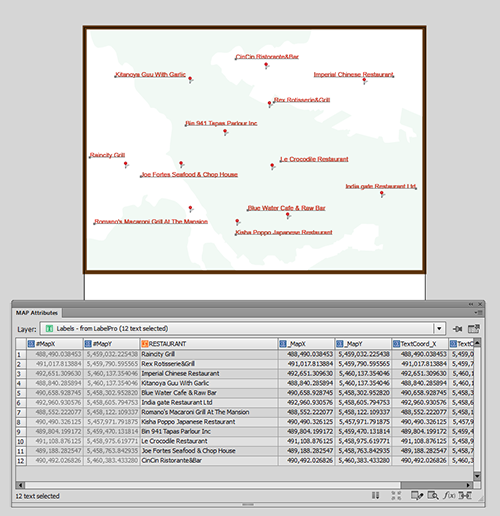
Below is the result of placing labels with MAP LabelPro (red labels). The result (in terms of the attribute structure) should be the same if labels are placed using Feature Labels. The position of new labels are not the same as the existing one. The label position can now be adjusted using the TextCoord_X and TextCoord_Y values.
Step 5: Labels placed with MAPublisher LabelPro or Label Features
Step 6: Move the text objects by adjusting the #MapX and #MapY.
As illustrated above, the text position is obtained from the text insertion point. The next step is to apply the text insertion point coordinates to the #MapX and #MapY attributes of the point layer using an expression with the Apply Expression feature or use the “Derive value from expression” option in the Edit Schema dialog box.
Apply the TextCoord_X and TextCoord_Y values to #MapX and #MapY, respectively.
Step 6: Now moving the text objects using the #MapX and #MapY
The labels are now positioned in the exact same location as the existing text layer.
Result: the new, updated labels are placed in the same position as the existing labels.
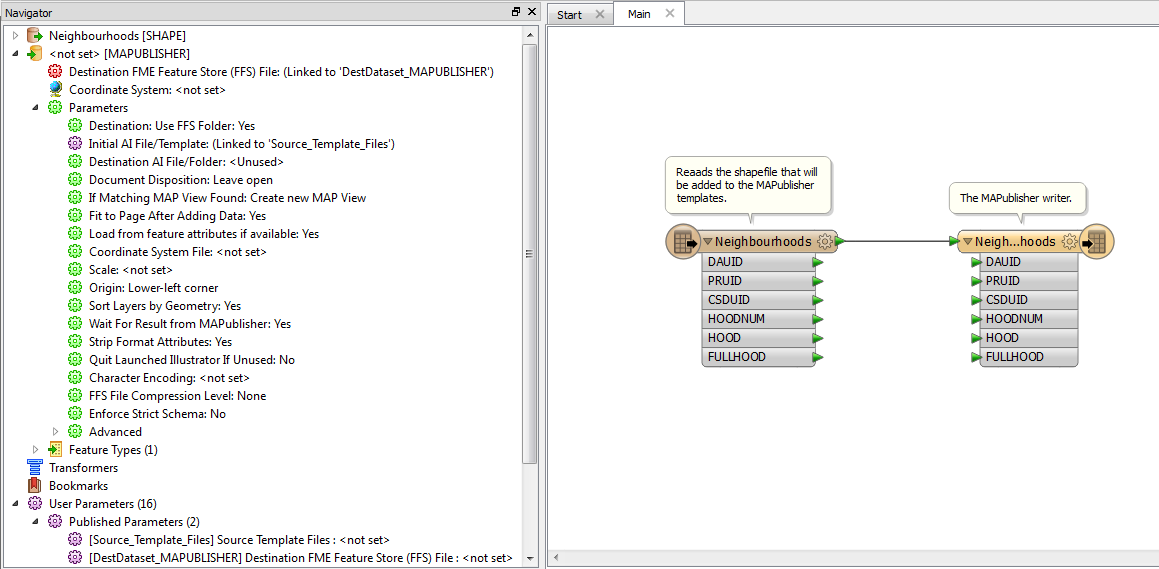
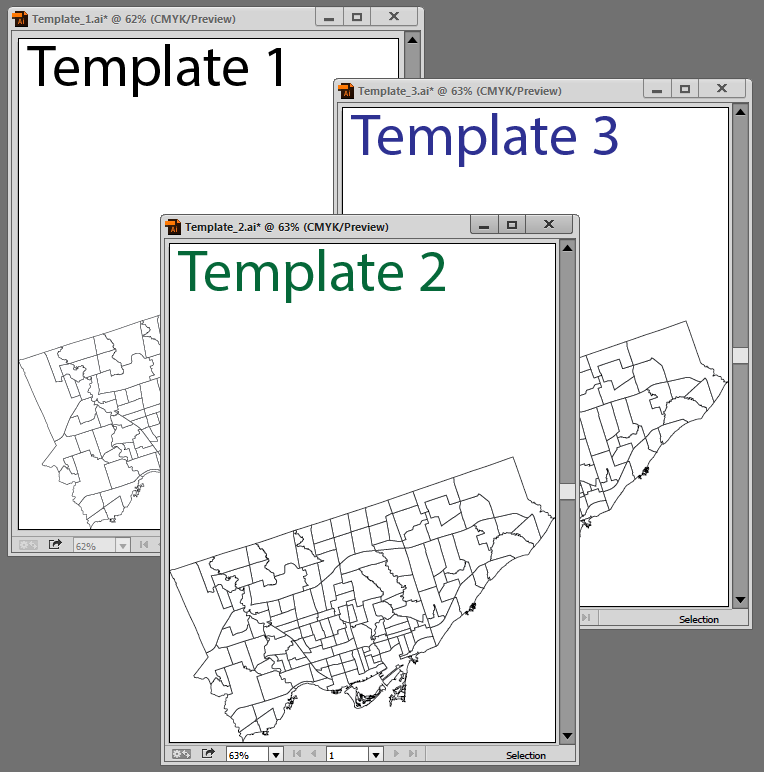
Drawing inspiration from this Safe software blog post we have developed an FME workflow that allows the user to update multiple MAPublisher templates with additional layers using two workspaces and a workspacerunner transformer.
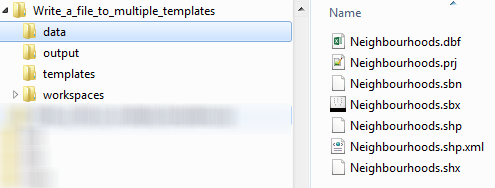
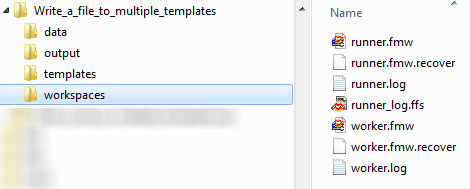
The folder structure for the project follows one possible standard arrangement. A data folder contains the shapefile that is being added to the existing .ai files. An output folder gathers the intermediate .ffs files generated by FME that pass the data to MAPublisher. The templates folder contains the .ai files that will have the layer added to them. Finally the workspaces folder contains the two workspaces required for the transformation.
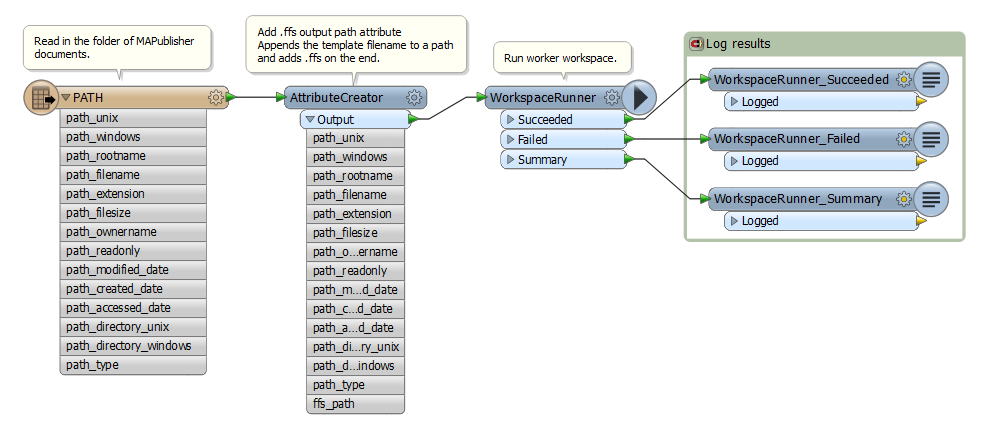
The runner workspace uses a path reader to get the filenames and paths of the .ai files. A filter is applied to make sure only files with the extension “.ai” are read. After the path reader an attribute creator adds the path for the output .ffs files as an attribute. This is dynamically calculated based on the filenames of the input .ai files.
Runner Workspace (Click for larger version)Attribute Creator (Click for larger version)
The full paths to the template files and the paths to the output ffs files are passed as published parameters to the worker workspace. Two published parameters have been created in the worker workspace and linked to parameters in the MAPublisher writer. This allows the writer to take the values passed from the runner workspace. The worker workspace is run once for every file that is in the folder of ai files, and these published parameters update dynamically for each one.
Published Parameters in the Worker WorkspaceWorkspacerunner Parameters (Click for larger version)
The worker workspace has a shapefile reader that reads in the layer that is going to be added to each template. At this point multiple readers or other transformers could be added to increase the complexity of the transformation.
Worker Workspace (Click for larger version)
When the runner workspace is launched each template is opened up, the shapefile is read and added to a new MAPView in the MAPublisher document. Equally it could be added to an existing MAPView with a matching coordinate system. These documents can be left open as shown here, or with the addition of another published parameter new output .ai files could also be specified.
Creating multiple maps that share cartographic styling is a common requirement for MAPublisher users. The most effective way to accomplish this is the use of MAP Themes. MAP Themes are a collection of thematic cartography tools designed to increase productivity by automating how styles and symbols are applied. Creating a number of MAP Themes based on regularly used layers with standard attribute schemas can greatly reduce the amount of time spent styling maps.
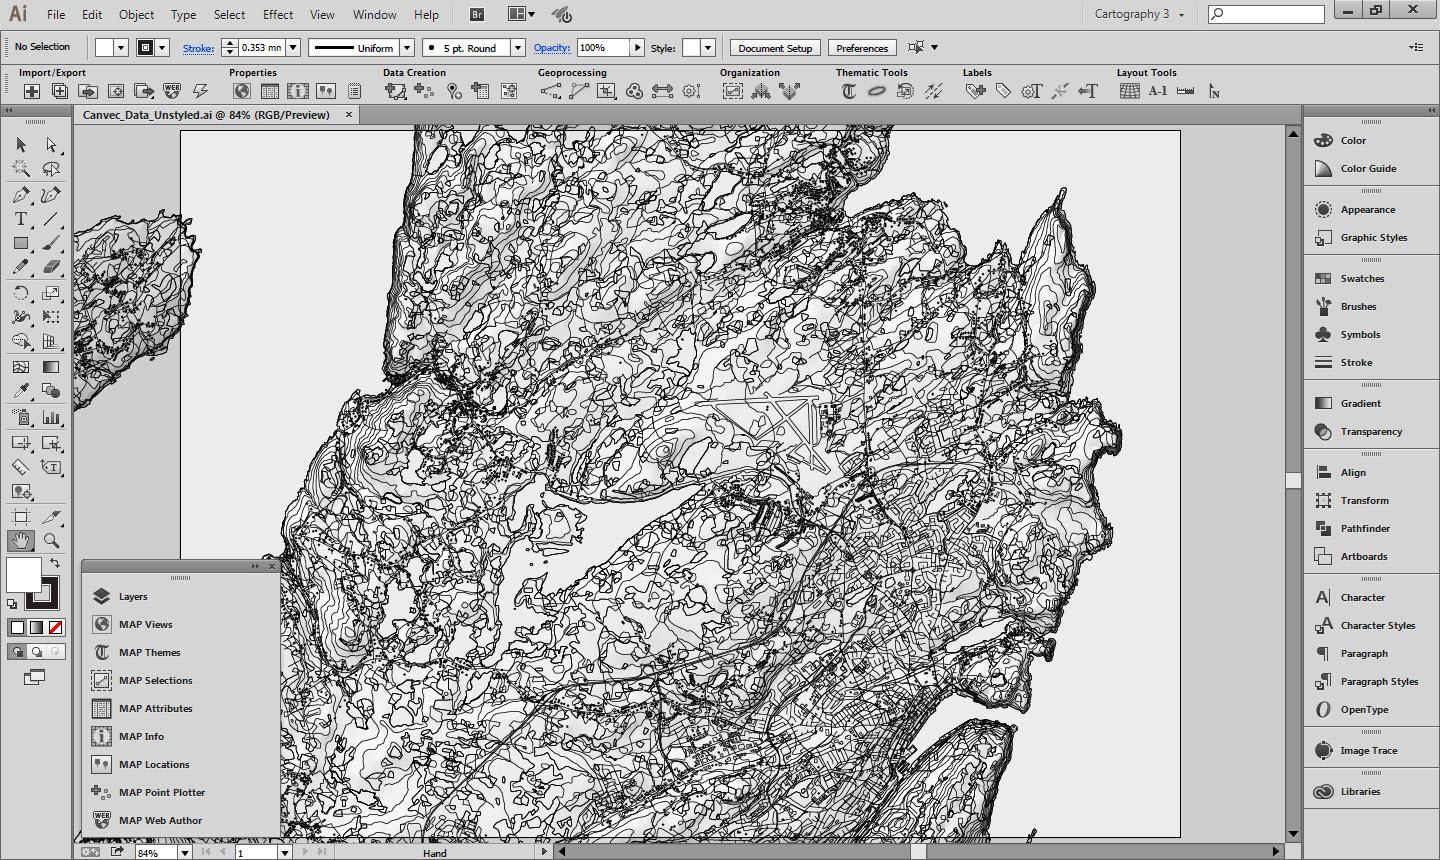
This guide will walk through creating and setting up MAP Themes to automatically apply to the appropriate layers upon import. If done correctly, rather than seeing this:
Unstyled CanVec+ layers
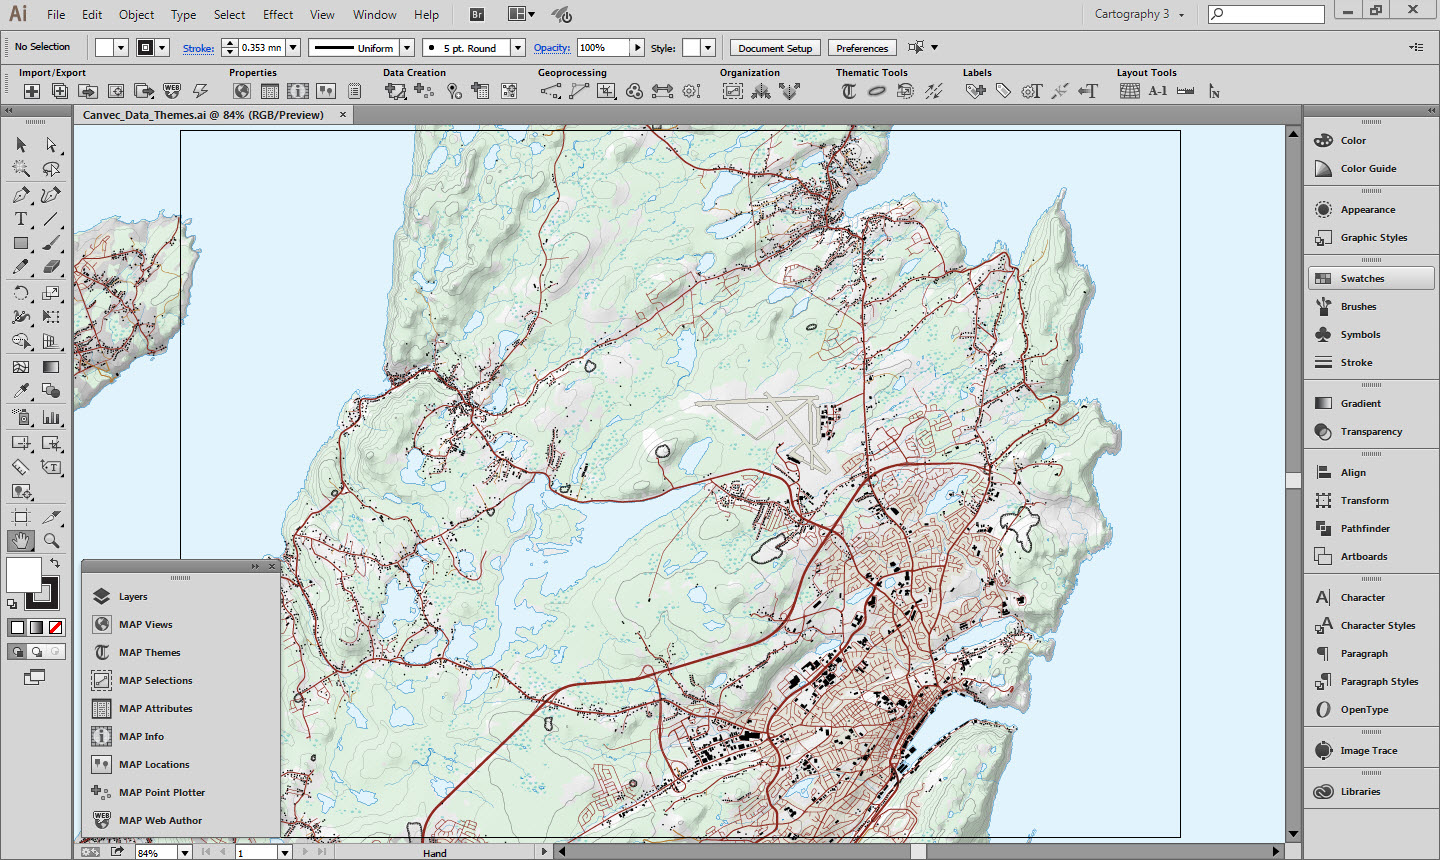
You will see this when importing data to MAPublisher:
Styled CanVec+ layers
1. Data Source
The data used in this guide comes from the publically available CanVec+ topographic database. CanVec+ contains a comprehensive set of layers optimized for display at 1:50,000 that are perfect for topographic mapping. In fact, many of these layers are used in the construction of the CanTopo Topographic mapping series available here.
The layers you receive from the CanVec+ download service will vary depending on what features are present in the extent chosen. The Geogratis Geospatial Data Extraction tool is the most convenient method to retrieve CanVec+ data. This guide uses a selection of CanVec+ layers styled similarly to the CanTopo maps.
All vector data was downloaded in an unprojected geodetic coordinate system and projected into a UTM projection MAP View.
The map shown above contains 12 vector layers and one raster layer, but we will only discuss the styling and configuration of three layers as the process is similar for the rest. You can download the Adobe Illustrator file at the bottom of the page if you want to examine the different layers, their graphic styles and MAP Themes.
MAP Themes are the primary method for applying attribute based cartographic symbology. A powerful feature is the ability to automatically do this on layer import based on geometry type or file name. By defining one or many graphic styles and a MAP Theme for each layer the layers can be automatically styled on import.
CanVec+ themes have a consistent naming scheme that makes them especially suitable for this sort of automated styling. Because each style is always named the same, it is simple to set up the MAP Themes to automatically apply when the layers are imported. The theme names are consistent but somewhat obscure, as are some of the attribute names and values. Luckily there is a specifications document that provides a guide to the various themes, datasets and attributes that are available. A link is provided in the useful resources section below. While the style guide is helpful, it can be difficult to navigate, so it has also been translated into a more easily readable Excel spreadsheet, which also available in the useful resources.
A CanTopo symbology guide is available for download and was used to help define the styles for the different layers used in this map. A link is available in the useful resources section at the bottom. The University of Toronto also hosts an old specifications guide, but as it is almost 14 years old it should not be assumed to be accurate. If you are looking for inspiration though, it is useful.
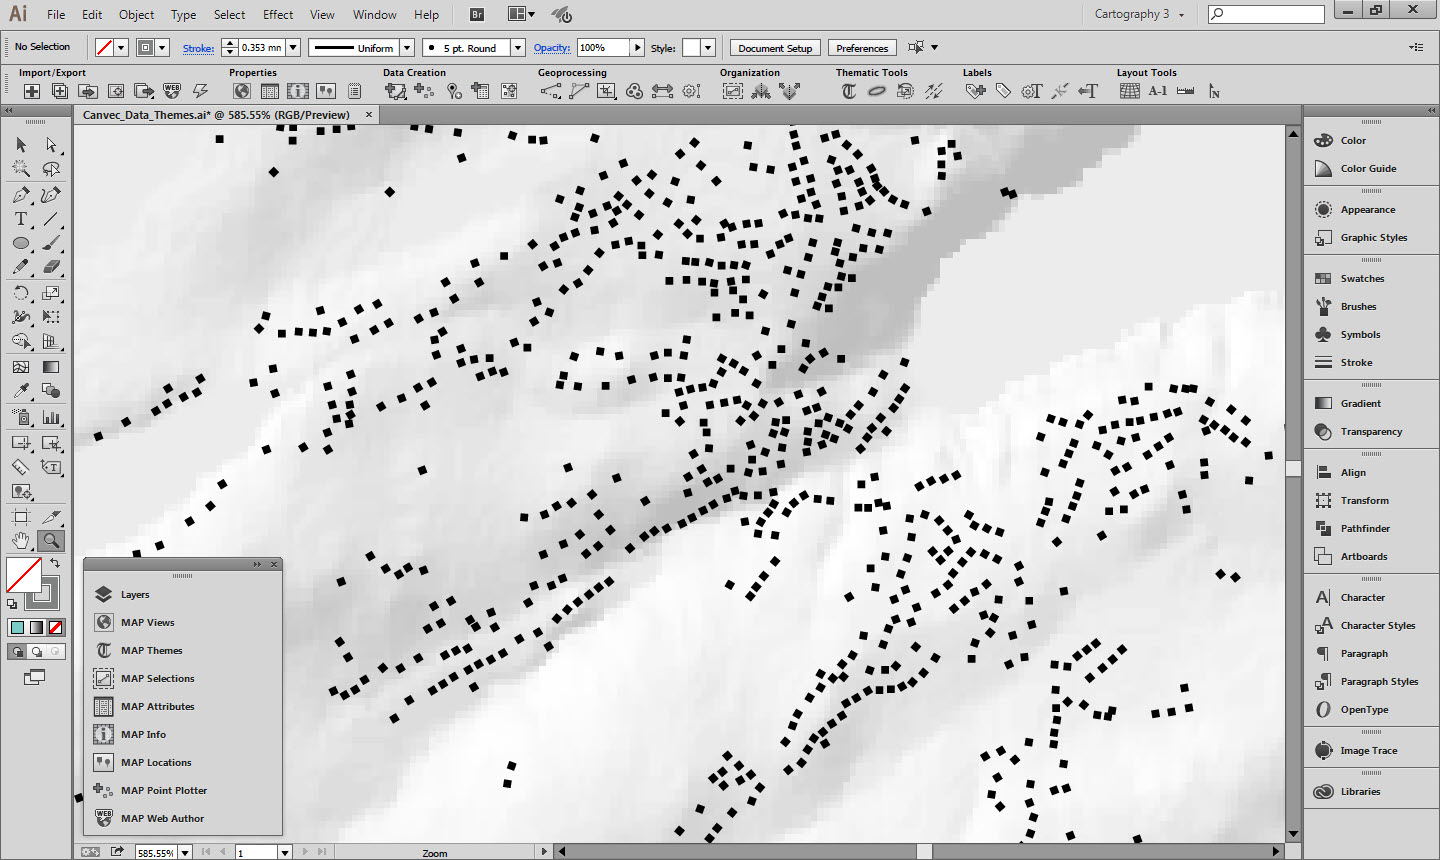
2. Example A: Building point locations
Building Symbols
2a. Building Point Symbol
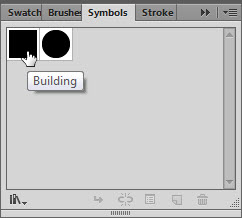
The Graphic style for the building symbols is a black square rotated to match the value in an orientation attribute. Using the CanTopo symbology guide a correctly sized square was created and then added to the symbol library.
Buildings Symbol
2b. MAP Theme
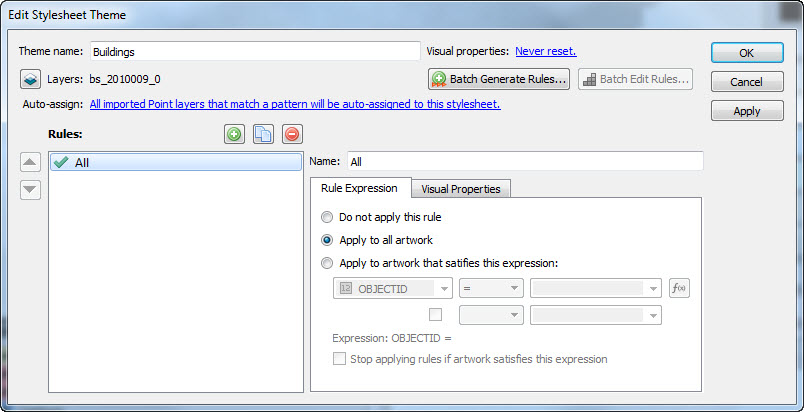
A new Point Stylesheet MAP Theme was created called Buildings. The appropriate layer “bs_2010009_0” was added to the Theme and a rule was created named “All” as it will apply to all the building point locations. The Rule Expression is set to apply the Theme to all artwork as we want all the building points to look the same.
Buildings Rule Expression tab
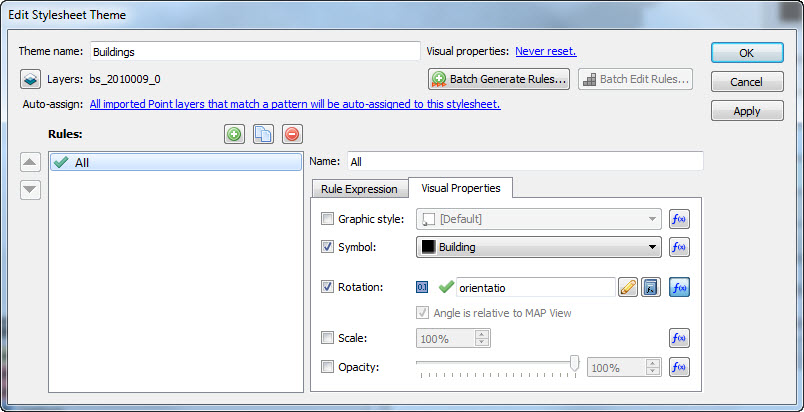
The Visual Properties tab was used to determine how the buildings would appear. The Symbol property was set to use the Building black square symbol created and added to the Symbol library earlier. The Rotation property was set to use the “orientatio” attribute. This ensures the buildings are oriented correctly.
Buildings Visual Properties tab
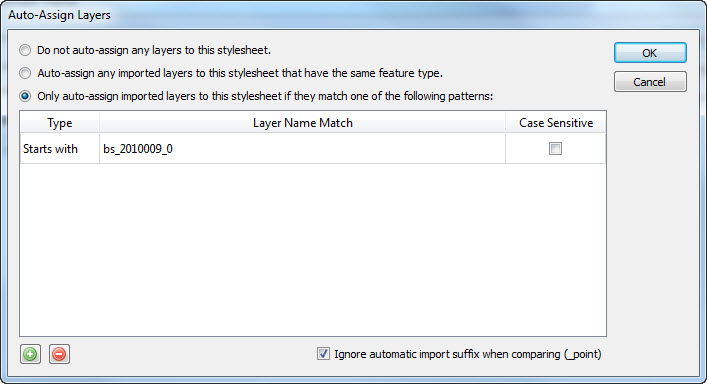
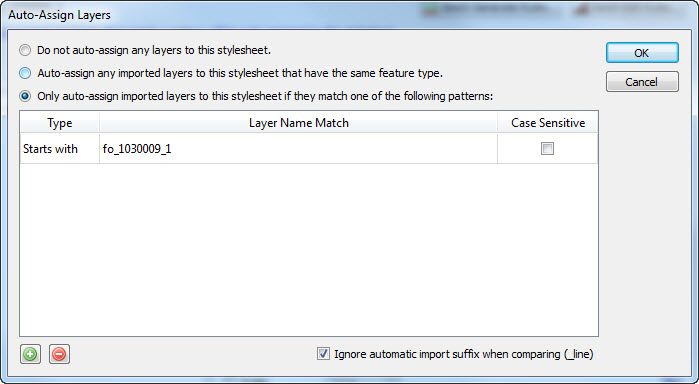
Finally, and most importantly for the MAP Theme automation, the Auto-assign option was set so that any layer that matches the filename of the imported shapefile would automatically be styled using this theme.
Buildings Auto-assign setting
3. Example B: Contours
Contours
3a. Contours Graphic Style
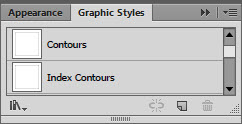
Two Graphic styles were created for the contours: one for the regular contours and one for the index contours at intervals of 100m. Both are grey, with the index contours slightly thicker (although it is hard to tell in the Graphic Styles panel.)
Contours Graphic Styles
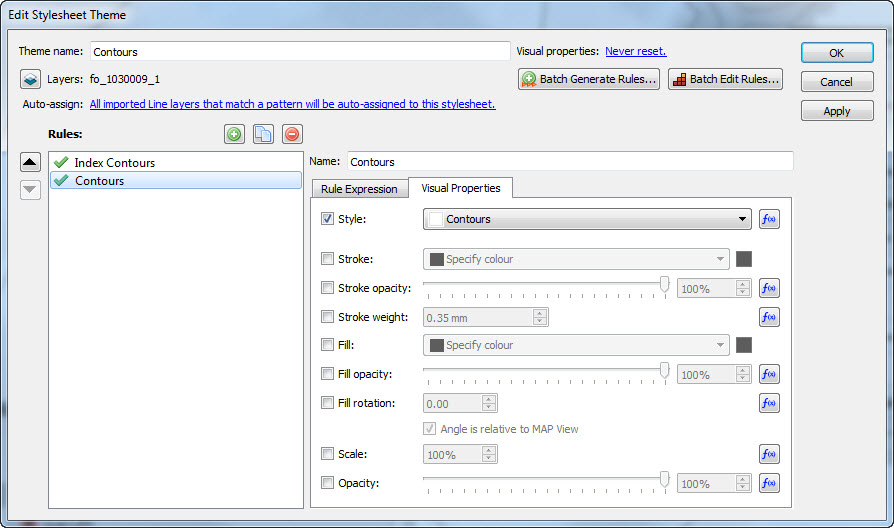
3b. MAP Theme
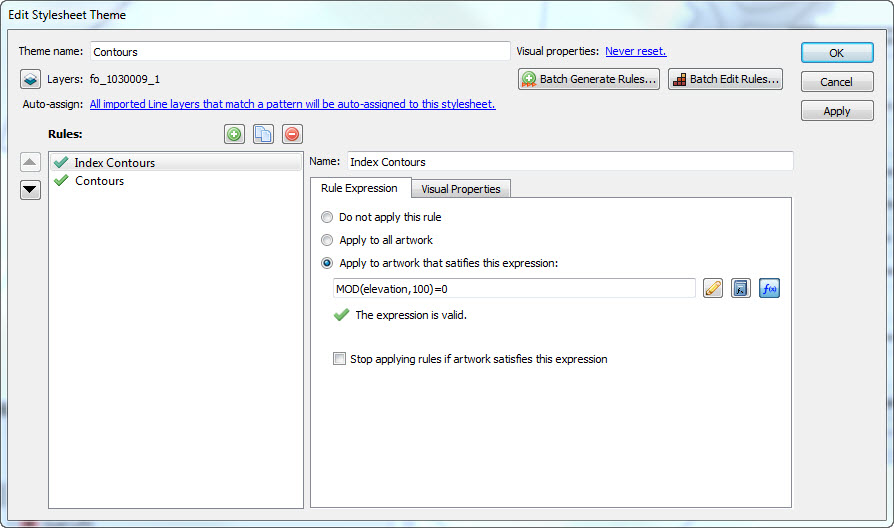
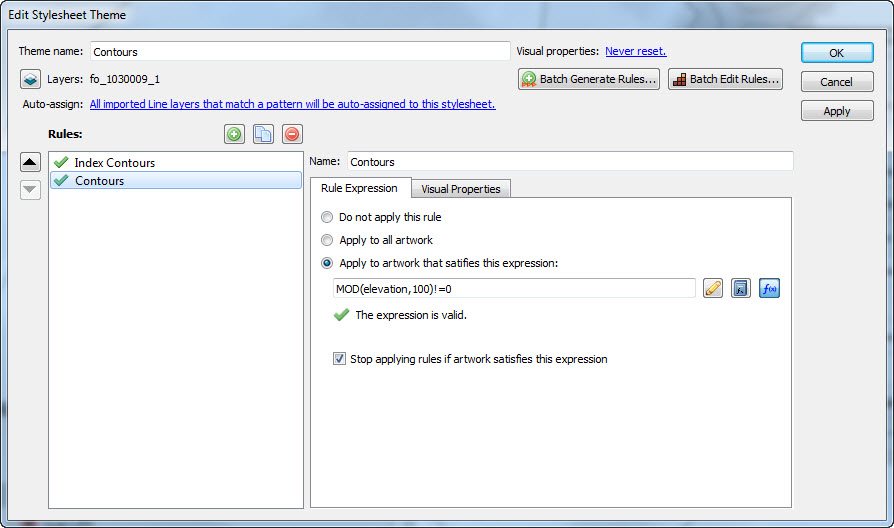
A Line Stylesheet MAP Theme was created called Contours. The layer “fo_1030009_1” was assigned to the MAP Theme. Two rules were created, one for index contours and one for regular contours. For the index contours, the Advanced Rule Expression builder is used to select any contour where the elevation is a multiple of 100, and the converse for the regular contours.
Index Contours Rule Expression
The Modulo (MOD) function makes this simple. For the index contours, the expression built as: “MOD(elevation,100)=0”. For the regular contours, the expression is “MOD(elevation,100)!=0”. The != operator means not equal to.
Contours Rule Expression
The Modulo function will be available with a future release of MAPublisher. If you are using an earlier version of MAPublisher, the same result for index contours can be had with this expression:
(elevation/100)-ROUNDDOWN(elevation/100,0)=0
If you do try and apply this MAP Theme with an earlier version of MAPublisher without changing the equations, it will not work and you will get errors.
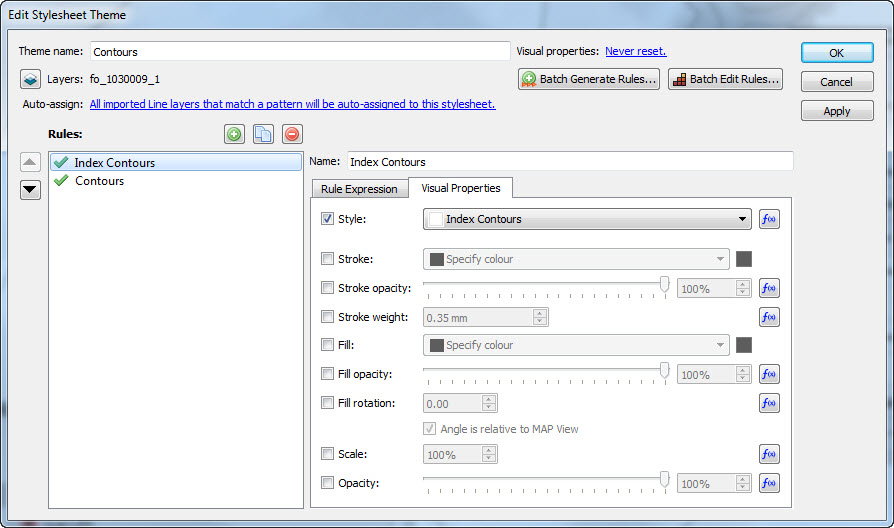
Each rule is assigned the appropriate graphic style applied in the Visual Properties. Creating Graphic Styles in advance is much easier than trying to remember specific stroke/colour combinations and makes them re-usable.
Index Contours Visual Properties
It is worthwhile organizing them in the Graphic Styles panel and naming the Graphic Styles appropriately so you can easily remember which is which later.
Contours Visual Properties
The layer is then set as auto-assigned so that when it is imported in the future this MAP Theme will automatically be applied.
Contours Auto-assign setting
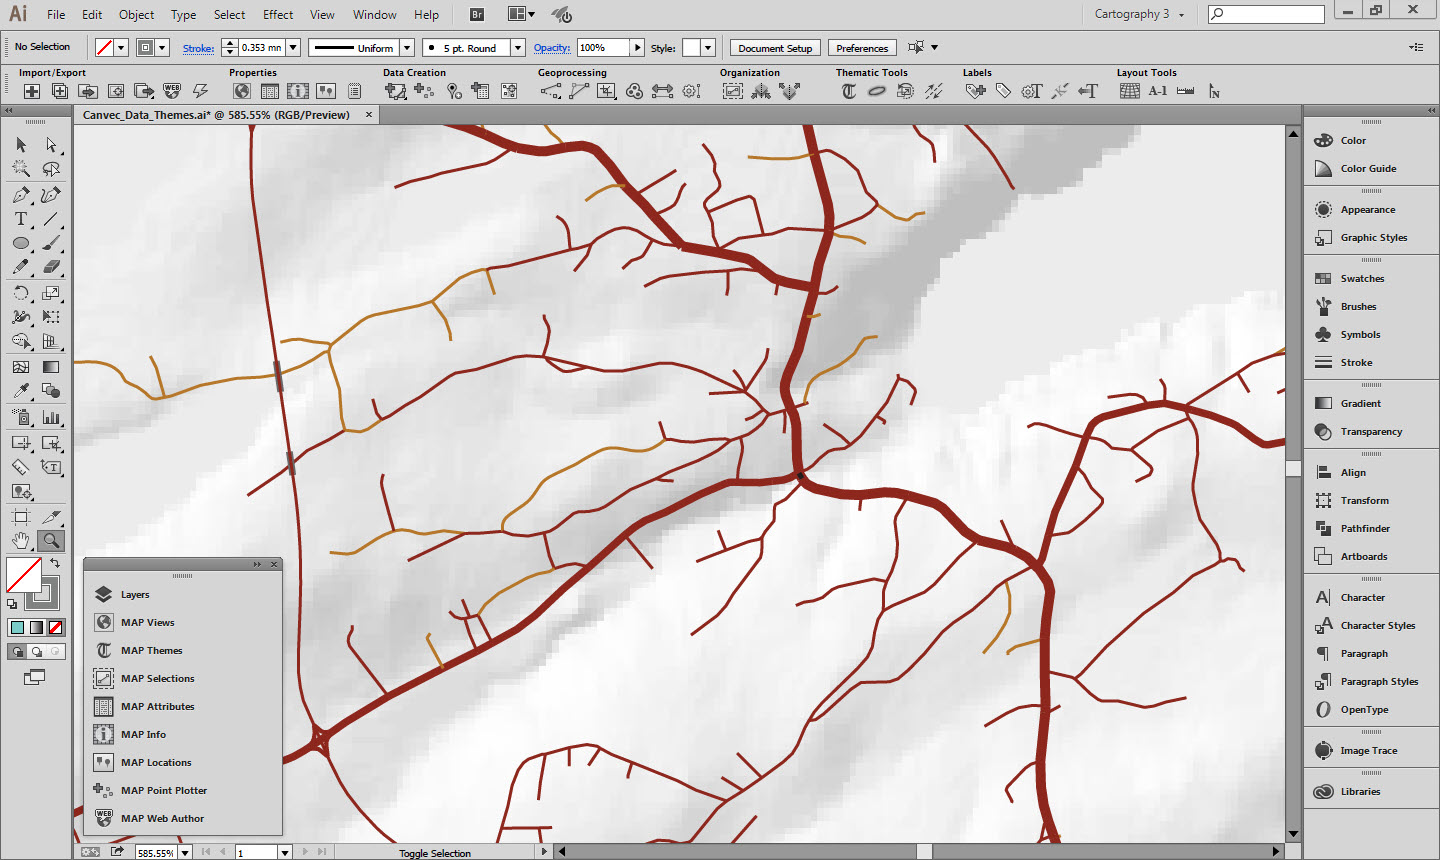
4. Example C: Roads
Roads
4a. Graphic Style
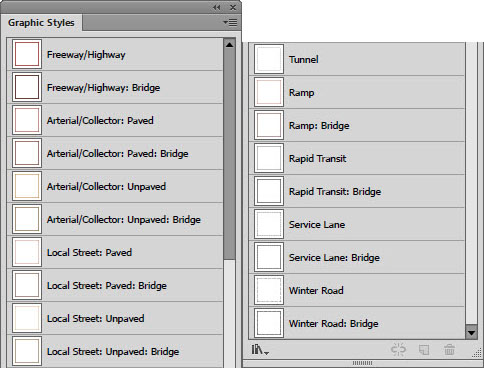
The Roads layer is the most complex as there are multiple different classes of roads, that are then broken down into sealed and unsealed surfaces, and can be at grade, tunnels or bridges. Several of the road classes are assigned the same Graphic Style, so each style was named after a representative road class and assigned to several MAP Theme Rules.
Roads Graphic Styles
4b. MAP Theme
There are defined styles of roads in the CanTopo specifications, but these do not map directly to the attributes that are present in the CanVec roads dataset. There are several attributes that hold information about the composition of the road, but the ones that were used to define the MAP Theme Rules were:
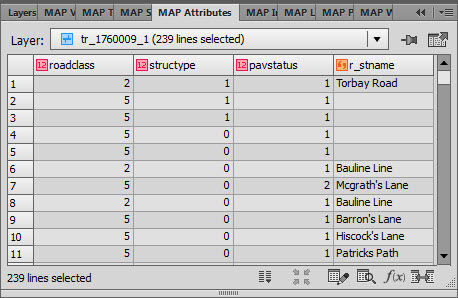
roadclass: a heirachy of road types
structype: defines if the road is a road, a bridge or a tunnels
pavstatus: contains information on the road surface, if it is paved or unpaved.
Roads Attributes (many others are hidden)
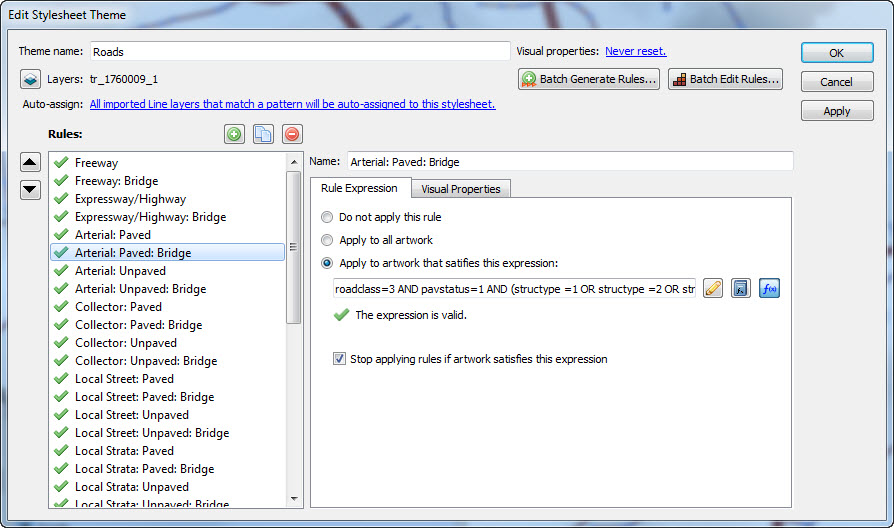
A Line Stylesheet Theme was created called Roads. The layer tr_1760009_1 was assigned to this Theme. Each road class has its own rule. The rule expression determine what class of road it is, if it is a bridge or a tunnel, and if it is paved or unpaved. An example of this is “Arterial: Paved: Bridge” with the expression:
roadclass=3 AND pavstatus=1 AND (structype =1 OR structype =2 OR structype =3 OR structype =4)
which simply says select art that is an Arterial Road (roadclass=3) is paved (pavstatus=1) and one of four different types of bridge (structype 1 through 4).
Roads Rule Expression
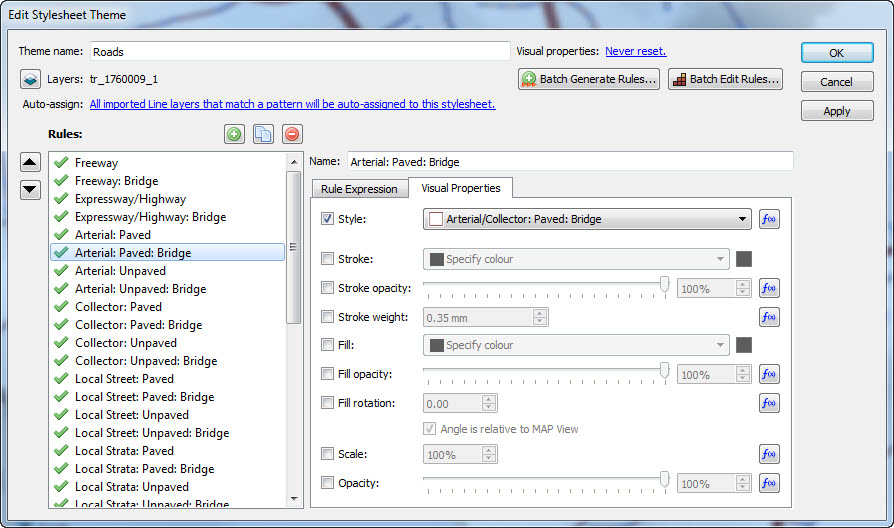
As in previous examples, each rule is assigned a Graphic Style in the Visual Properties tab.
Roads Visual Properties
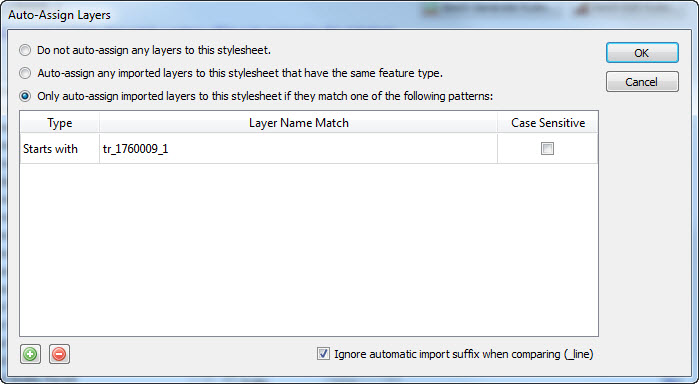
The layer is set to auto apply on import.
Roads Auto-assign setting
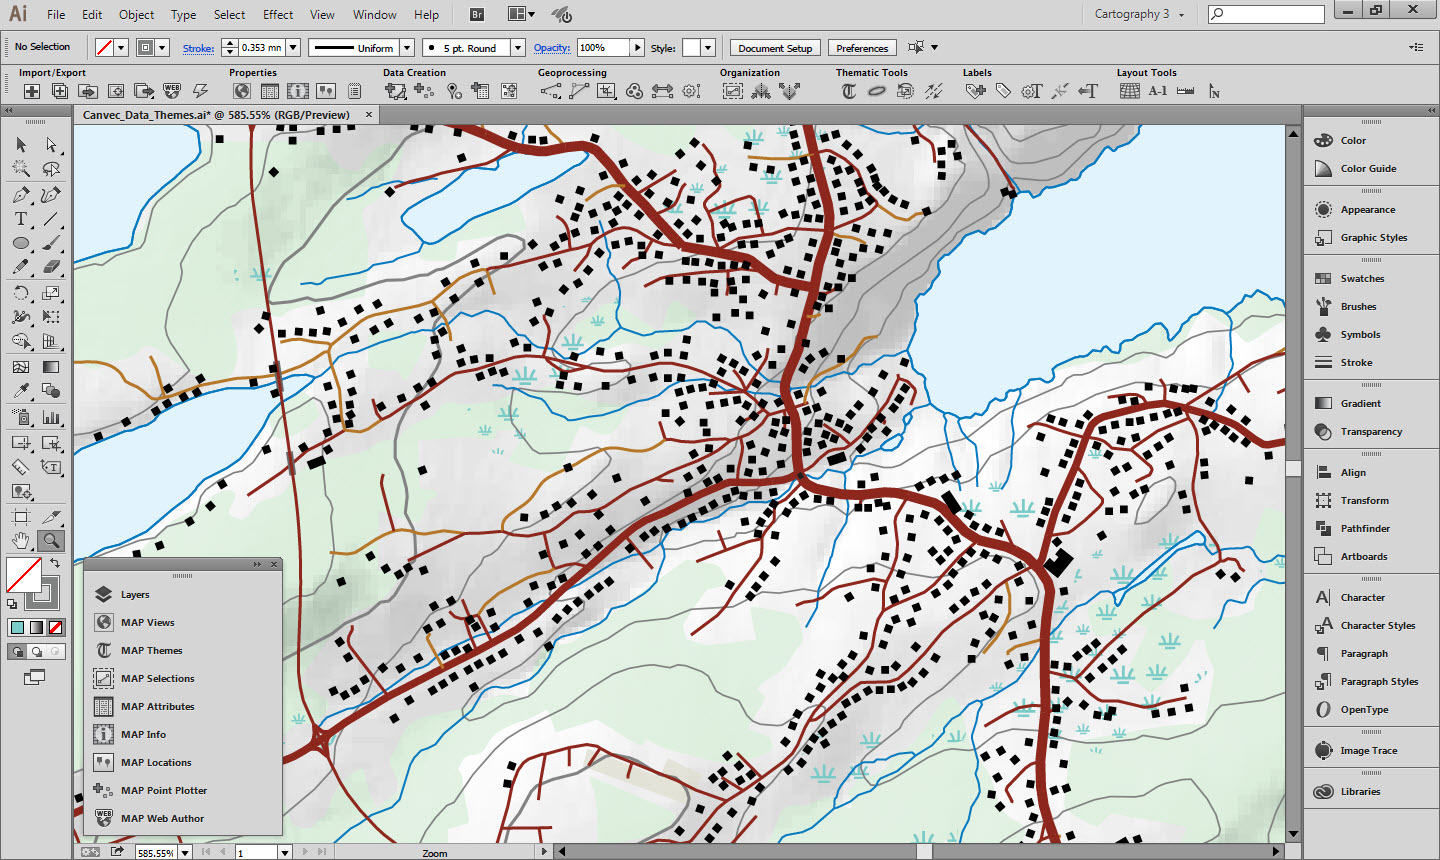
Once rules are created and applied to all the imported layers the end result looks like this:
Styled Layers overlaid on hillshade
5. Hillshade
In addition to vector data, the GeoGratis portal has raster terrain data available for download. There are digital elevation models, digital surface models, and a variety of derived products such as slope and aspect. For this map we downloaded a hillshade and adjusted the opacity so it would blend with the map style. The forest cover layer and the built up areas layer also had their blending modes adjusted so the hillshade would show through.
The hillshade was downloaded in an unprojected geodetic coordinate system and Geographic Imager was used to transform it into the UTM projection used for this map.
6. Final words
In order for the defined MAP Themes to be automatically applied to any imported data, the imported layer filenames must match those defined in the MAP Theme Rules as discussed above. If you would like to try it out with your own CanVec data extract, do the following:
Download the “Canvec_Data_Themes.ai” file linked below for the version of Illustrator you are using. Have a look at the data structure, layer names and MAP View properties of this document.
Also download the appropriate “Canvec_Data_Themes_Empty.ai” file to use as a template.
Download an extract of CanVec data as shapefiles.
Use the Advanced Import functionality to import the shapefiles into the empty document. Reproject the map if desired.
The imported data have the styles applied automatically. However, you will probably have a few layers that have no style. Use the methods detailed above to create new styles for those layers.