My Account     Contact Us     Cart

Cartographer Chronicles: Dan Cole

When it comes to map-making, Dan Cole is a true master. A passionate academic, Dan has designed maps for research and academia for over 40 years. As the GIS Coordinator and Chief Cartographer of the Smithsonian Institution in Washington, DC., Dan has created maps and cartographic pieces for museum exhibits enjoyed by hundreds of thousands of visitors every year. As a researcher, Dan has authored scholarly publications in several renowned academic journals, and co-edited the book “Mapping Native America: Cartographic Interactions between Indigenous Peoples, Government, and Academia.”  

For Dan, his interest in maps began when he was a child. He often enjoyed being the “navigator” on family vacations and building off a natural fondness for exploration he developed hiking trails as a Boy Scout. In his freshman year at the University at Albany – State University of New York, Dan first became interested in a career in cartography while studying under esteemed cartographer Dr. Michael Dobson. The opportunity to turn a genuine interest into a full-fledged career was too good to pass up, and Dan soon found himself enrolling in every cartography, geography, and remote sensing course he could. In the final year of his Bachelor of Geography degree, Dan became a cartography teaching assistant, providing him his first opportunity to act in a teaching role. 

Immediately after graduating, Dan was recruited to an assistantship position at Michigan State University (MSU). Here he published his first research paper, which was co-authored alongside Richard Groop, now a professor emeritus in Geography at MSU. Completing a Masters degree in Geography in 1979, Dan moved to Oregon State University (OSU) and began collaborating with cartography professor Jon Kimerling, first as a TA, and later to run the Cartographic Lab there.

“Were there Dinosaurs in your backyard?” – One of Dan’s maps on display in the Deep Time Hall at the Smithsonian National Museum of Natural History

Leaving OSU in 1981, Dan took on a variety of roles at several recognizable institutions across the country. Some of these roles included; leading the Cartographic Lab at the University of Maryland, working as a cartographic technician for the National Oceanic and Atmospheric Administration (NOAA), contract cartography work for the Woods Hole Oceanographic Institute, and taking on a course instructor position at Montgomery College. In 1986, Dan began working at the Smithsonian Institution (SI) and was able to pursue his passion for research full-time. Some of his earliest mapping pieces with SI became an integral part of the “Handbook of North American Indians”, a series of scholarly reference volumes documenting the culture, language, and history of all indigenous peoples in North America. Through a cooperative arrangement, he was also responsible for researching the changes to the Bureau of Indian Affair’s “Indian Land Areas” map in 1987 and 1989.

“My first five years there mostly involved cartographic research, doing both manual and computer-based mapping for the Handbook of North American Indians—at the time we used Adobe Illustrator 88!”

Later, Dan moved to a role as the GIS Coordinator with the Smithsonian’s IT Department. There, he was exposed to the entire breadth of cartographic projects spanning the Smithsonian’s impressive list of research disciplines. He worked on projects related to biodiversity and species ranges, created maps documenting climate change, and contributed to interactive map exhibits showing the impacts humans have on the environment. From volcanology and mineralogy to prehistoric studies and even the study of dinosaurs, Dan became involved in most of the Smithsonian’s major subject areas. Several of Dan’s map creations even feature in the permanent exhibits at the Smithsonian National Museum of Natural History.
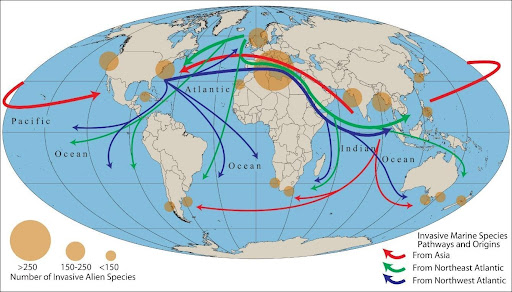
Pathways and origins of invasive marine species, one of 40 maps created for the Ocean Hall exhibit at the Smithsonian National Museum of Natural History

Although each unique exhibit and area of study came with its own specific objectives, from a cartographic standpoint, he found that most still shared a few key concerns. He noted that one of the biggest challenges for almost all museum researchers is to geo-reference the vast number of artifacts and biological specimens that are contained in the museum’s collections. Such a process is crucial to analyze where specimens were found in the past and to provide insights on where they could be found in the future based on changes to the environment.

“Collections for nearly all museums around the world, including the Smithsonian, have environmental characteristics documented with the collection site. But most, by far, do not have coordinate locations for artifacts and specimens collected before the GPS era; rather, the majority of their collections have descriptive locations. So we must use Natural Language Processing—a computer science-based technique—to process coordinates from the written descriptions.”

By the mid-1990s, digital mapping processes had become an integral component of map creation. Dan became one of the first adopters of MAPublisher, using the first version of the software to work with maps and geographic data in the Adobe Illustrator environment. Today, MAPublisher continues to play a crucial role in map production at SI, and Dan still uses MAPublisher to produce maps for some of the museum’s most popular exhibits.

Since obtaining MAPublisher in the 1990s, I have been involved with over 20 different exhibits and multiple publications. All of these required importing shapefiles to Adobe Illustrator, PDF, or EPS formats so that publishers or exhibit staff could work with them. While other digital mapping software has improved over the years, I find the placement of typography is still handled more elegantly with MAPublisher.”
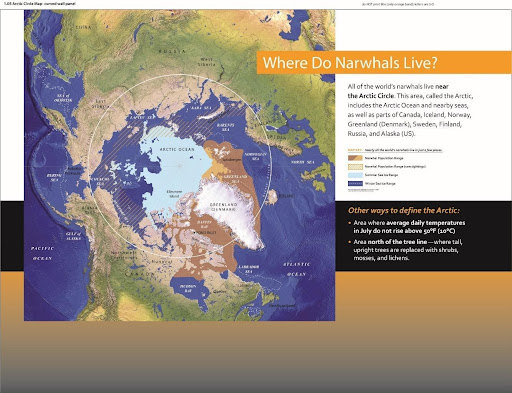
One of five maps that form part of the “Narwhals: Revealing an Arctic Legend” exhibit at the Smithsonian National Museum of Natural History (now a travelling exhibit!)

The museum environment presents some unique challenges for a cartographer. In a museum setting, maps need to be designed to communicate with the general public, synthesizing and presenting complex information for an audience that may be unfamiliar with the subject matter. This differs from research-focused work, which typically requires static printed maps that adhere to the strict guidelines of academic journal and book publications, and is typically viewed by experts in that particular field of study. For museum exhibits, cartographers need to employ careful design techniques to make maps informative and engaging to diverse audiences of all ages. These techniques result in maps that vary widely in format, from traditional static poster maps to animated and interactive maps that tell dramatic stories or serve as learning tools. Commenting on some of the unique challenges in today’s “pandemic era”, Dan notes that virtual online exhibits have made the use of web-mapping and interactive maps more commonplace.

“For the immediate and long-range future, I see greater use of static, animated and interactive maps online for public education on a variety of topics, with less interactivity in-person.”

Dan continues to oversee GIS support and teaching for staff at SI. He greatly enjoys the opportunity to work on diverse projects from a variety of interesting areas of study. As the GIS Coordinator at SI, he now covers over 400 GIS and satellite image processing users, plus over 500 story map writers and developers, including staff with very little knowledge of geography, cartography, or GIS. His passion for map-making remains to this day, and his maps continue to be enjoyed by visitors from around the world. An educator at heart, Dan has some parting advice for any students or young professionals seeking to break into the wonderful world of cartography;

“The advice that I give to nearly everyone interested in a cartography or GIS career is: while you’re still in school, plan to get a minor or double major in the field that interests you. Get a broad-based education that enables you to serve your clients in any field and join professional and academic organizations to expose yourself to others’ work. Most importantly, even once you are employed, never stop learning!”
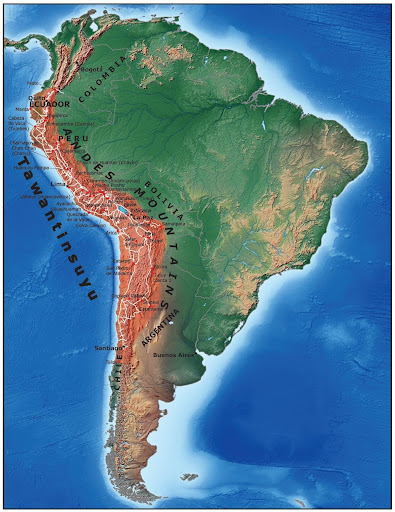
“The Great Inka Roads” – One of 15 maps created for the exhibit at the Smithsonian National Museum of the American Indian

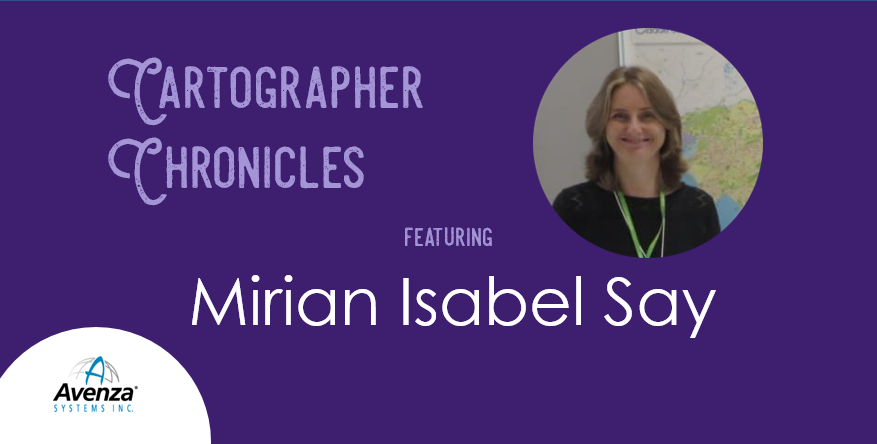
Cartographer Chronicles: Mirian Isabel Say

Cartographer Chronicles - Mirian Isabel Say

Brazilian-based cartographer, Mirian Isabel Say, has two passions: making maps and traveling. Lucky enough to live in a large, diverse, and beautiful country as Brazil, she has extensively traveled through it to gain inspiration for personal growth and to find influences for her map designs. As an idealist, Mirian considers maps as works of art, not merely used to perform a singular function. Especially in a natural resource-rich country like Brazil, she believes that maps can help change the lives of its users, transcending the use of maps from a purely commercial purpose to a purpose that is appreciated and acknowledged.

For Mirian, the map design process is a huge personal journey, and having the right tools can be the difference between a published map and a map left unfinished on the computer. When Mirian began her cartography career in 1992, her choice of existing graphic design software was limited and didn’t include suitable tools specific to mapping. Even as the software improved, it didn’t support any of the commonly used geographic data file formats and she was limited to importing data that was not spatially referenced. For example, to accurately create a map scale by hand is very complicated—as any well-trained cartographer knows—and the functionality to do it digitally wasn’t available. Exporting to other cartography formats was not feasible since maps were not georeferenced. Symbols and labels were placed individually, often taking many hours of labour.

By 2004, graphic design and GIS software had become more advanced. Mirian learned about MAPublisher in-person at a GIS and mapping trade show and immediately liked how the many cartography and GIS tools were seamlessly integrated into Adobe Illustrator. She believed she finally found a cartography product that would be an all-in solution. When she returned home, she continued working in her existing graphic design environment, but continued to experience the many shortfalls of it. After some careful planning, she decided to take the leap and jump in headfirst to acquire MAPublisher and Adobe Illustrator.

Any major changes to a workflow including one that involves new software can be difficult at the beginning. Mirian began to adapt from her older graphic design software and learned the new MAPublisher toolsets through Avenza resources and working with the Avenza Support team directly with questions about workflows and best practices. “My type of work is not very common in Brazil and there are few engineers and cartographers who do it. Many years ago, I received professional critiques that my maps were beautiful but not accurate enough. Today, I’m very glad to say that I can create maps just as beautifully and more importantly keep them accurate.”

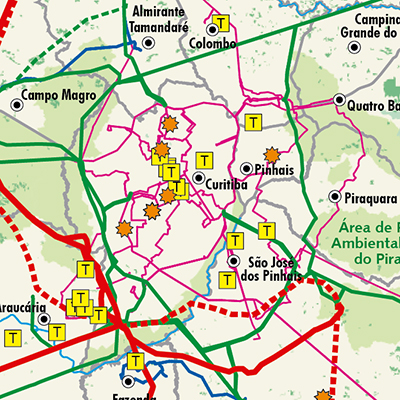
Vulnerabilidade      SJDR

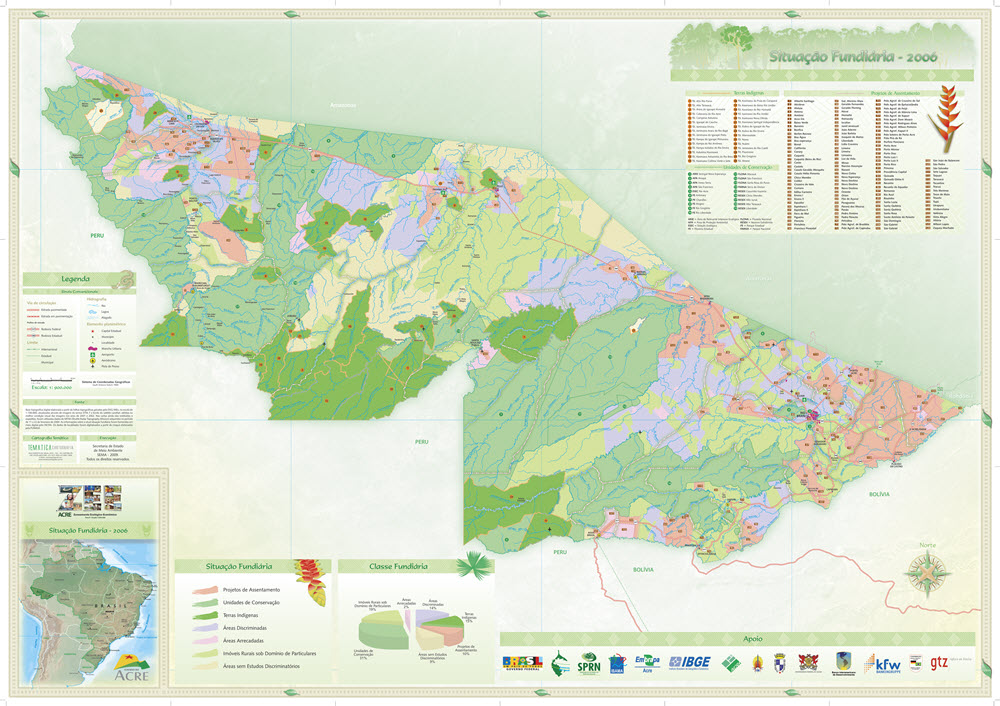
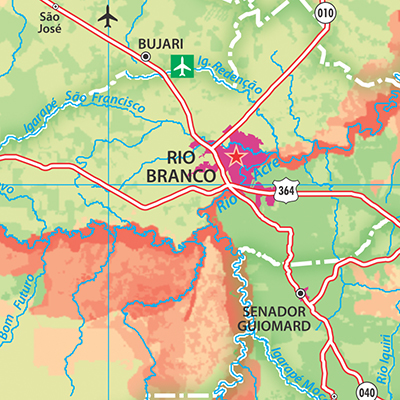
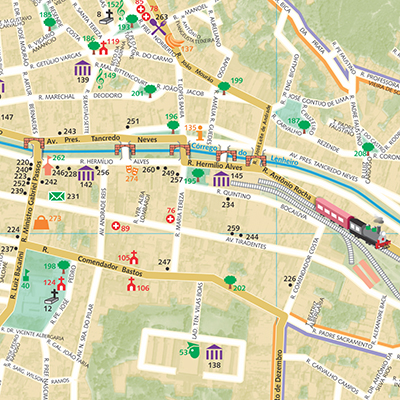
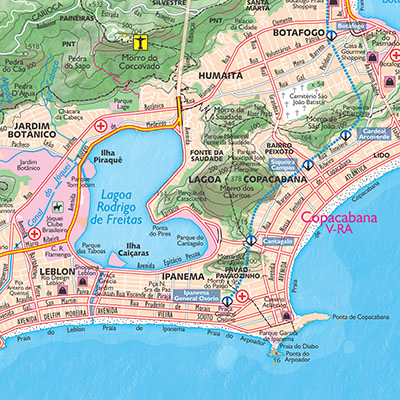
Mirian’s style of mapping is an immersive experience. When hired to produce indigenous and environmental maps for the Brazilian state of Acre government, she researched the region’s geography, read about its natural resources, and made a trip to visit to explore the culture, people, and food. She says she hopes that others can also see the human side of geographic space as she portrays it in her maps and that maps can provide not just information, but social change. She believes that her connection to and experiences of places make her a better cartographer. When she created the official tourism map for the City of Rio de Janeiro, her home city, she wanted to be “in the present” and decided to explore areas of the city intimately by foot to visit museums, beaches, and landmarks. The City also helped her understand the scale of the area by helicopter – a definite highlight in her career. The result was an appreciation of the city’s colour palette expressed on her map. “The sea was light blue, the green forests were intense, and the rock formations were magnificent. Rio de Janeiro is a very sunny and cheerful city so I used cheerful yellowish-green colors.”


Mirian continues to produce maps for many clients and has had her maps featured in several publications. She has also taught several post-graduate cartography courses at universities and lectures on cartography techniques and the importance of using the best cartography tools available.


Cartographer Chronicles: Mike Boruta

Colorado-based cartographer Mike Boruta knows a thing or two about making maps. In fact, this award-winning cartographer has been designing spectacular maps and trail guides for more than a decade. His work can be seen in the National Geographic Trails Illustrated series, in mountain biking guides released by Fixed Pin Publishing, fly-fishing reference maps curated by Stonefly Press, or most recently in the hiking trails guide for the mountainous town of Ouray, Colorado, where he currently lives. Always fascinated with viewing the world from above, Boruta has dedicated his career to capturing the beauty of mountain landscapes through well-designed maps, and captivating cartographic styles.

Following several years of post-university travel, Boruta found himself living in the tiny tourist-driven town of Ouray. Seeking more opportunities for career advancement, he moved to Arcata, located on the north-western coast of California. He considered returning to school to pursue a computer science degree but realized the subject matter did not entirely excite him. That was when a coworker of his first told him about the excellent Geography and Cartography programs at Humboldt State University nearby. He learned about a subject-stream called Geographic Information Systems (GIS), and although having never heard of GIS before, the concept immediately interested him. His years of travel had given him quite an appreciation for maps, and the GIS and Cartography programs at HSU would allow him to combine this appreciation with an interest in computer technology. 

He quickly developed a passion for cartography and decided to pursue graduate schooling in Athens (OH), where he studied under established cartographer Dr. Margaret Pearce. Forever drawn back to the rugged mountain landscapes where he had lived in the past, Boruta found a particular interest in studying relief representation in cartography, the technique used to create the illusion of 3D-terrain on a 2D map. He fell in love with the work of renowned Austrian cartographer Heinrich Berann, whose painterly style “birdseye” mountain maps continue to inspire him today.

 “Anytime I had to choose a place to use for projects in my cartography or GIS classes I found myself pulled back West, usually to Ouray, Colorado. I grew increasingly interested in mapping mountainous places”

In 2009, Mike Boruta first began using Avenza MAPublisher in his work. He had recently won the Arthur Robinson Award for Best Printed Map, part of the CaGIS Map Design Competition, for his entry “The Million Dollar Highway”, which explored a scenic stretch of road connecting Ouray to Silverton, Colorado. The award included a student license for Avenza MAPublisher software and allowed him to seamlessly integrate its suite of cartography tools into his already Adobe Illustrator-heavy mapping workflows. Shortly after, he began working with the publishing company Fixed Pin to create a mountain-biking guidebook for the entire state of Colorado. The project was extensive and would require the creation of several complete and detailed map sets, each describing a unique part of the state. Recognizing the vast scale of work ahead of him, Boruta sought out mapping solutions that would help him enhance the efficiency of his cartographic workflow. 

 “This was the first time I really got to work with MAPublisher, and it was a joy to learn and to use. I immediately found out how useful it was to set up all my graphic styles and character styles since I was having to create 118 maps with the same look and feel.” 

As Boruta found himself less and less dependent on dedicated GIS software, he opted to focus on completing his projects from start to finish directly in Adobe Illustrator using the many data import and manipulation tools of MAPublisher. This environment, he felt, “lent itself to so much more creativity”. Integrating these mapping tools into his workflow also meant he did not have to continuously replicate shared design features between each map, instead organizing and stylizing his data into a series of 15 “master maps” and using the MAPublisher Vector Crop tool to create separate individual maps for specific regions. 

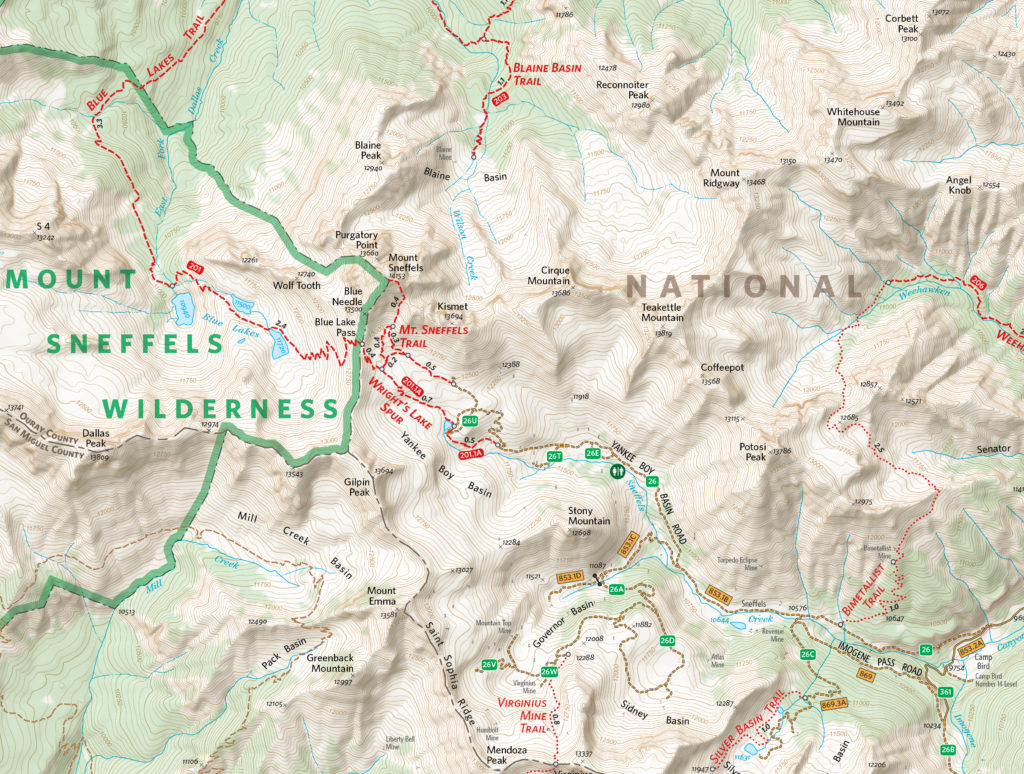
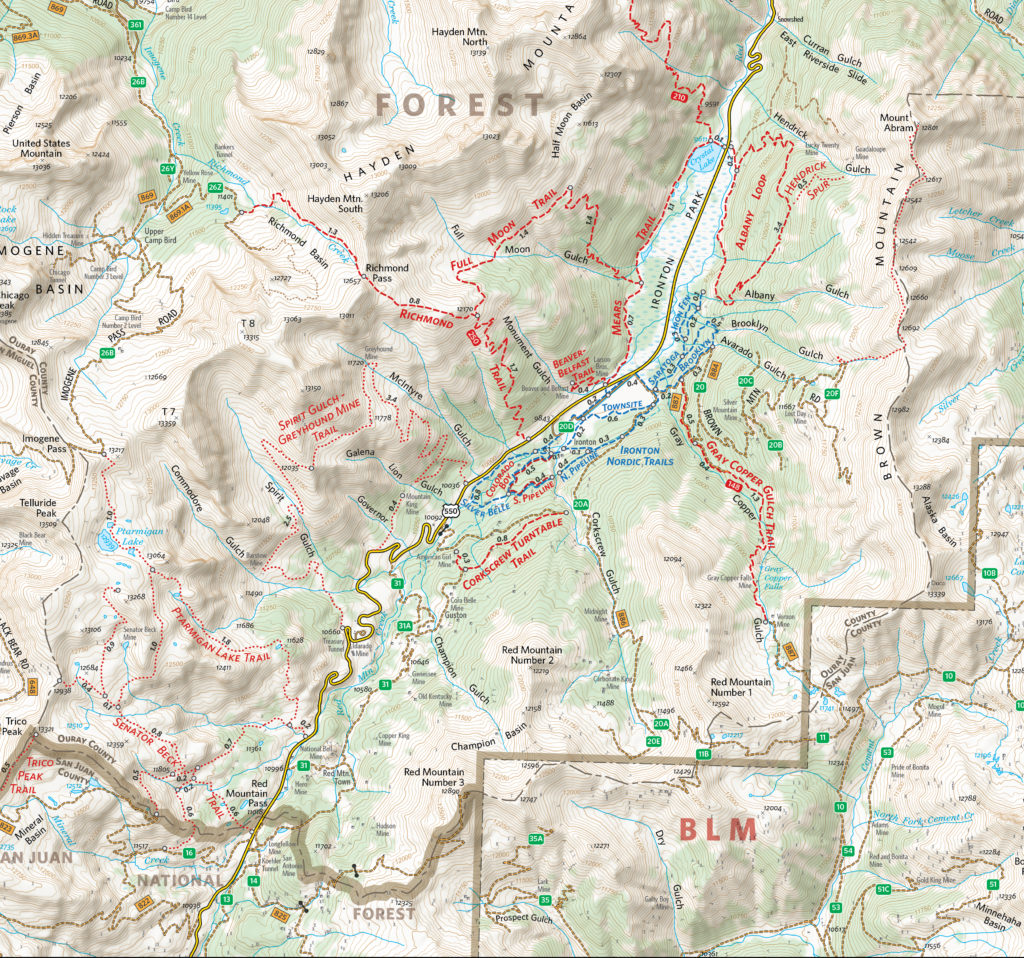
By 2011, Boruta had begun contract work with National Geographic to help produce maps for the Trails Illustrated line of topographic map products. Incredibly, in 2013 things aligned in such a way that he was able to once again move back to Ouray, the mountain-town he had fallen in love with many years earlier. There, he began meeting with the volunteer-run Ouray Trail Group (OTG) to discuss how he could help them improve their existing trail map, which is a major source of funding for the non-profit group. The first project was getting their map into the Avenza Map Store so that hikers could use the map on their phones and tablets. After that, it was clear that the newly created and extremely popular hiking route called the “Ouray Perimeter Trail” needed its own high-quality map. 

Finding some free time in the summer of 2020, Boruta dedicated himself to fully revising the Ouray Trail Group’s main trail map and also creating an all-new map for the Ouray Perimeter Trail. His vision included a highly-detailed, topographic map showing the entirety of the county’s vast trail system. He set to work collecting datasets and planning the map production, first using dedicated GIS software, before reverting to a more design-focused workflow in Illustrator. 

“I quickly moved things into Illustrator and MAPublisher and never looked back. There are certain tasks I’ve grown used to doing in MAPublisher that I just find so much faster and simpler to do than if I were in ArcGIS or QGIS”. 

As is common with many mapping workflows, working from mixed data sources can be a constant challenge for many cartographers, especially when data from different public agencies do not share the same projection and coordinate systems. Boruta found this to be a common occurrence while working on his OTG trail maps and highlighted his fondness for being able to drag and drop data into different Map Views directly within Illustrator. In this way, he allowed the software to automatically reproject datasets to a shared projection without having to open up any sort of tool or repeatedly configure data parameters. 

Boruta also emphasized how powerful the Vector Crop tools and “spatial filter on import” capabilities were, allowing him to quickly specify or delineate a region of interest and immediately crop all data layers to that area, retaining topology and attribute integrity, all within the Illustrator environment. When handling the reference maps used to guide the creation of the OTG trail maps, he implemented the Georeferencing tools in the Avenza Geographic Imager plug-in for Adobe Photoshop to efficiently georeference and georectify unprojected reference map images before integrating them back into his Illustrator project. After a large chunk of the summer working on the map, he delivered the finished trail map. On completing the project, he noted “It was one of the most satisfying projects I’ve ever worked on since I was literally mapping my own beloved backyard.”

The completed Hiking Trails of Ouray County and the Uncompahgre Wilderness map is available in printed form, and users can also purchase digital forms of that map and the new Ouray Perimeter Trail Map in the Avenza Map Store. The digital maps are fully geo-enabled and support offline use for navigation and GPS-location on mobile devices using the Avenza Maps app. 

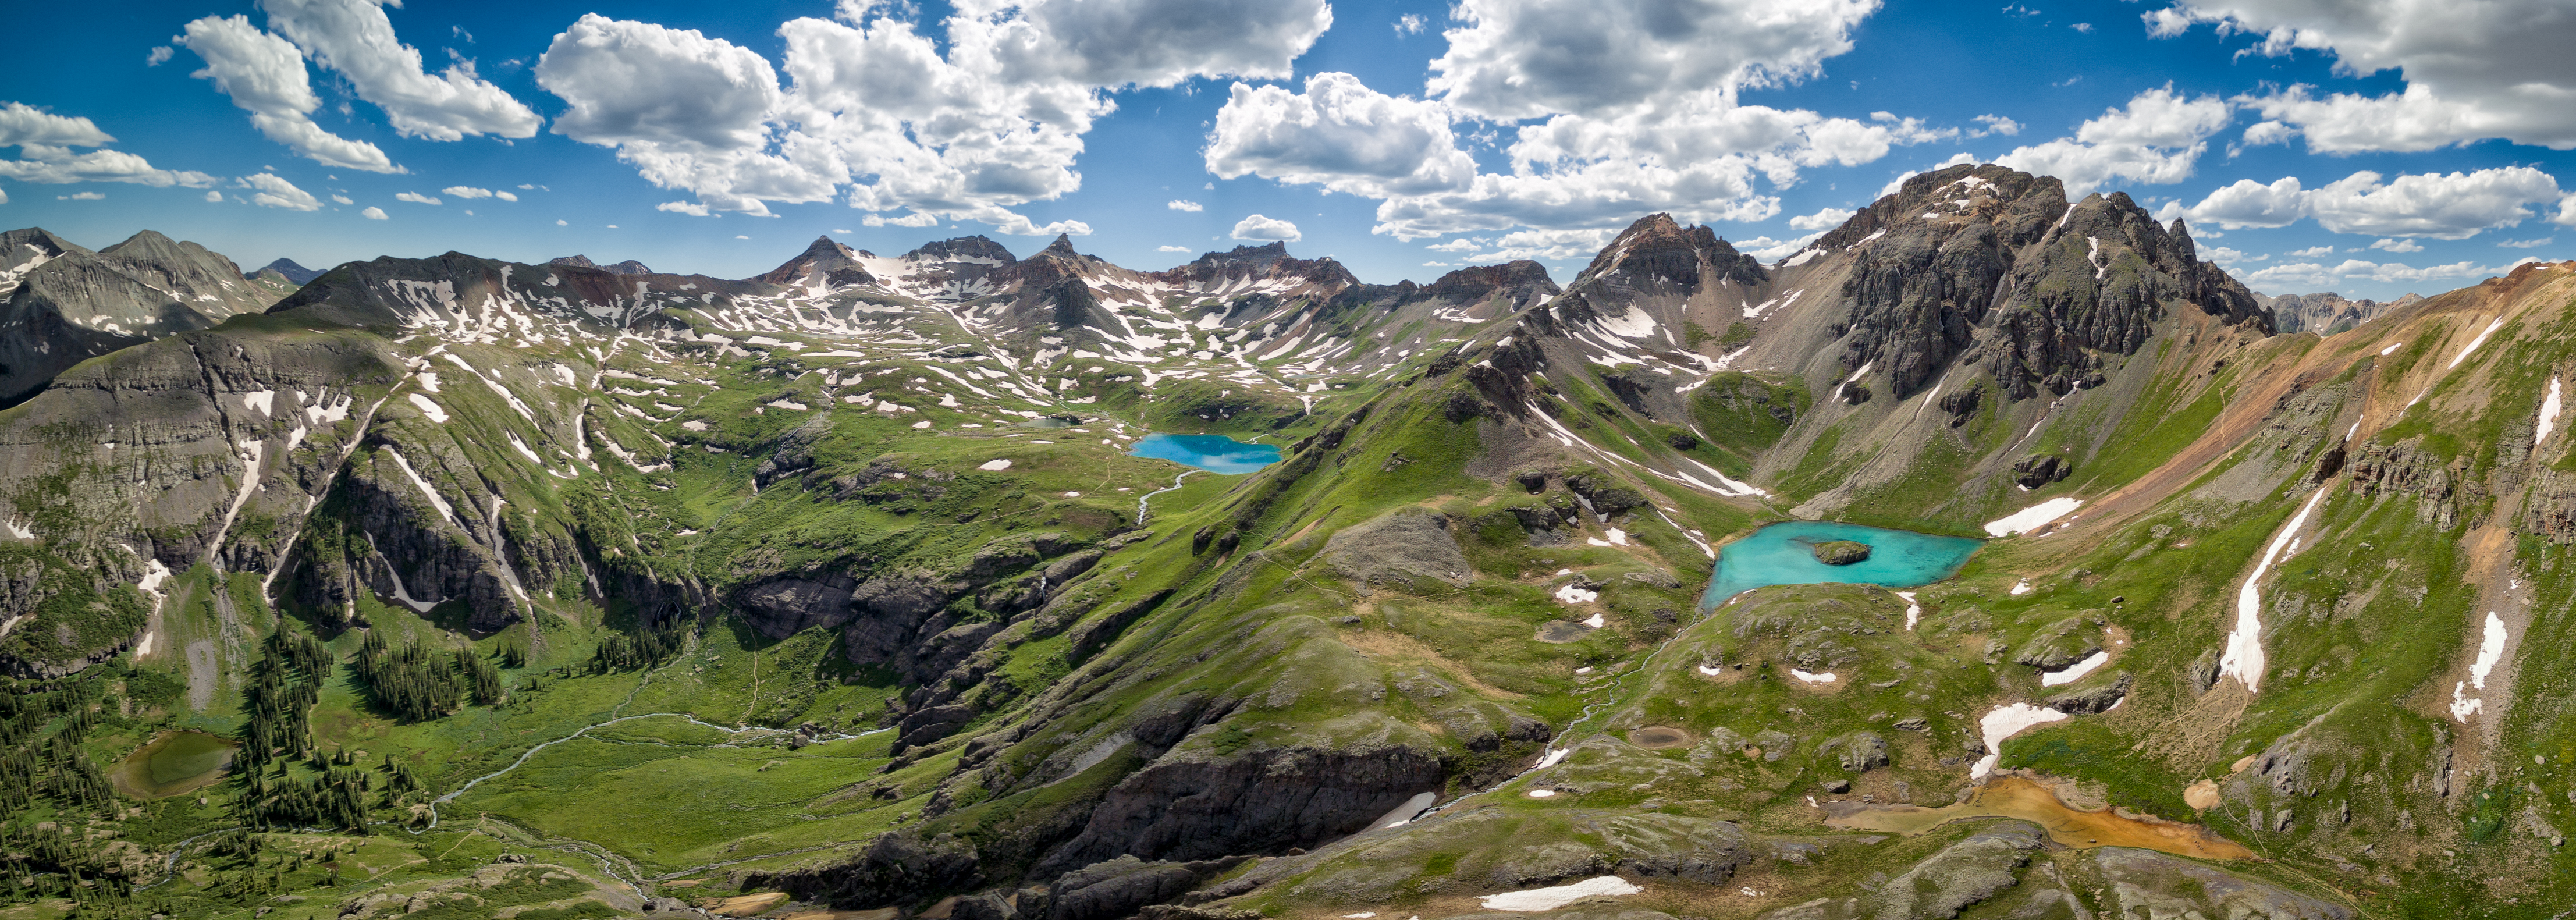
Mike Boruta still lives in his beloved town of Ouray. He spends his free time enjoying the trails and mountains which he has helped to map. He continues his work for National Geographic and has branched out his interests to include drone photography and videography. He operates the website OuraybyFlight.com, which showcases some of his spectacular drone photography work. His dream is to combine these dramatic landscape panoramas with overlaid symbols and text to create those iconic “birdseye” mountain maps that inspired him years ago. 

“I envision something that would hopefully be more aesthetically pleasing, something that aims to capture the soul of these San Juan Mountains while also illustrating the geography. And just maybe it might also be something pretty enough to hang on the wall.”

News Archive