Up to MAPublisher 8.2, the MAPublisher Buffer Lines function was limited to only Line features. For MAPubisher 8.3, a revised buffer function called Buffer Art can be performed on both Line and Point layers. Buffer Art allows you to enter one fixed value to either all or the selected art in one layer or the values from an attribute column in one map layer.
Example 1: Applying a static value for the buffer width
Below is the new Buffer Art dialog box. I have one MAP Point layer with a location of a strong earthquake recorded in India n May 31, 2010.
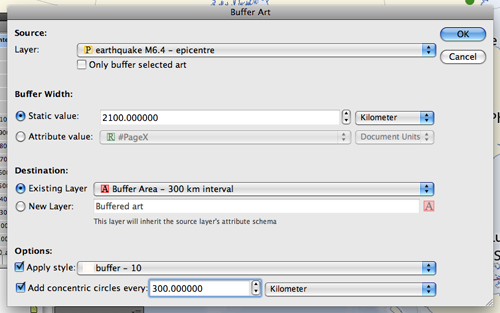
I specified a value of 2100 Kilometer as the distance to buffer from the epicentre (the origin of the earthquake). The buffered art will be placed in the existing destination layer Buffer Area – 300 km interval.
For the buffered area, a pre-designed graphic style will be applied.
Lastly, I enabled the Add concentric circles every: option. This option will generate evenly spaced rings around the points within the buffered area. I am selecting 300 Kilometer for each concentric circle distance. It will generate seven concentric circles within the 2100 km buffer. As a result, you can see that a concentric ring is drawn every 300 km from the epicentre.
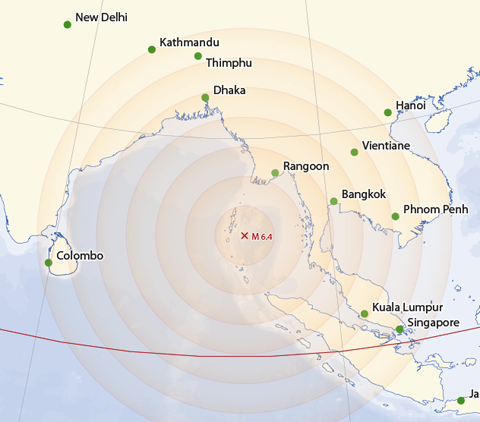
Example 2: Applying values from an Attribute Column for the buffer width (Creating Graduated Symbols for every point)
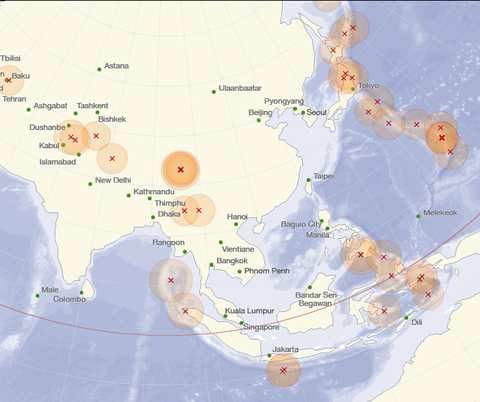
I will use another point layer this time. I have one MAP Point layer with the point information of earthquake epicenters. The size of the buffer width in the page unit (pixel) was calculated based on the size of the magnitude for every point in the layer. Those values under the BufferCircle column will be used for the buffer width.
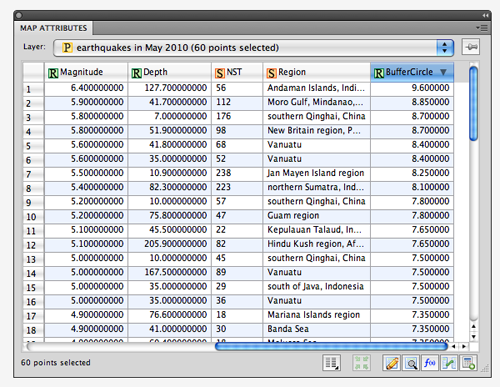
Now, the Buffer Art feature will be performed with those calculated values for the buffer width.
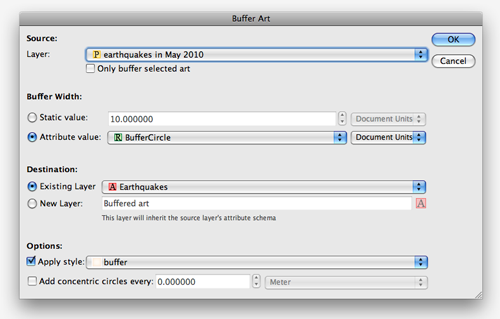
The Attribute Value option is chosen and the BufferCircle field for the Buffer Width.
As a result, every buffered area (circle) has a different size. Also, the graphic style selected for the buffer art had some level of transparency applied. You can see the darker color when the buffered art overlaps each other. In other words, the region where the dark orange is observed experienced earthquakes more than once.
Buffer Art can be applied to many situations such as around parcel lots, around road or highway lines or even creating them to find intersection proximity between map features. Experiment with your own to find out what is most useful for your own data.


