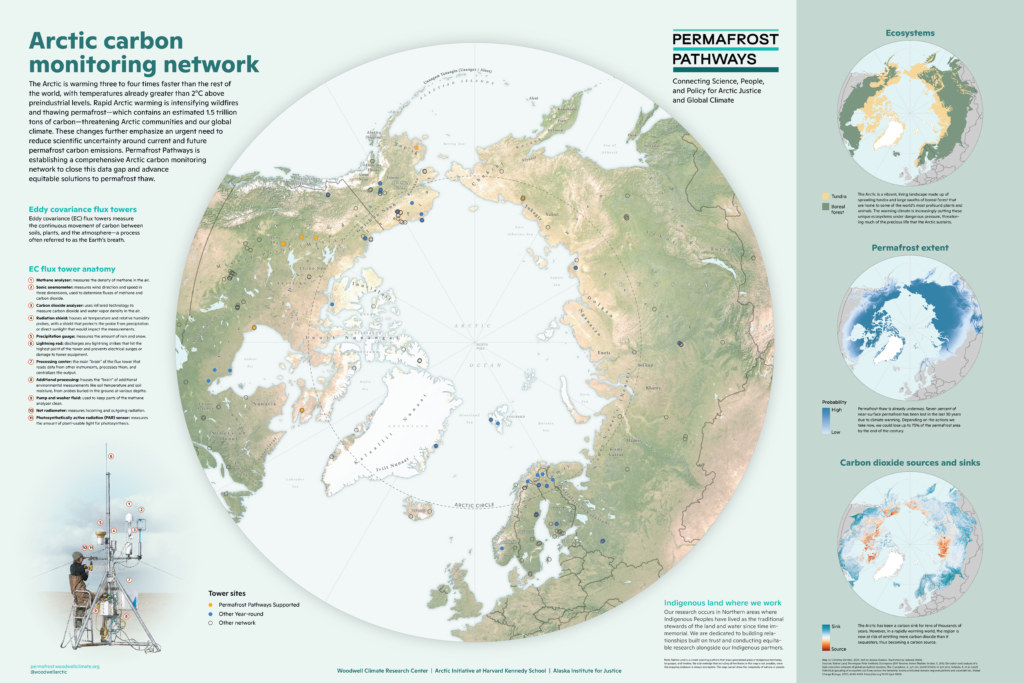
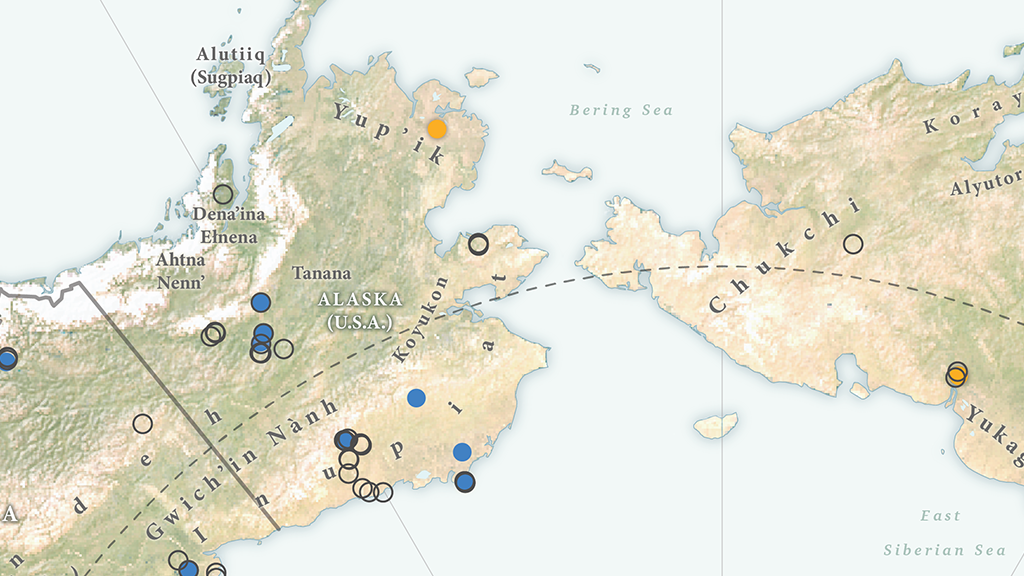
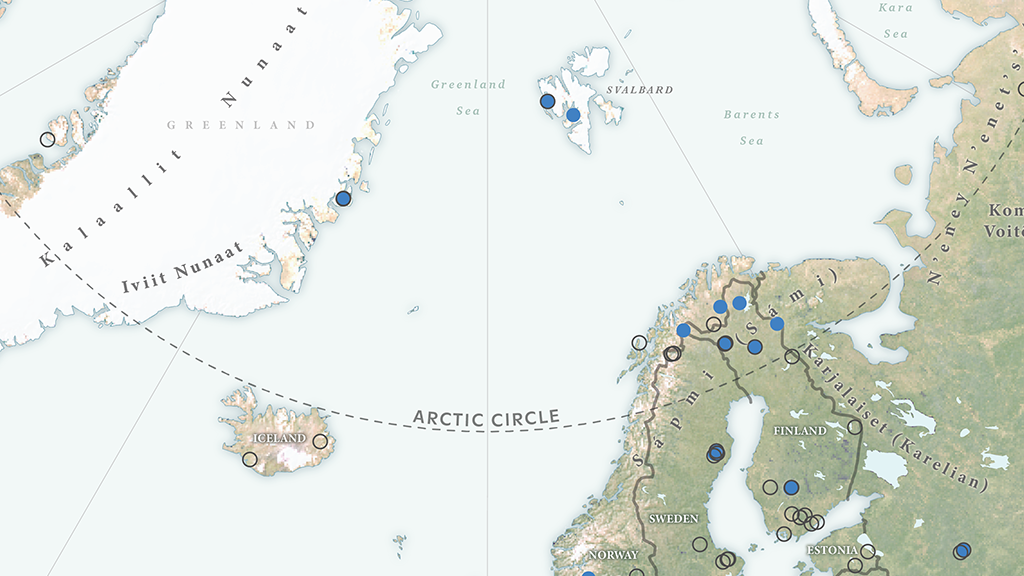
In our first Map Spotlight of the year, we are showcasing the winner of the 2023 Avenza Map Contest: Arctic Carbon Monitoring Network by Christina Shintani, with additional contributions from Jessica Howard (text content) and Julianne Waite (illustration). This map shows eddy covariance flux tower locations in the Arctic that measure the continuous movement of carbon between soils, plants, and the atmosphere. This process is often intriguingly referred to as the Earth’s breath. These towers collect data that is crucial to establishing a comprehensive carbon monitoring network in the Arctic region, which will assist efforts in advancing plausible solutions to curbing permafrost thaw.
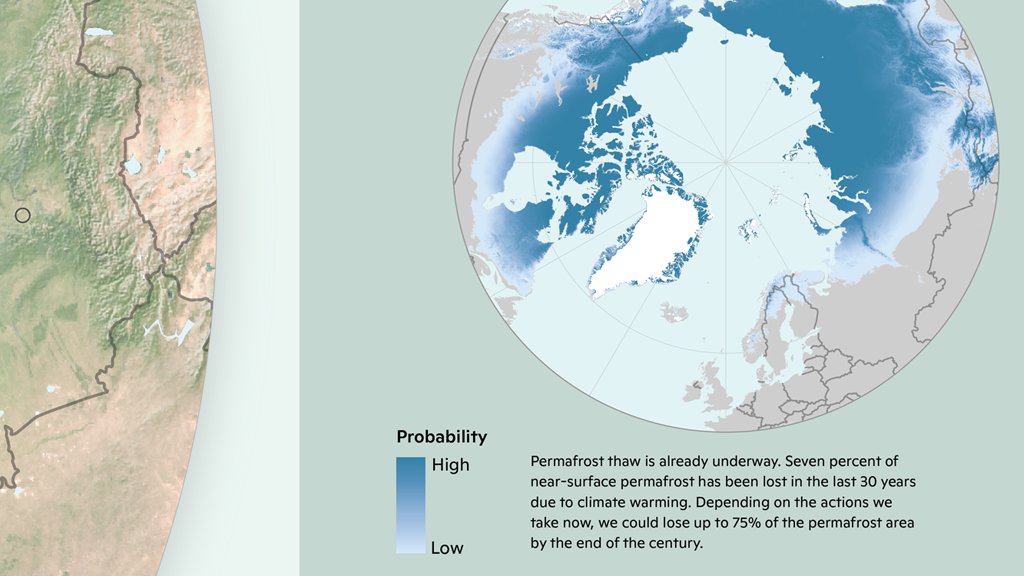
A warming Arctic contributes to intensifying wildfires and permafrost thaw, both of which in turn contribute to increased carbon emissions, which is a serious environmental concern. The supporting maps explore the various implications of what is at stake as the Arctic warms three to four times faster than the rest of the world: the Arctic ecosystems at risk, the extent of permafrost thaw, and the shifting of the Arctic from a carbon sink to a new source. Maps like Christina’s are helpful in allowing people to visualize and further understand the progressive impacts of climate change.
Check out more of Christina’s maps on her website, and learn more about the work of Permafrost Pathways here.
Select the images below to see a detailed look at Christina’s map
Making the Map
Christina used both MAPublisher and Geographic Imager tools in the creation of this map. Christina used the Import tool to import the data files she processed in another program, such as QGIS. Following import, she used the MAP Views panel to set up the map scale and projection of the document. Since this map required a polar map projection, the MAP View Editor was also used to reproject data layers from different coordinate systems.
Christina also employed MAP Themes in the creation of her map. Stylesheet Themes were used to symbolize the data on both the main map and supporting maps. These stylesheets could then be used to create legends for the respective maps.
In Geographic Imager, Christina opened her raster data using the Advanced Import, which contains several geoprocessing tools to adjust, crop or transform her imagery before importing it. This can be especially helpful when working with large datasets that may slow the program down if they are not cropped or downsized in some way. She also used the Transform feature to reproject images where necessary.
See the winner announcement for the 2023 Avenza Map Contest here, and check out our other Map Spotlight blogs here!


