What is the #30DayMapChallenge?
Since 2019, each November has been host to the annual #30DayMapChallenge. The challenge was started by Topi Tjukanov as a way to get the cartography and GIS communities to come together and share maps, exchange ideas, and start conversations about mapping and spatial data. Since then, this friendly competition has grown, with thousands of maps being made and shared by map-makers from all over the world, and from a wide range of experience levels.
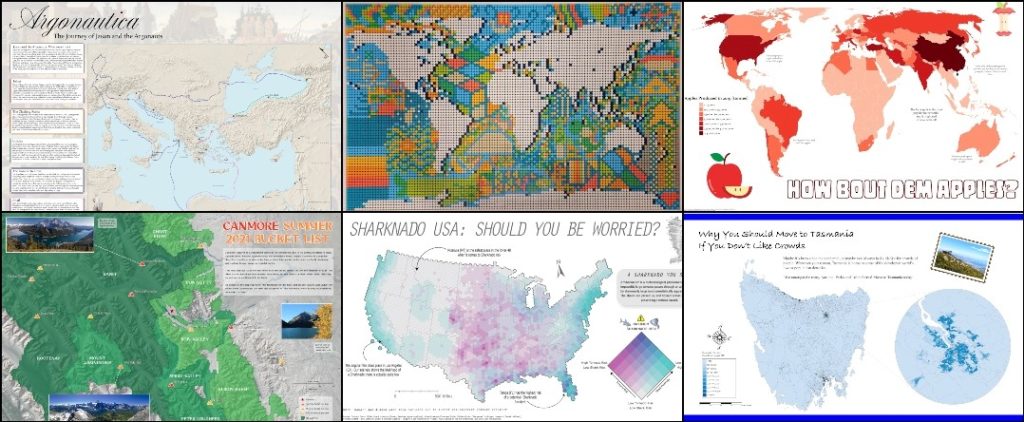
The rules are simple: A specific theme is assigned to each day of November and the goal is to create a map each day that matches that day’s specific theme. Most important of all, this is a friendly challenge! The idea is to have fun, share maps with the carto-community, and hopefully learn something in the process! Here at Avenza, the challenge meant an opportunity to get together as a team and challenge ourselves to try something new. We have map-makers from all experience levels try their hand at making some maps, and we shared our favorites on the Avenza Twitter feed.
Today marks Day 30, and the end of this year’s challenge. The theme for today is “Metamapping”, with the objective being to reflect on the overall experience and discuss what we mapped, what we enjoyed, and most importantly, what we learned. We’ve collected some thoughts from a few Avenza Team members who participated by asking them a simple question: “What did the #30DayMapChallenge mean to you?”
***
“An opportunity to get creative” – Rebecca B
I love making maps, and when the #30DayMapChallenge came around this year. I knew I had to participate in some way. I’ve spent a lot of time making maps with Avenza software, and some of my favorites were turned into tutorial articles on the Avenza Resources blog. You can see a handful of them here and here.
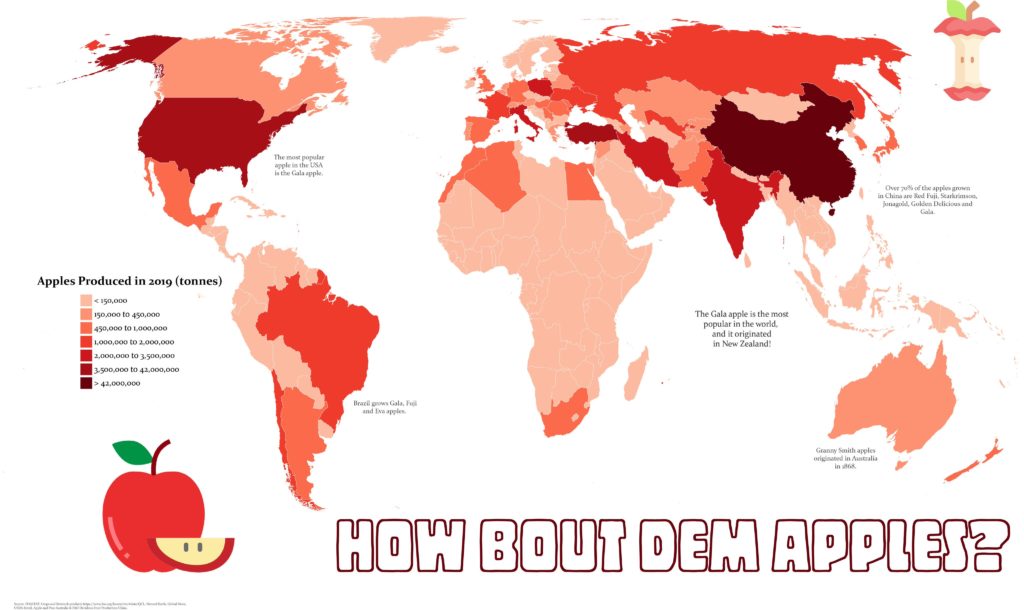
My first challenge was to create a map that fit the “red” theme. Of the three color-based themes in this year’s challenge, red spoke to me the most. Perhaps it’s because it’s a color not prevalent in nature (blue and green make me think of water and vegetation), meaning I could create something that stands out a bit more. For me at least, red immediately makes me think of apples, so I set out to create a map showing apple production worldwide. As is so common with map-making projects, oftentimes the hardest part is finding good-quality data. Luckily for me, the UN Food and Agriculture Organization houses some fantastic datasets on global food production. Using the Join Table tool in MAPublisher, I could link this tabular data to a polygon layer of countries I had imported into Adobe Illustrator. Finally, I used MAP Themes to create an appropriate red stylesheet to visualize my data, and just like that, I was done!
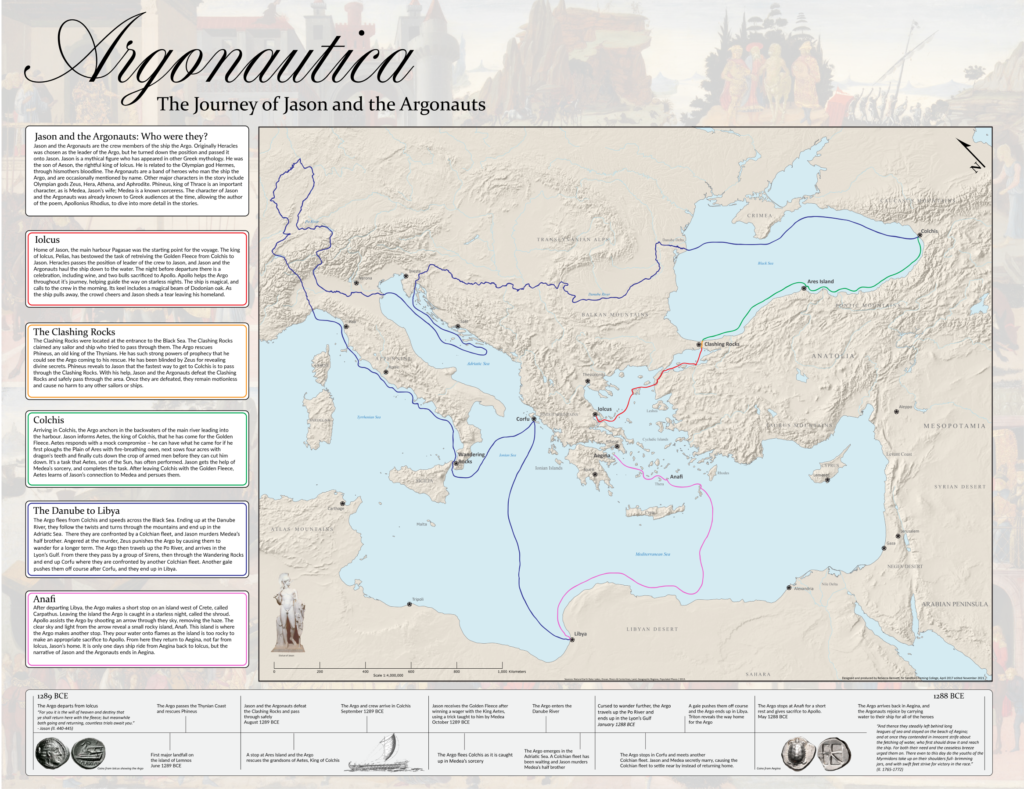
Next up, I took a shot at making a historical-themed map for Day 24 of the challenge. Now as a self-proclaimed history buff, I’ll never turn down an opportunity to do some research on the ancient world. For this theme, I chose to map out the mythical route of Jason and the Argonauts. If you’re from Toronto and you think “Argos” you probably think about the football team, but these are the original Argos. I actually started this map long ago for another project, but the #30DayMapChallenge got me inspired to revisit it and see it to completion. The route was all hand-drawn in Adobe Illustrator after meticulously cataloging and plotting the different locations in the legend. I was able to easily create map labels using MAPublisher LabelPro and overlaid the map layers onto a Natural Earth shaded relief base layer. While the map is physically the biggest part of the artboard, the story is what really drove me to create the map.
Looking back on this challenge, it’s a wonderful opportunity to get back into map-making. The #30DayMapChallenge is a great outlet to reignite that spark of love for cartography.
***
“A chance to learn a new skill” – Chelsey
Not all of us at Avenza are experienced map-makers! In fact, even though I often use maps in my everyday life, I haven’t had many opportunities to make a map myself. For me, the #30DayMapChallenge was an opportunity to learn, try new things, and (hopefully) create my first map!
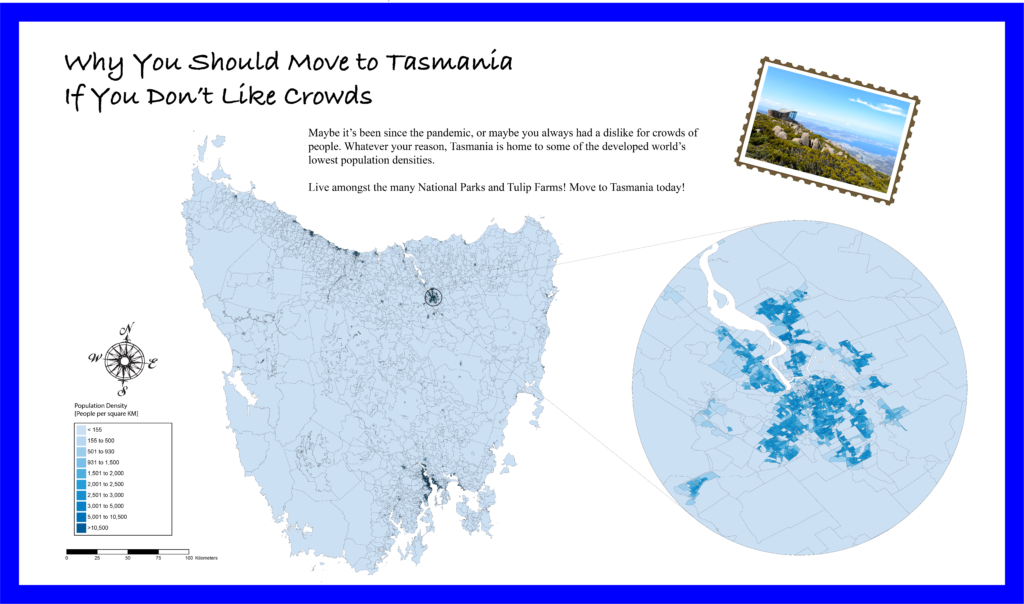
I was fortunate that the Avenza team included several experienced map-makers who were willing to sit down with me and teach me the basics of cartography. After a short crash course on “projections”, “coordinate systems” and the “fundamentals of working with spatial data”, I felt confident I could take my first steps in the world of cartography. Using some of the great tutorial workflows in the Avenza support center, I was able to get my first map dataset imported with MAPublisher. With a bit of help from my Avenza teammates, I was able to get a population dataset showing population counts for Tasmania. Something I quickly learned is that population data needs to be adjusted to account for variation in the size of each area of measure. I used the attribute expressions tutorial to create an expression that calculated the population density for each region rather than the raw population value. Finally, apply a MAP Theme to give the map some color, and add a few remaining stylistic elements with the native Adobe tools, and voila! My very first map is complete!
For me, the #30dayMapChallenge offered me a chance to learn some great new tools, and take a crack at making my very first map. I learned that making maps doesn’t have to be hard, and in fact can be quite fun! Being able to go from never made a map to “I made a real map!” in a matter of hours was incredible, and I can’t wait to try out these newfound skills on some other map projects!
***
“Not all maps have to be serious” – Spencer
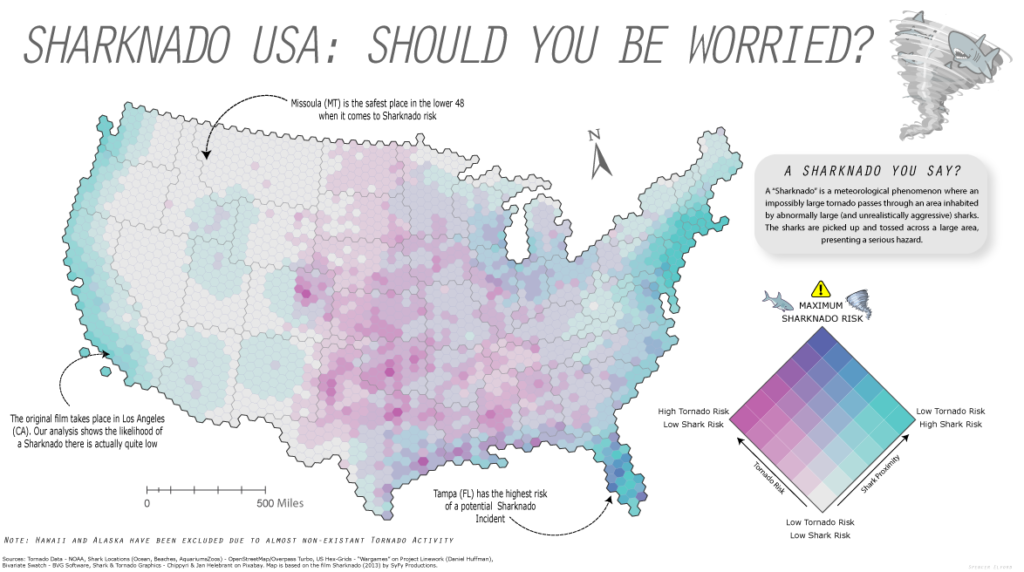
This year was my second time participating in the #30DayMapChallenge and once again, it was incredible to see the map-making community come together to share some really cool maps. I enjoy these types of challenges because they encourage new and experienced map-makers alike to try out new tools, learn some new techniques, and work on maps in a friendly, non-intimidating environment. For me at least, it was an opportunity to just have fun and try out some maps that were less serious in nature. Too often maps are only the result of intensive analytical processes or a product of complex data visualization. While these types of rigid workflows are still quite interesting to work on, it’s also good to step back and just have fun with the process instead of focusing on every detail in the workflow. For Day 4 – “Hexagons”, I did just that and put together a simple map documenting the “Sharknado Risk” across the US. I even wrote a tutorial blog about how I did it!
What I enjoy most about open-ended map challenges like #30DayMapChallenge is that they allow one to explore topics or datasets that they might not use in their normal day-to-day work. As many cartography and GIS folks know, the most challenging part of ‘making a map” often comes from deciding on a theme, and finding good data. This is especially true when you are restricted to a very specific mapping result or must adhere to strict design considerations. The #30DayMapChallenge removes some of these obstacles and provides an environment that encourages creativity and gets back to the real reason so many of us got into the industry – because we enjoy making maps.
***
