PLEASE NOTE: As of Photoshop 22.5, Adobe has discontinued support for the program’s 3D features. This may affect some or all elements of this blog. For more information, see Adobe’s FAQ page about this change and the Geographic Imager compatibility information page.
In the world of map-making, shaded relief refers to a visual technique that gives the illusion of three-dimensional terrain on an otherwise flat map. Cartographers use shaded relief to draw the viewer’s eye to prominent topographic features such as mountains, valleys and canyons. Using imaginary illumination sources and digital elevation data to cast directional light on a map, the cartographer can give the illusion of depth, casting shadows into valleys and lowlands, and highlighting ridgelines and peaks as if they are bathed in sunlight.
Historically, this technique was achieved entirely by hand and was extremely labour intensive. Now, with modern graphical software and digital mapping technologies, relief shading can be accomplished right on the desktop.
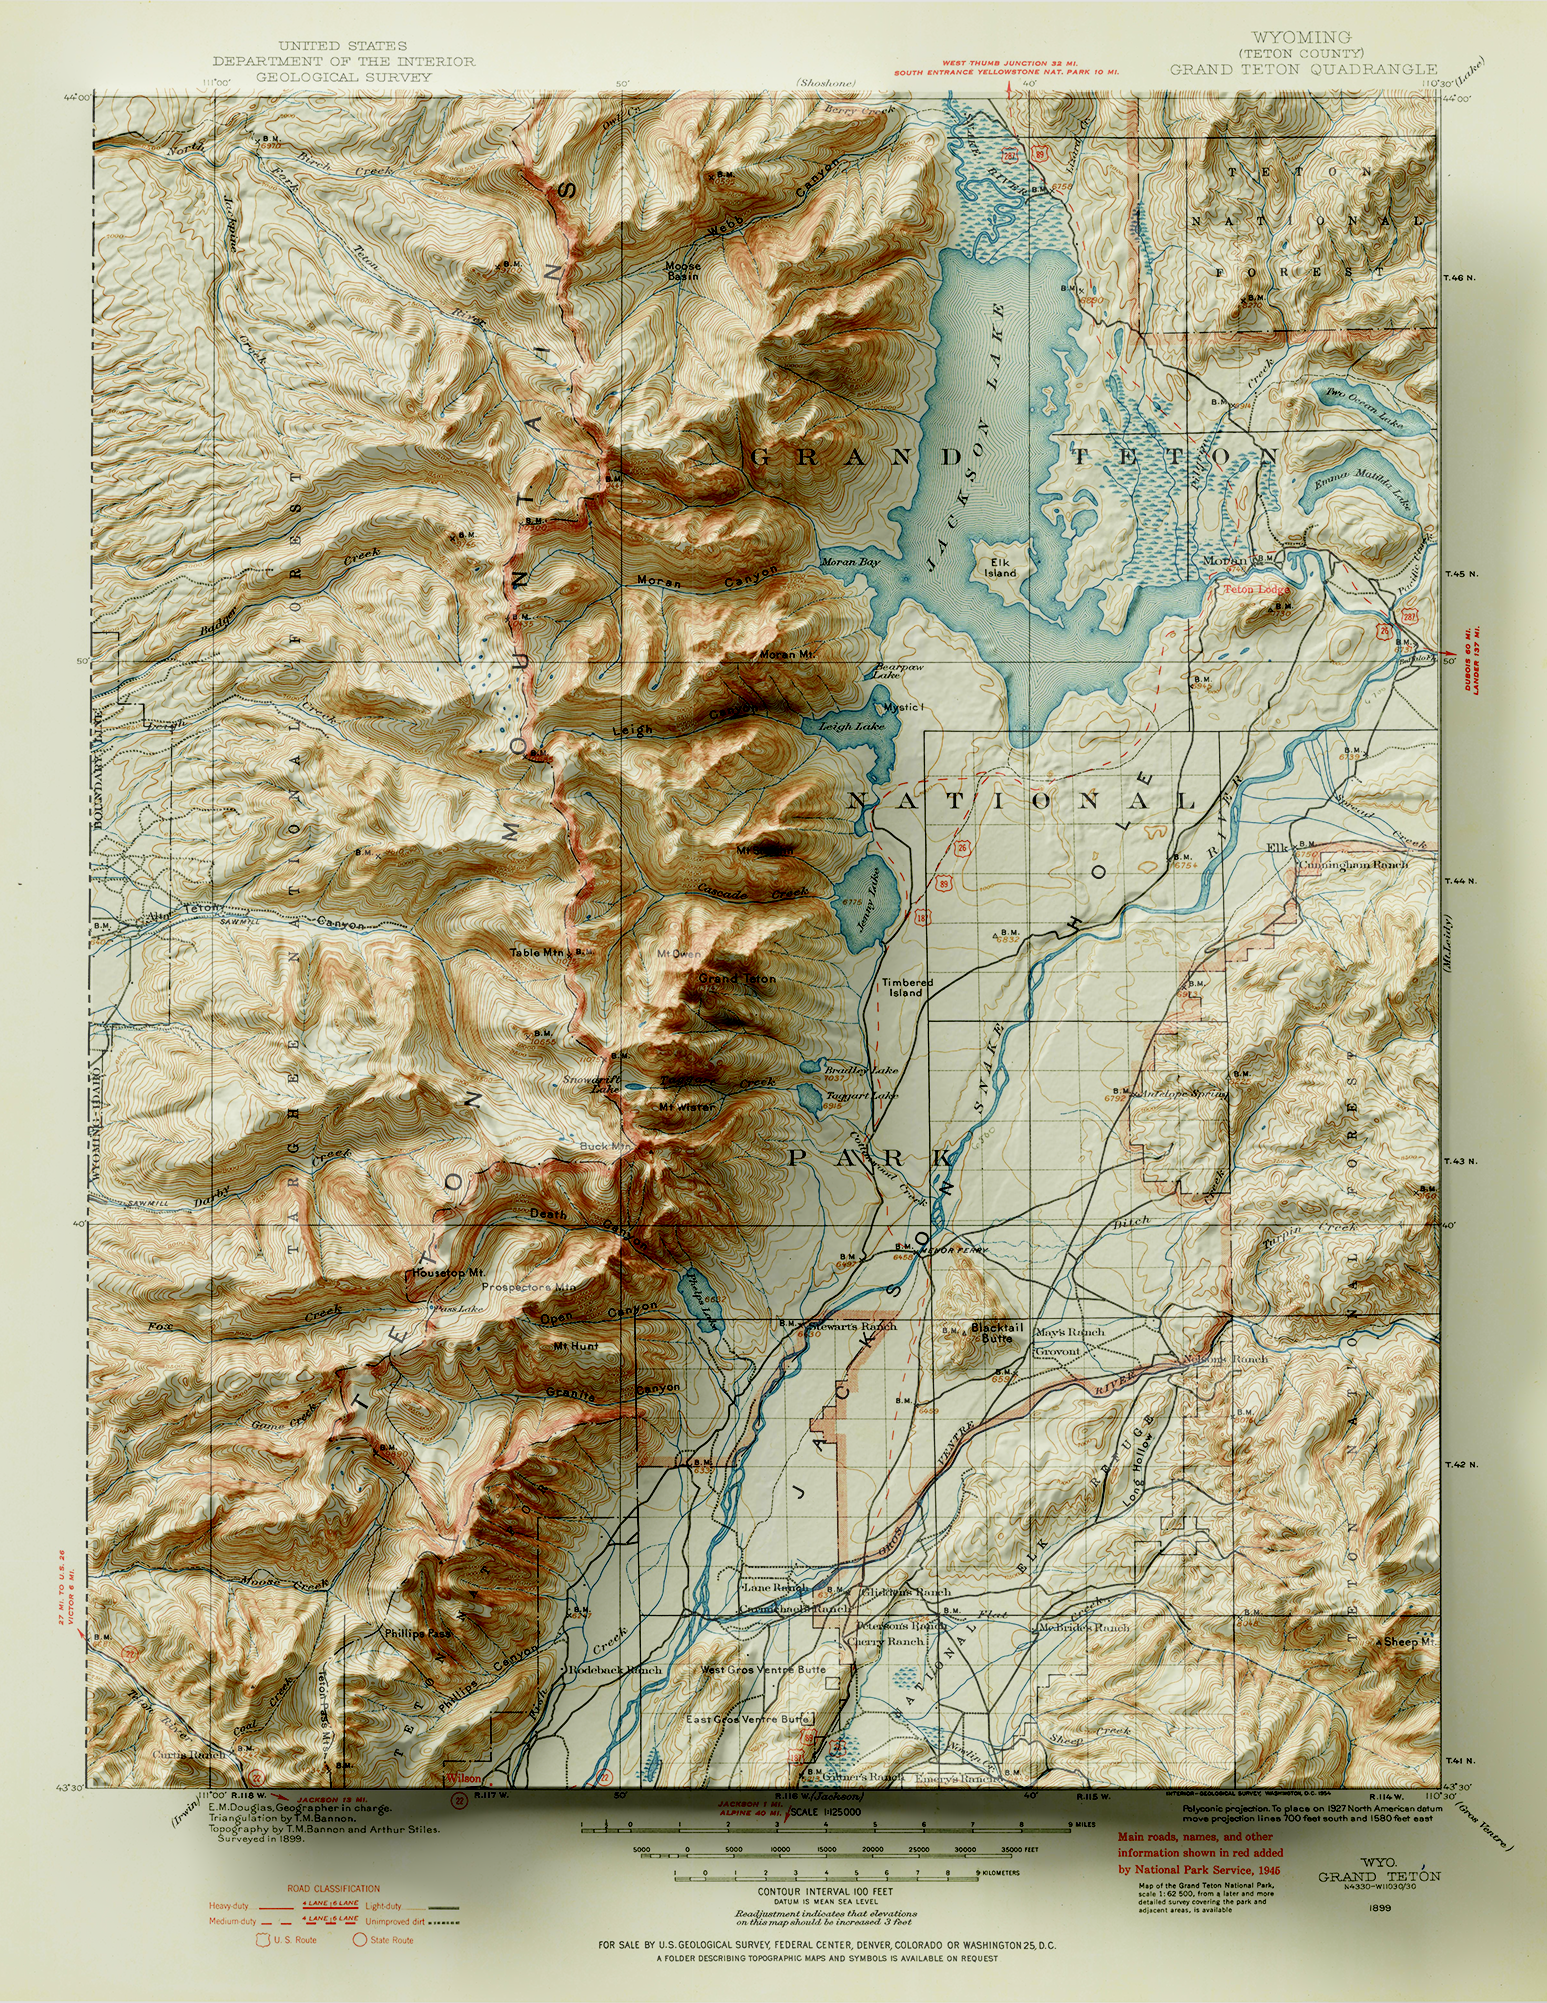
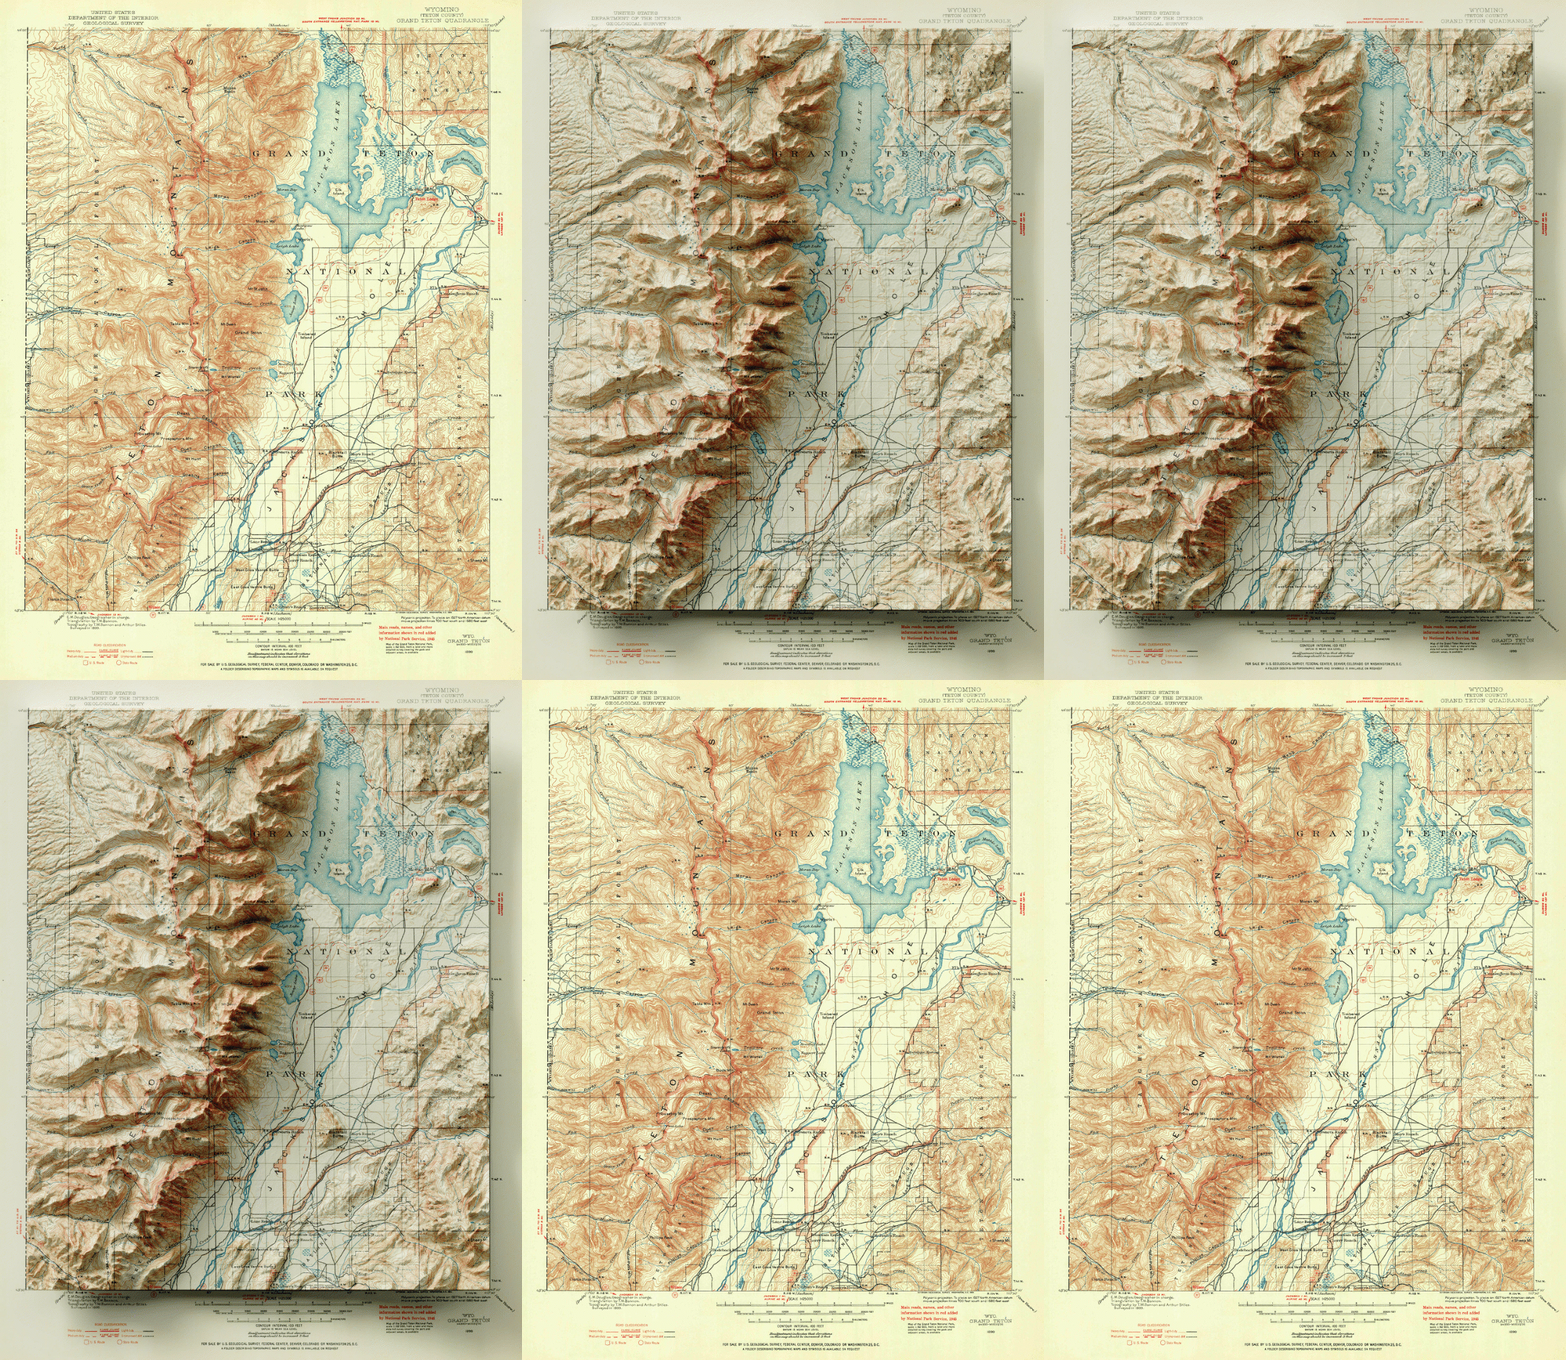
To demonstrate this, we are going to use the powerful spatial imagery tools and graphical design capabilities of the Geographic Imager plug-in for Adobe Photoshop to explore relief shading using a really interesting 19th-century historical map. Here is a sneak peek to show what the final product will look like.
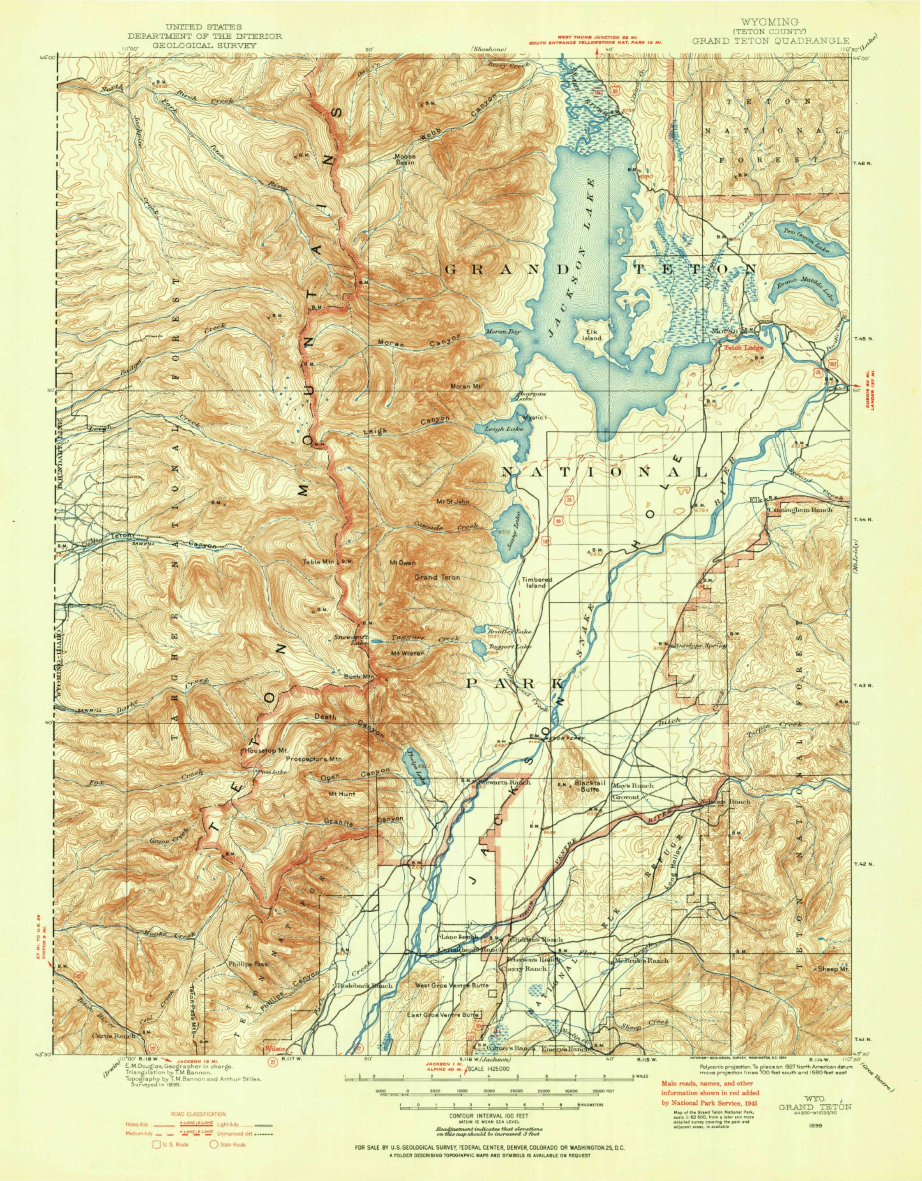
Let’s start with our original map. We have taken an absolutely stunning United States Geological Survey Map of the world-renowned Grand Teton National Park in Wyoming. Originally drafted by hand in the year 1899, the map features beautifully drawn contour lines and colour work showing the mountainous topography of the park and its surrounding area. The map, and thousands of others like it, are available in full-resolution on the USGS Historical Map Catalogue. Our goal will be to bring the map to life using three-dimensional (3D) relief shading techniques available with Geographic Imager and Adobe Photoshop.
First, we need to bring in some elevation data. Elevation data is critical for creating shaded relief, as it determines how light and shadows will behave in different parts of the map. We can obtain high-resolution digital elevation models (DEM) for our region from the USGS EarthExplorer.
Those of your familiar with spatial imagery data and DEMs will know that our first challenge will be working with tiled (discontinuous) imagery data products. In its raw form, DEMs are often stored as identically sized tiles, with each tile representing a specific indexed region of the earth’s surface. It is an unfortunate reality that many times the spatial extent of each DEM tile rarely matches the exact extent of the area you are interested in mapping. As a result, map-makers and spatial imagery specialists need to implement tools to import, merge, and crop these tiles to a more useful format and size.
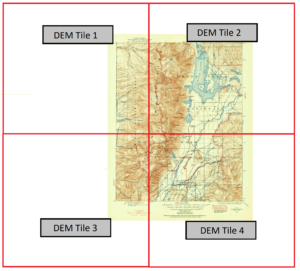
In our case, the elevation data for the area shown by the original 1899 topo-map is now represented by four separate DEM tiles, with roughly one tile for each quadrant of the map. To handle this problem, we can use the powerful Advanced Import tool within the Geographic Imager toolbar. The tool is a one-stop solution to easily import and mosaic our DEM datasets directly into Photoshop, all while retaining the spatial awareness we need to georeference or transform our data layers.
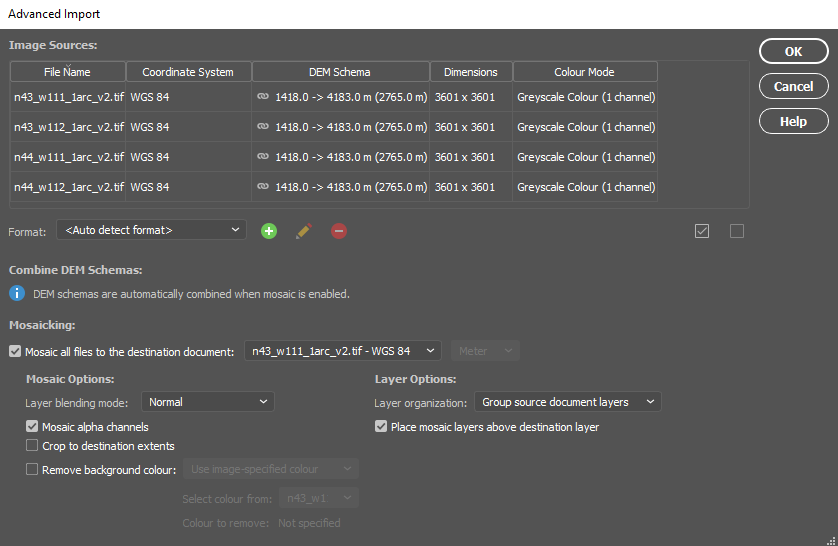
By combining each of the four raw DEM datasets, the tool will mosaic the tiles into a single merged, continuous, and geographically accurate elevation layer covering the entire extent of the map. Even more impressive is that Geographic Imager can use the spatial referencing information in the data to automatically align and overlay the original 1899 topo map onto the elevation layer, removing the need to perform manual georeferencing. (If the imagery data you are using does not have spatial referencing information already, don’t worry – our support team has crafted some excellent, easy to follow georeferencing in Geographic Imager tutorials).
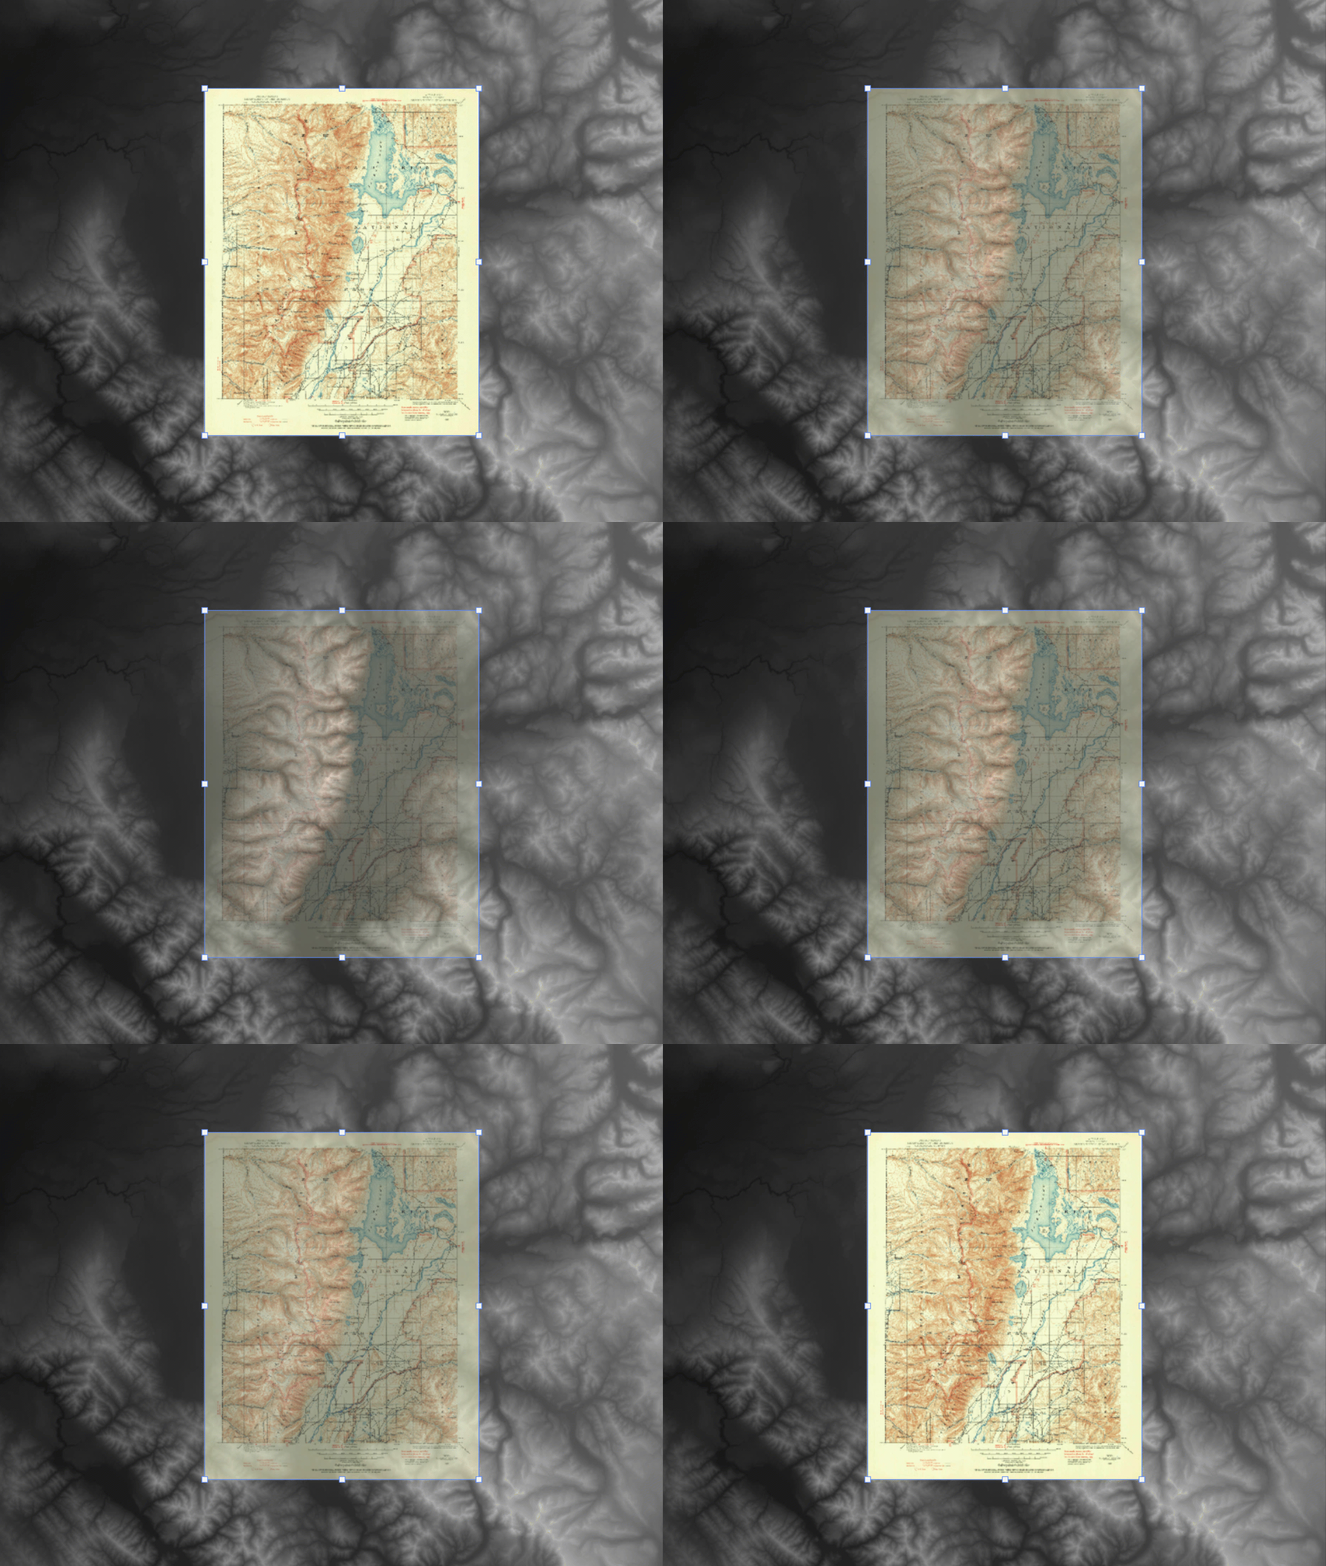
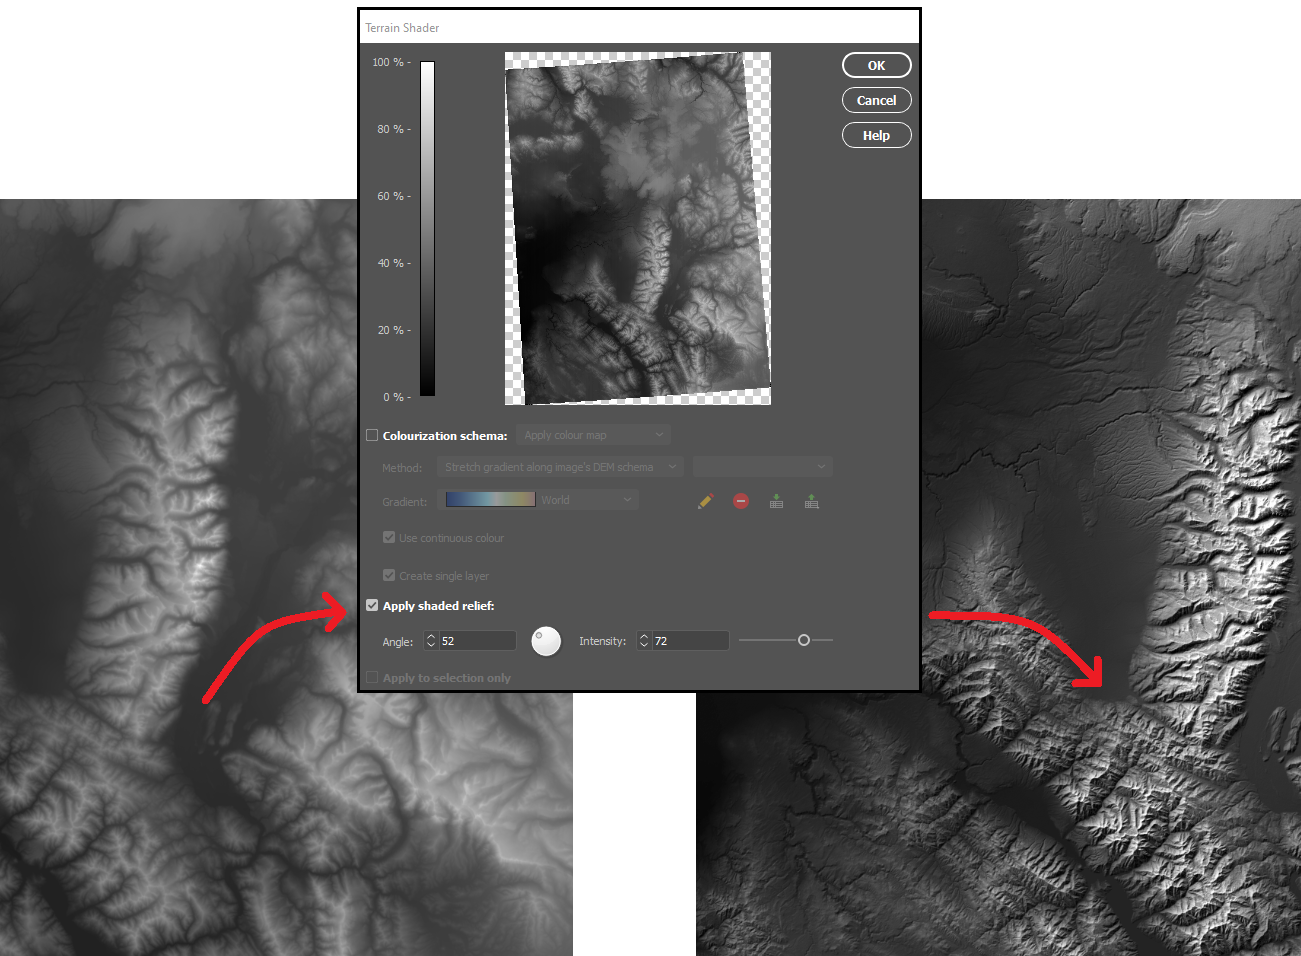
With our DEM data imported into Photoshop, we can start to explore different techniques for creating shaded relief. We will start by using the Terrain Shader tool located on the Geographic Imager toolbar. Terrain shader is a one-click technique to create simple shaded relief instantly. It allows you to configure the angle and intensity of the simulated illumination source to control the prominence and direction of casted shadows. Additionally, you can apply customized colour gradients to easily produce stylized elevation maps or apply hypsometric tints.
In many situations, the Terrain Shader tool is an all-in-one, quick and easy way to create shaded relief. The output of the tool makes it easy to distinguish topographic features and can be used to quickly produce a shaded-relief backdrop for your map.
One of the greatest benefits of using Geographic Imager is that we retain all the imagery manipulation and spatial referencing capabilities of a GIS while still having access to the massive inventory of powerful image editing tools provided by Photoshop. This allows us to take our shaded relief technique up a notch by incorporating the advanced 3D rendering and lighting tools of Photoshop 3D to truly bring our 1899 Grand Teton survey map to life.
To start, we first need to trim the DEM layer down to our specific area of interest. We used the GeoCrop tool to crop our mosaiced DEM layer down to the exact extent of our topo map (it is important that both layers are the exact same extent – you’ll see why later). Next, we can open up the Photoshop 3D toolbar, and convert our flat DEM into an extruded 3D “Depth Map”.
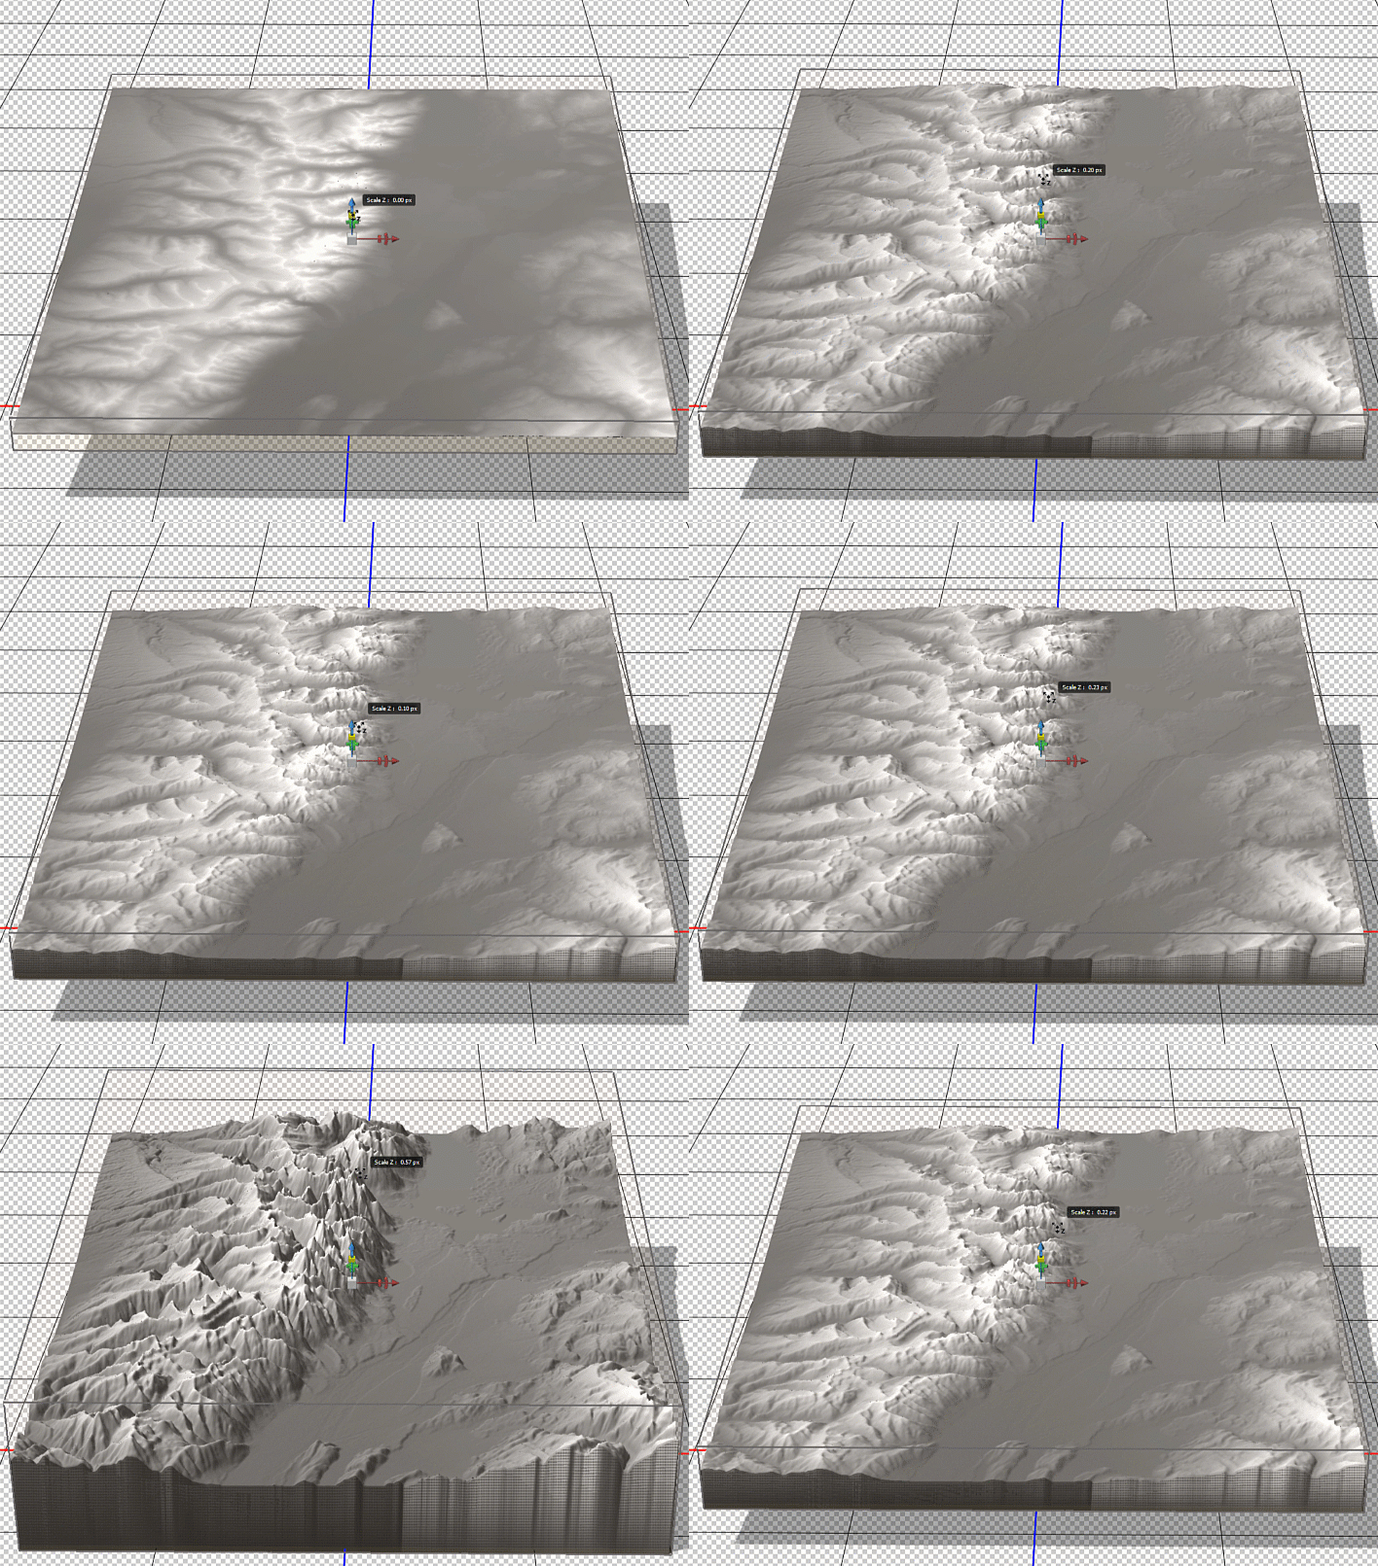
To enhance the shaded relief effect, we need to apply a vertical exaggeration to the model. In 3D mode, we can drag the z-axis scaling slider to exaggerate the prominence of the topographical features in our map. By creating vertical exaggeration, we can create more pronounced shaded relief, as canyons and lowlands will capture shadows more effectively.
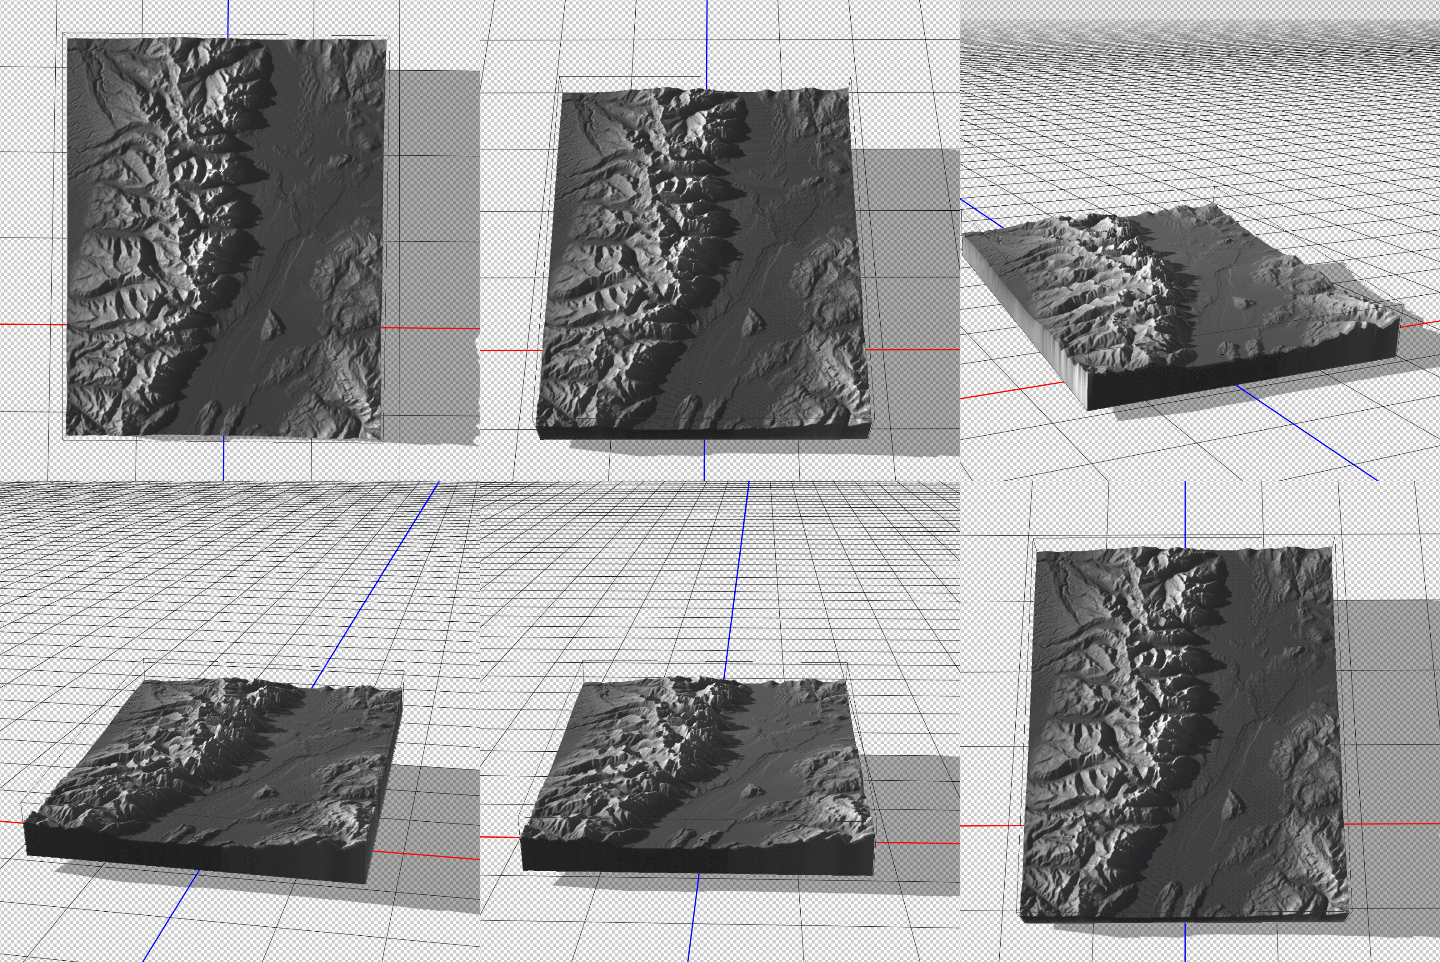
In 3D mode, we can use the mouse cursor to pan and rotate our “camera” to get different perspectives of our elevation model. This can be useful for creating orthographic or oblique perspective map styles.
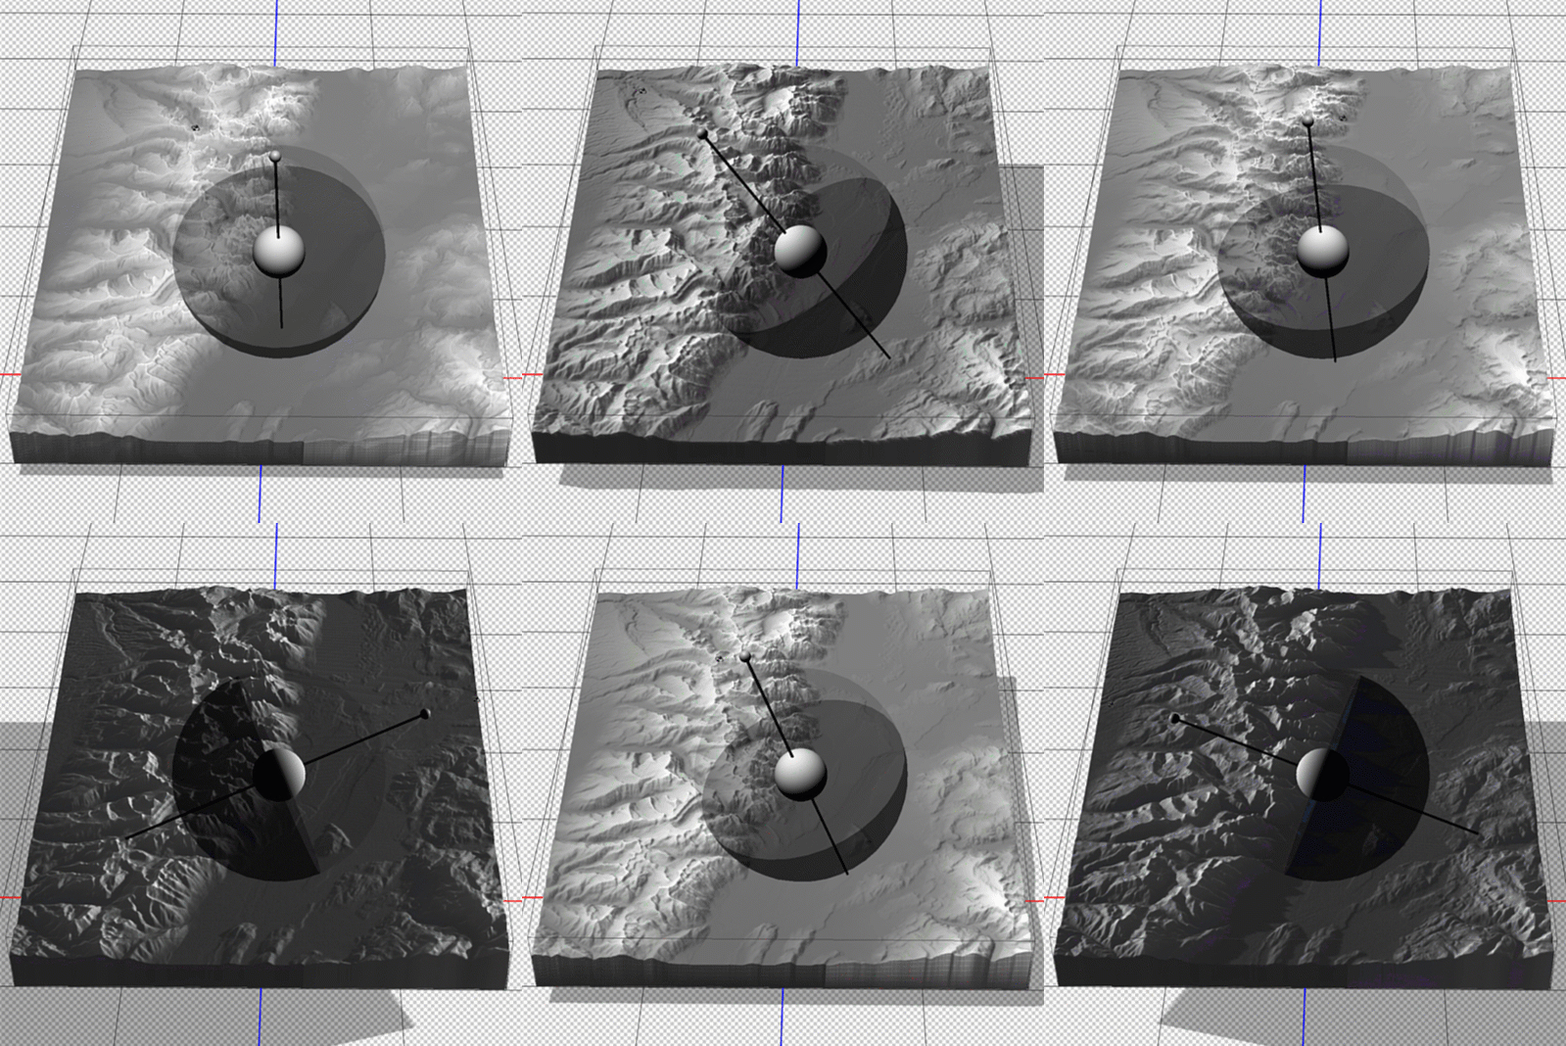
Now that we have a configured 3D model of our map area, we can apply our simulated illumination source. Much like the Terrain Shader tool, we can control the illumination intensity and angle of approach. Since we are working in a 3D environment however, we now have three different axes that control where our light is coming from. Notice how the angle is important for affecting the length and intensity of shadows in our relief map. This includes the prominent mountain silhouettes that can be created when we set the light source to approach from a low angle on the horizon.
Next, we can configure the surface properties and apply a texture overlay to our 3D model. Experimenting with these settings changes how light interacts with the surface and can be refined to produce different relief shading effects. Using these surface properties, we can also drape the original 1899 Topo map onto our surface model (this is why it is important for both the DEM and the topo-map to share the exact same extent, otherwise the topo map will be distorted once it is draped over the surface).
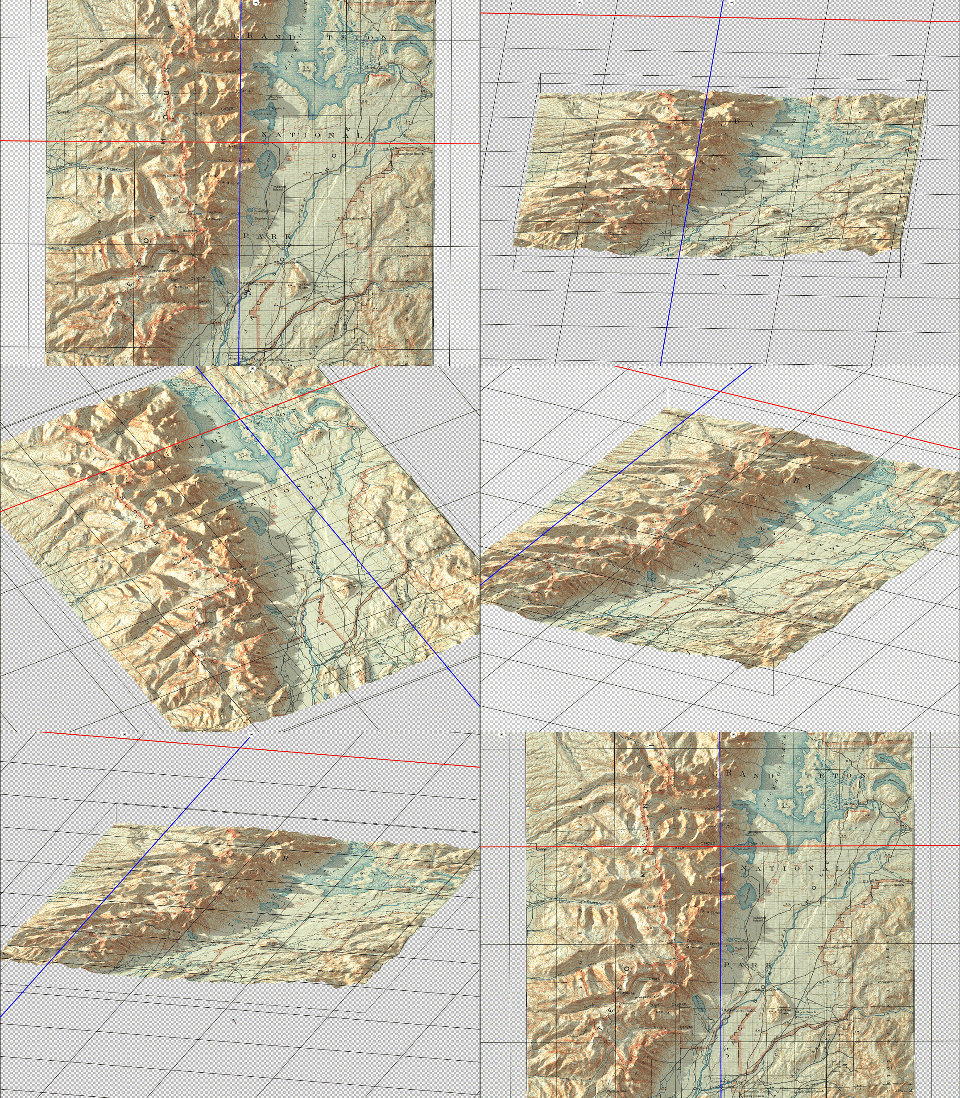
Fine-tuning the map at this stage can take some time and experimentation. We can add some additional light sources with different casting angles and intensity to help create a multi-directional hillshade effect. We can also configure the light settings to produce softer, less pronounced shadows that look more realistic. After spending some time adjusting the lighting and surface settings, as well as configuring the camera view angle, we can hit the “render” button and sit back while it creates a full-resolution rendering of our 3D model (this part can be very computationally intensive, and may require a high-performance machine to process efficiently).
Since we are still creating our map entirely within the Photoshop environment, we can immediately fine-tune the brightness, contrast, and colour of our map before exporting the final product.
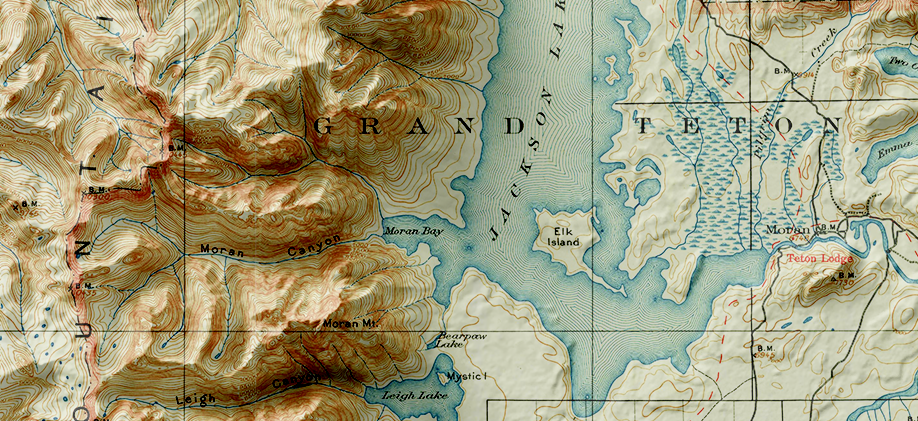
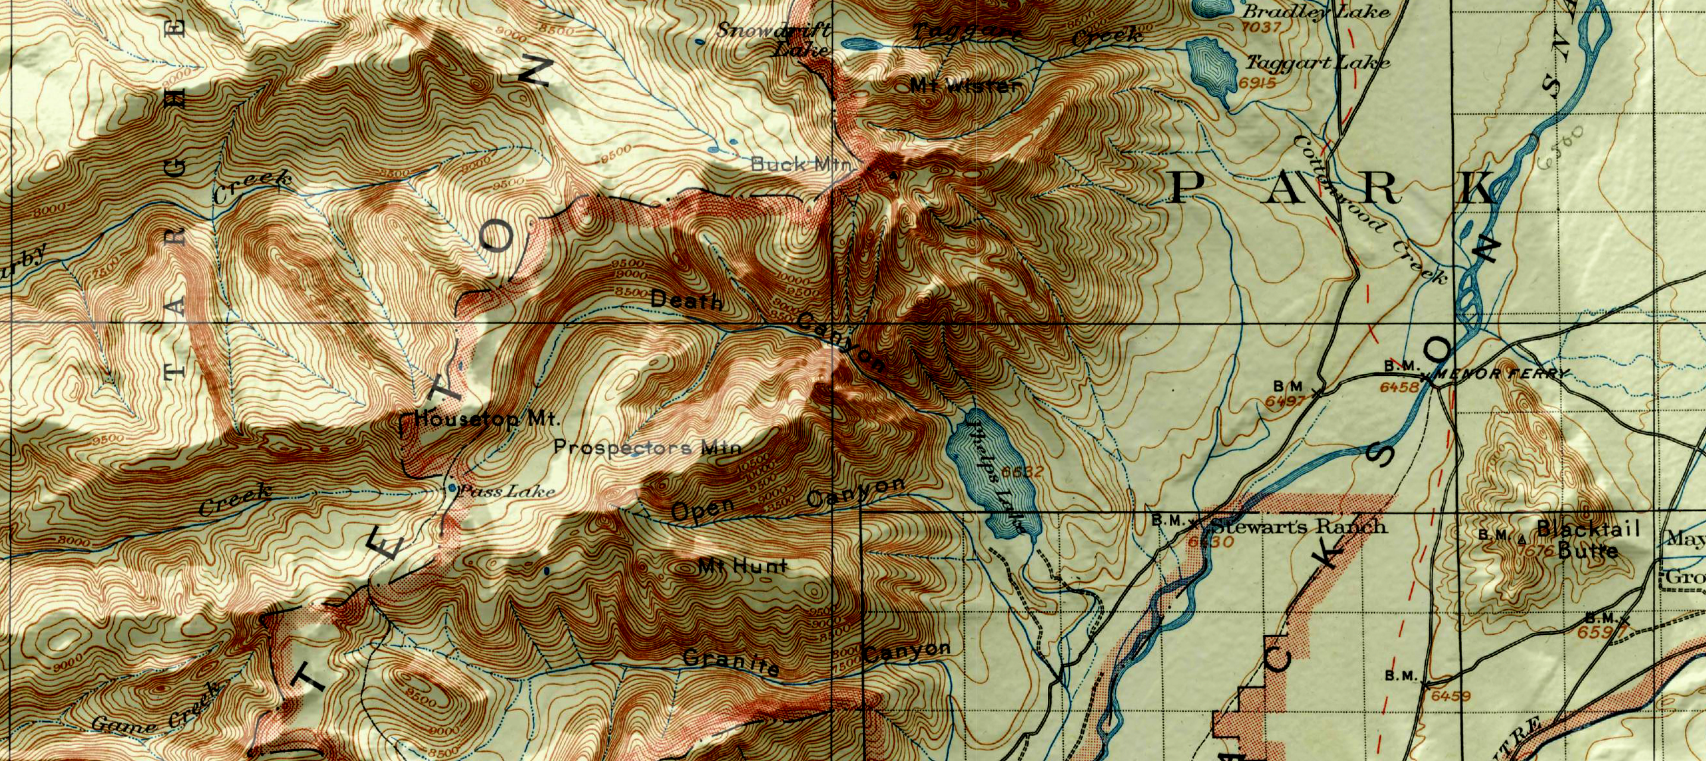
You can see some renders of the final map below. Thanks to the powerful spatial import and manipulation tools of Geographic Imager, and the ability to work entirely within the advanced image editing environment of Photoshop, we were able to create a dramatic 3D shaded relief effect that brings our 1899 USGS Grand Teton Survey map to life.
