By Olly Normanton, QA Specialist
This is one feature we have all been waiting for. Spatial Join is a very useful tool to be included in the MAPublisher roster as of version 10.6 and I would like to share a little bit about the tool with you in this feature blog.
The Spatial Join tool inserts the columns and attributes from one feature table to another based on location or proximity. Currently, we support several Spatial Join types including:
- Intersects: If any part of two features touch at any location
- Identical To: Both features match identically
- Contains: When one feature intersects with the interior or boundary of another
- Near: If a line can be drawn from any part of A to any part of B that is less than the specified minimum distance
- Closest: If a line can be drawn from any part of A to any part of B that is less than any other such line between B & any other feature
- Has Centre In: When one features centroid lies Within another feature
- Within: If all of one feature lies within the interior boundary of another
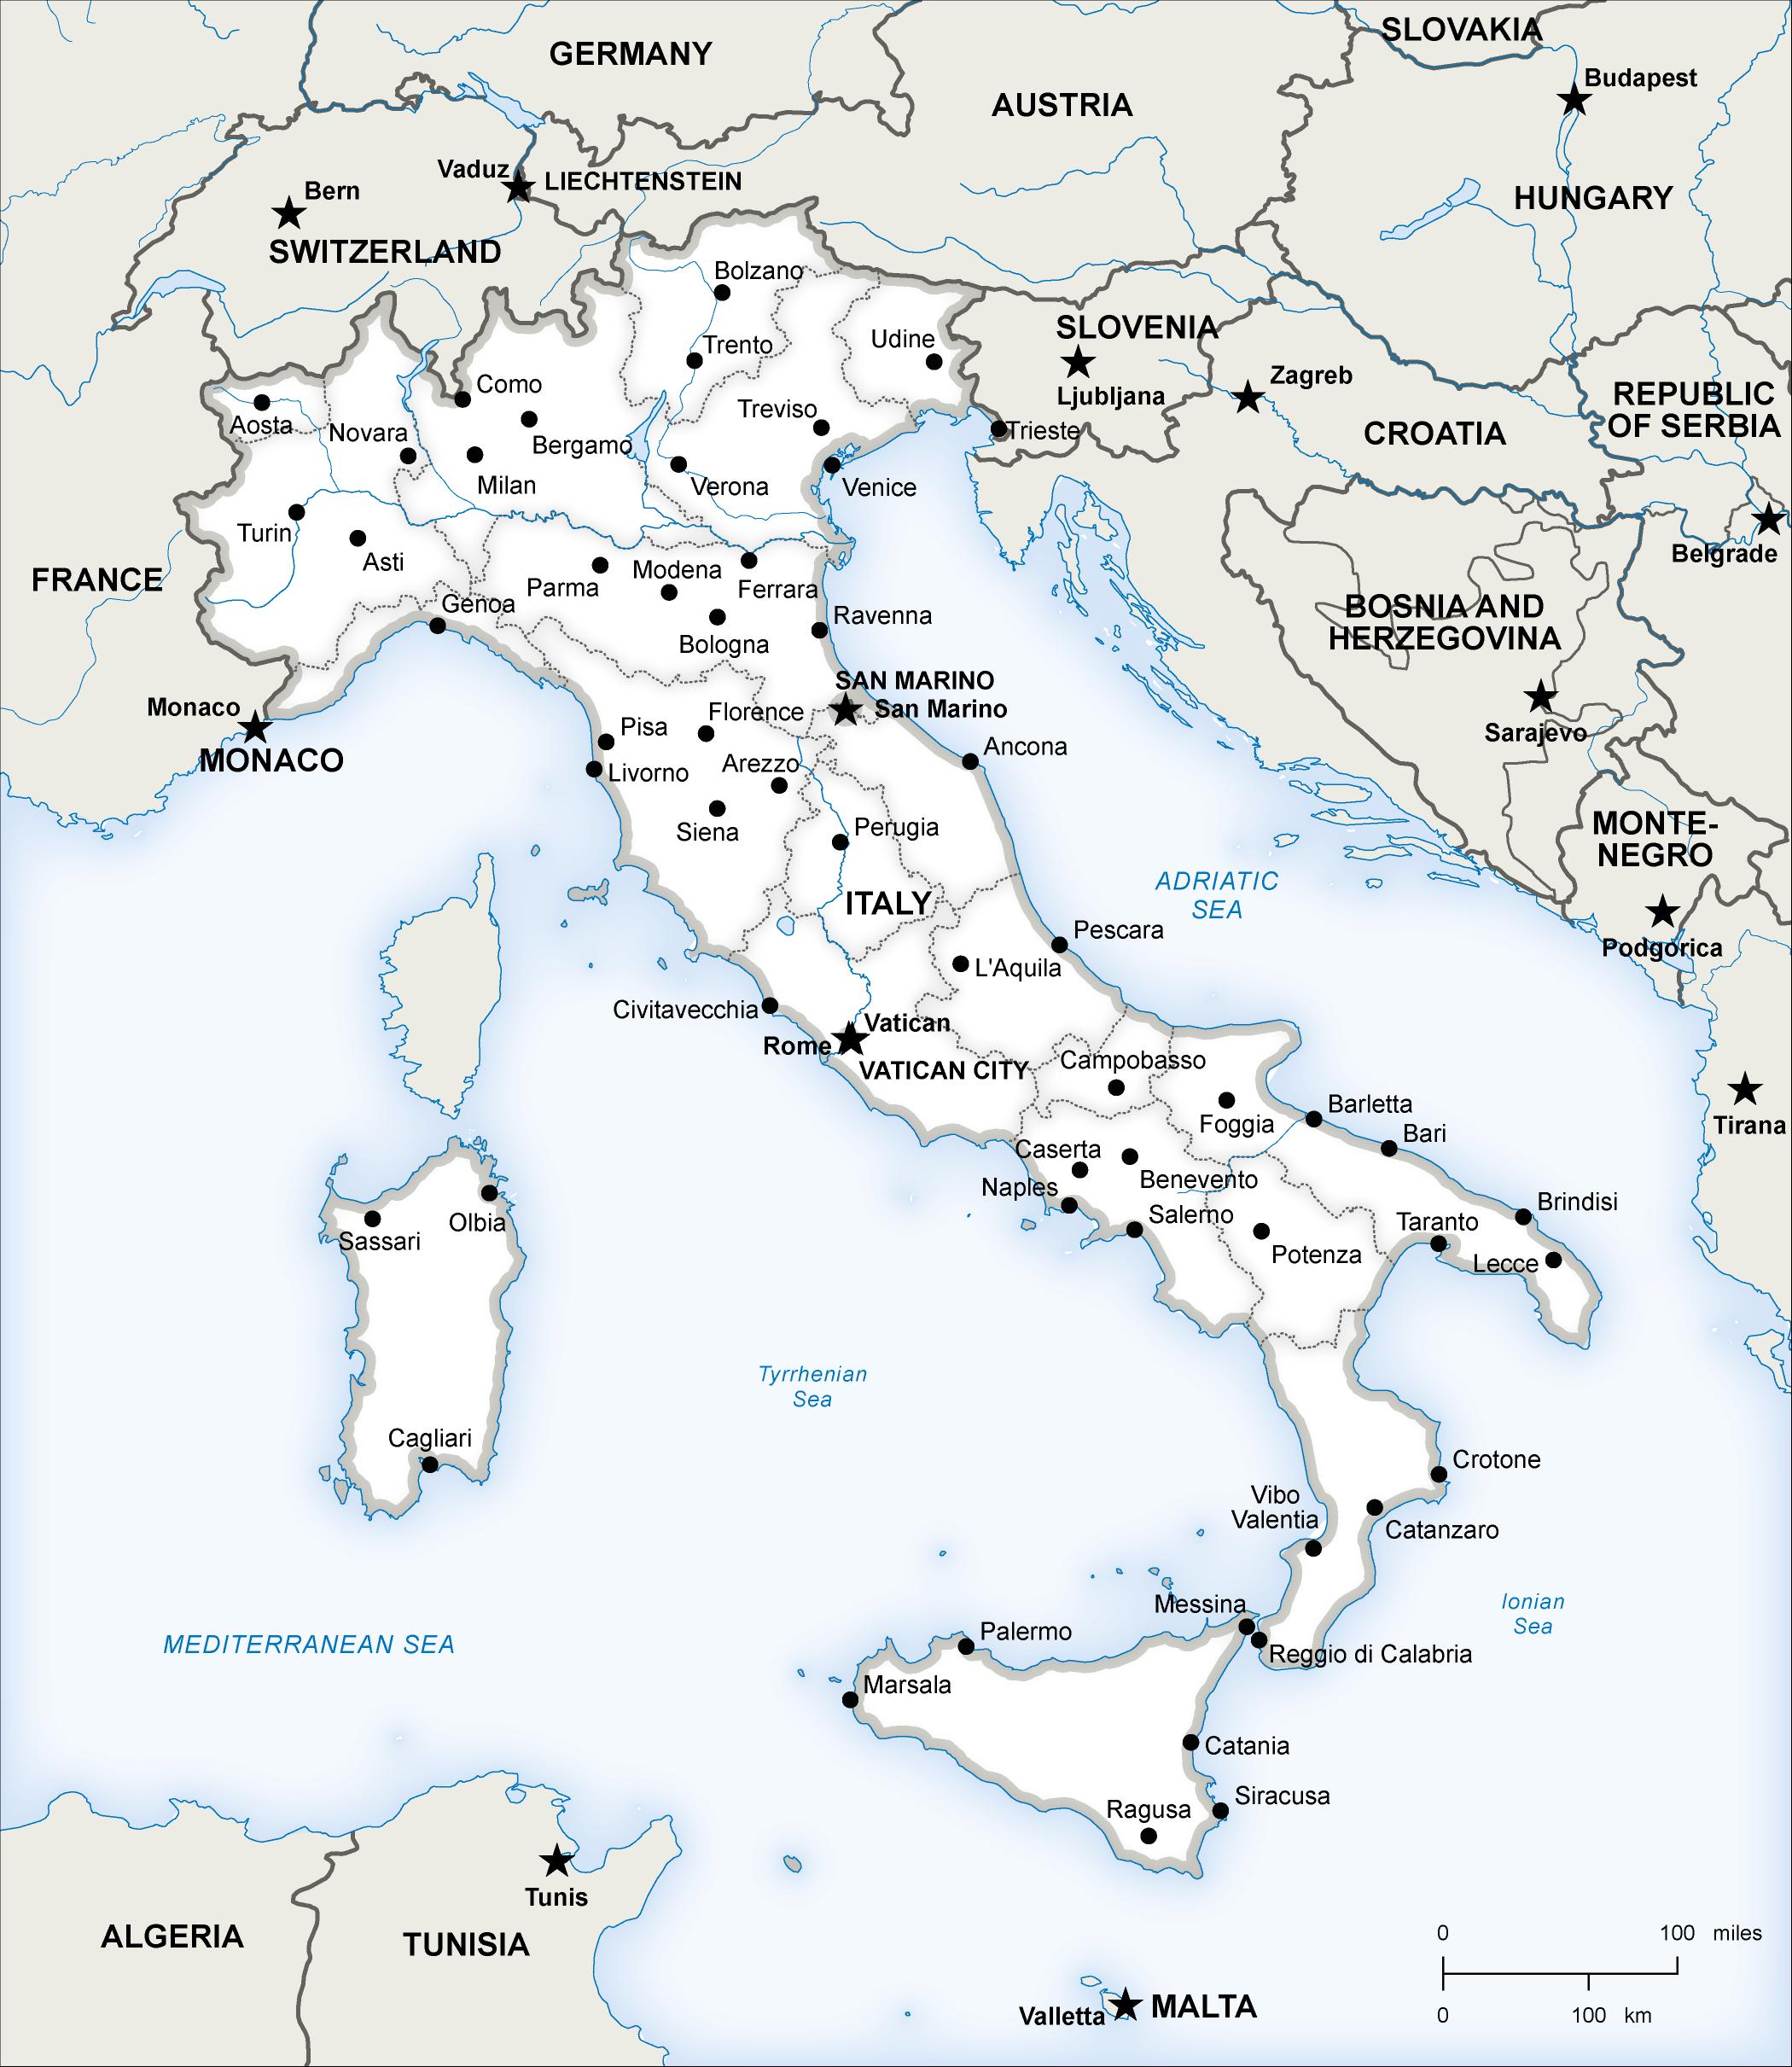
Here is a wonderful map of Italy created by Hans van der Maarel of Red Geographics available through the One Stop Map service. It will provide a great way to show you some examples of the Spatial Join tool in action. It contains a Cities layer and a Regions layer and I would like to see which cities fall into each region by using Spatial Join.
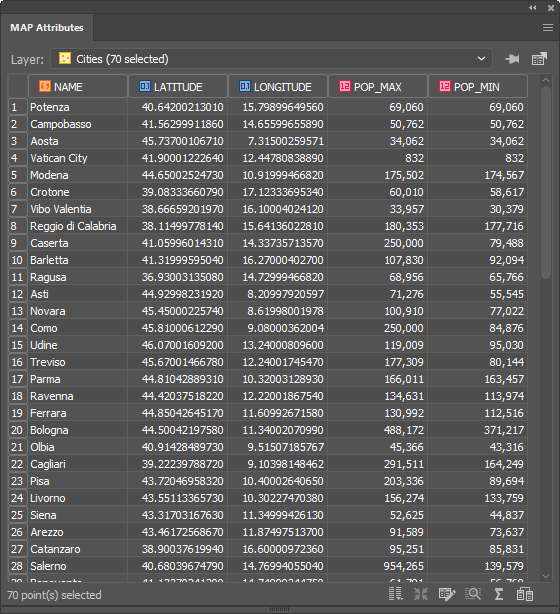
You can see below that the Cities attribute table contains the name of each city and there are 70 in total.
There are 20 different regions that these cities lie within. To figure out which cities belong to which region, we have the ability to spatially join attribute information from the Cities point layer to the Regions area layer. In addition, we’ll use the Concatenate operation on the NAME attribute to list all the cities that belong to a region in one field.
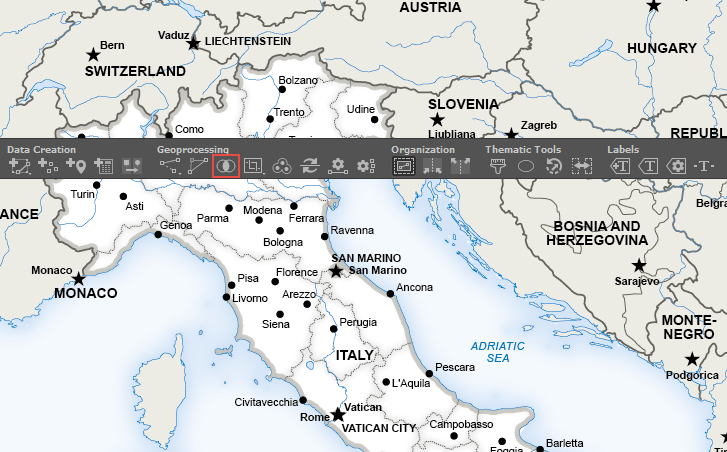
To do this, click the new Spatial Join button on the MAPublisher toolbar or access the Spatial Join dialog box via Object > MAPublisher > Spatial Join.
The Spatial Join tool will always open on the Join tab seen below. I will be adding data to my Regions area layer and joining data from my Cities point layer. The relationship is set to Contains—in other words, when one feature intersects with the interior or boundary of another. A description of the operation is always provided beneath the relationship.
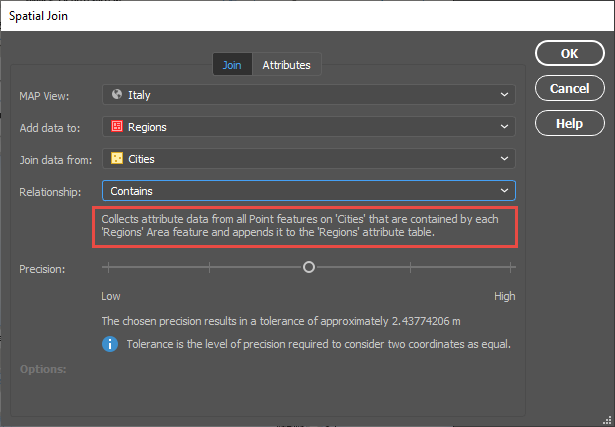
The Precision slider alters the tolerance that is used to determine when two values are equivalent (or approaching equivalent). Depending on your data, this may need to be altered in some cases but for this example, I will be leaving it in the default position.
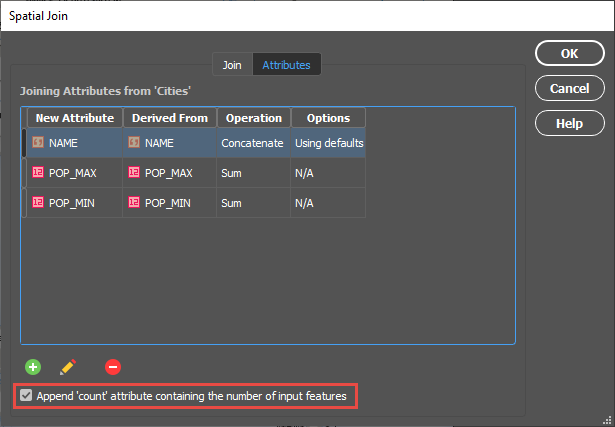
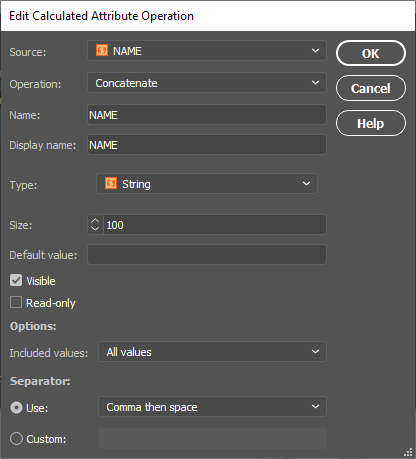
On the Attributes tab, I am going to concatenate the NAME field. By double-clicking on the attribute, I can access the Edit Calculated Attribute Operation dialog box. In addition, I am going to sum both the POP_MAX and POP_MIN attributes. I’m also going to append a Count attribute to the table so I can quickly verify how many cities are in each region.
Within the Edit Calculated Attribute Operation dialog box, I am going to set the Operation drop-down to Concatenate and leave the separator as default as Comma then space.
After confirming the Spatial Join with the OK button, we’ll open the MAP Attribute table for the Regions area layer and take a look at the results.
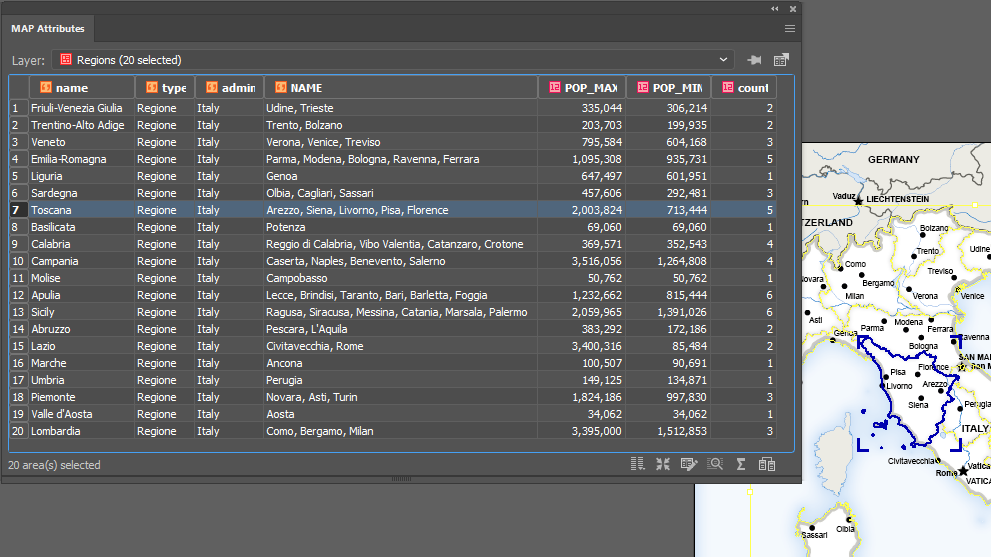
You can see that the cities have been concatenated by region and the POP_MAX and POP_MIN attributes have been summed for the regions based on the cities contained within them. The count attribute was also added to the attribute table and as only 56 of our 70 cities were within the Italian Regions area layer, that is the total value of our count.
For the eagle-eyed readers who may have noticed that there are only 12 cities that surround Italy in the full map displayed at the beginning of this article and 70 – 56 = 14, the difference can be explained by San Marino and Vatican City, both of which are autonomous countries and not part of Italy. You can see that they are in fact separate polygons.

For a full list of the relationships that are available based on the different layer types, and also the input attribute types, please see the tables below.


This post was made using the incredibly beautiful map data provided by our good friends over at One Stop Map. Stay tuned as MAPublisher Aware Maps are coming very soon to the One Stop Map Store, which will allow you to directly purchase the Adobe Illustrator files and put your own style on the maps! If you’re interested in seeing more of their work, take a look at these One Stop Map Country Maps.


