We’re excited to announce that we’ve released MAPublisher 10 for Adobe Illustrator. The MAPublisher product team has been working closely with our customers to build more useful features, tools, and to improve the look and feel.
MAPublisher 10
This update contains new features and performance improvements as well as fixes for reported bugs. Some highlights are mentioned below, for the full release notes see below.
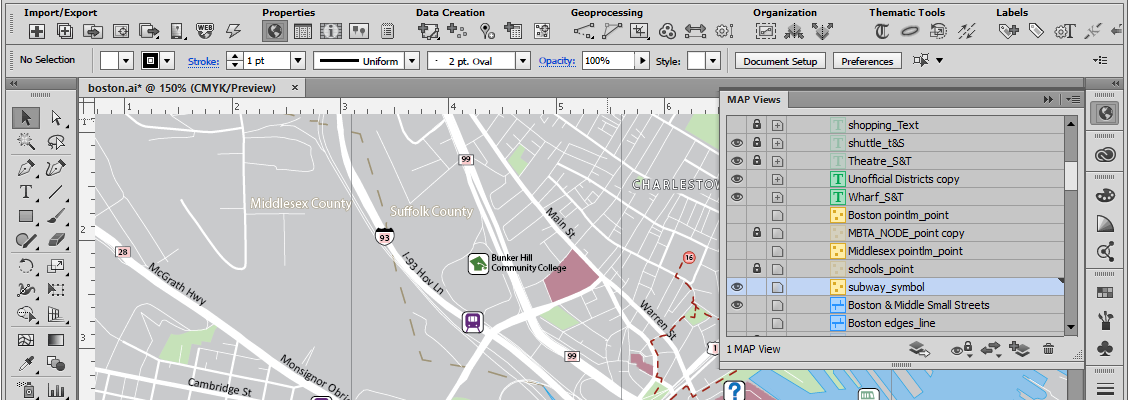
Adobe Illustrator Creative Cloud 2018 support. We are fully committed to providing the best map design tools seamlessly built into Adobe Illustrator. We have improved our user interface (panels, tools, buttons) to support high-resolution monitors. This release is fully compatible with the latest Adobe Illustrator CC 2018 on both Windows (32-bit and 64-bit) and Mac.
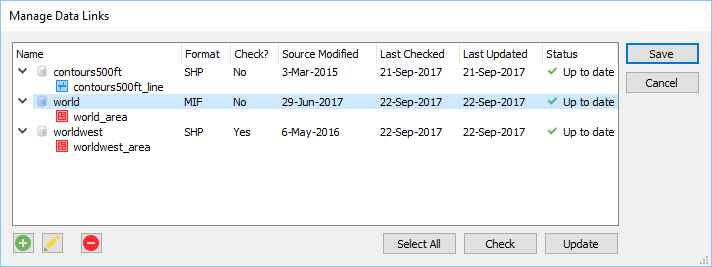
Manage Data Links. This feature has long been requested by our customers. You now have the ability to create and manage data links for MAPublisher documents. MAP layers in a document can be updated when its source data has been modified. Data links are checked automatically every time a document is opened and will display the status of affected layers in the MAP Views panel. This allows you to keep track of data that may have been moved or modified. When a data source is missing, a notification will alert you in both the Edit Data Link dialog box and MAP View panel. Note that only the link is dynamic and not the actual map features, meaning that manipulating your features in the document does not directly affect the source data. You will need to export your data if you want to overwrite your source data.
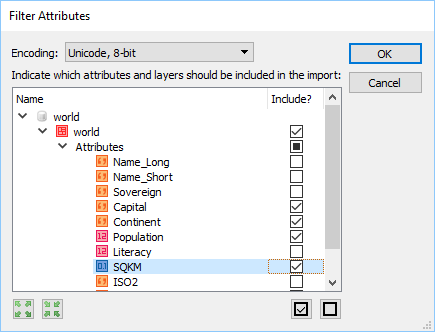
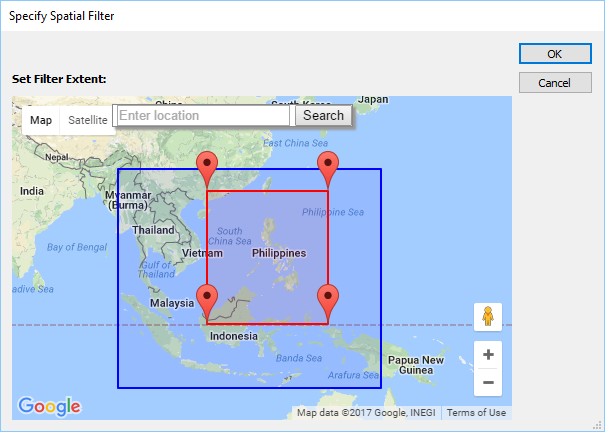
Filter attributes and filter geometry on import. A common workflow our customers encounter is trying to reduce the amount of data being imported. Often times, a dataset covers a much larger area or has too many attributes included. There is now a way to streamline import so that it’s not only quicker to import, but also results in improved Adobe Illustrator performance due to the reduction in the number of map features on the artboard. The new attribute filter helps you select which layer attributes (or layers) to include or not include prior to import. The new geometry filter provides several options (including an interactive map) to help you select which area to include or not include prior to import.
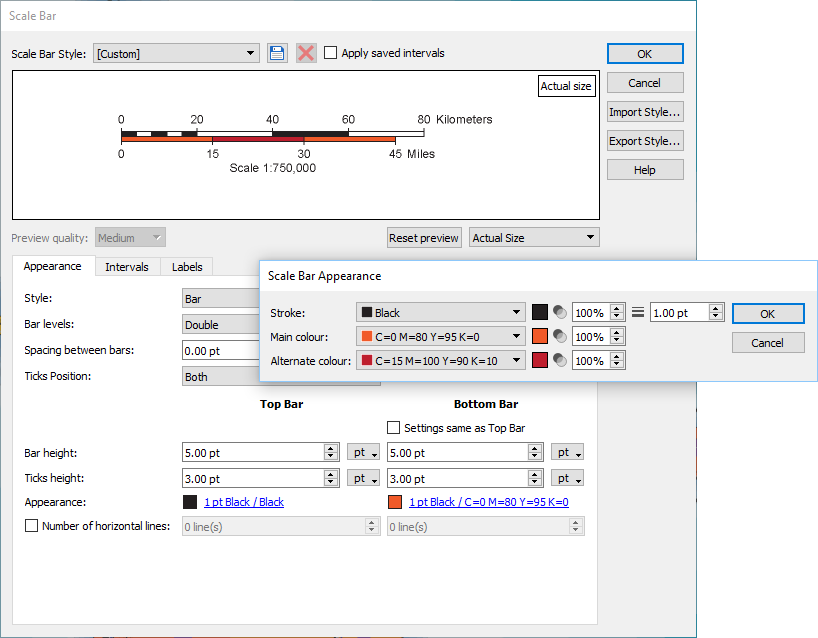
Redesigned Scale Bar tool. We’ve worked a lot with our customers to redesign the scale bar tool. In addition to new customization options, new scale bar styles were generated with the help of the US National Park Service, Harpers Ferry Center. You also now have the ability to save, import, and export scale bar styles, making it easier to share defined styles with others.
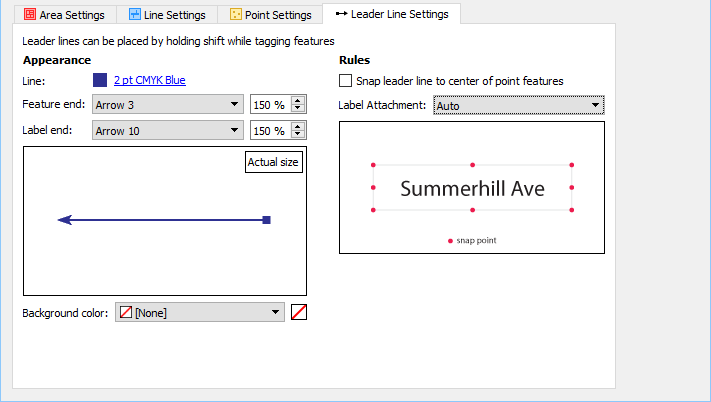
Improved MAP Tagger Tool. You now have the ability to create custom leader lines with various arrow styles and option to snap leader line to different positions around a label. This provides a new level of customization and efficiency without having to style leader lines afterwards.
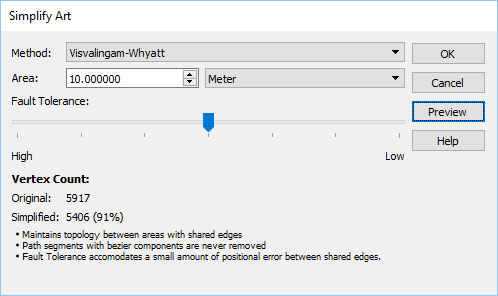
New Simplify Art simplification method. A new Visvalingam-Whyatt simplification method and fault tolerance setting to accommodate positional error between shared edges in the topology. The Visvalingam-Whyatt method is an area based algorithm which eliminates points based on their effective area. By iterating through points of lines and areas, it calculates and removes the point with the least effective area.
MAPublisher 10 Release Notes
Fully compatible with the latest Adobe Illustrator CC 2018 on both Windows (32-bit and 64-bit) and Mac
New ability to create and manage data links for MAPublisher documents. MAP layers in a document can be updated when its source data has been modified.
New attribute filter capability to select which layers and attributes to include or exclude prior to import
New geometry filter capability to select which features to include or exclude prior to import
New scale bar styles and customization options including ability to save, import, and export scale bar styles
New Visvalingam-Whyatt simplification method and fault tolerance settings to simplify art
New MAP Tagger Tool ability to create custom leader lines with various arrow styles and an option to snap leader line to different positions around a label
A new Point Utilities action that can rotate points to the angle of latitude
A modified Text Utilities action that can draw a point for text based upon text alignment for indexing purposes
New settings for North Arrow location including True North and a custom coordinate and options to use Great Circle or compass method
New MAP Web Author HTML5 export customization options including adjustable scale bar
A number of user interface and usability enhancements.
Modern cartography—the art, science, and technology of making maps—consists of manipulating and displaying geographic elements in a graphic environment. Traditionally, GIS software has offered users limited ability to manipulate the graphic attributes (hue, brightness, saturation, transparency, line thickness, text, etc.) of geographic elements, while graphic design software has treated geographic features as it would any other graphic elements, without regard for how they are connected in predictable ways to other geographic elements and to Earth itself. Additionally, in the real world, natural or artificial boundaries and features are constantly changing and cartographers need to update maps at different scales and in different styles to reflect these changes. Therefore, cartographers need an efficient and reliable way to bridge the divide between GIS and graphic design software.
First launched 30 years ago, Adobe Illustrator has long been the professional standard for graphic design, especially for creating vector graphics. For more than 20 years, Avenza’s MAPublisher has provided extensive GIS functionality inside Adobe Illustrator. I discussed the synergy between these two programs with two experts:
David Lambert, Director of Cartographic Production for National Geographic’s commercial retail mapping products, which includes its well known Trails Illustrated outdoor recreation map series, and
Tom Patterson, Senior Cartographer at the National Park Service’s Harpers Ferry Center, in Harpers Ferry, West Virginia, which designs most of the interpretive media that is found in national parks—including maps, brochures, outdoor signs, visitor center exhibits, films, and digital kiosks.
“Map Illiterate” vs. “Map Aware”
In the past, many map makers have also used Macromedia FreeHand (acquired by Adobe in 2005 and since discontinued), CorelDRAW, Canvas, or even more recent entrants with a map-specific slant such as Ortelius, proving that a graphics environment has long been regarded as a good and viable one for their trade. As well, for many years, Esri has offered an Illustrator export option from its GIS products, proving that Illustrator, in particular, has long been the preferred work environment for making maps. However, Lambert points out that those files exported from Esri’s GIS products are devoid of geographic properties once imported into Illustrator. He has been with National Geographic for 21 years. His team used to work with Illustrator, which was already the graphic design standard, but used Esri software to design maps, which they then exported as Illustrator files from Esri and imported to Illustrator. “Once we brought that into the Illustrator format, it lost all geospatial awareness,” Lambert recalls. In essence, the file became “map illiterate.” In 2011, he switched to using MAPublisher after learning how easy it made it to incorporate GIS data into Illustrator workflows.
To explain the advantages of using MAPublisher to keep graphic elements “map aware”, Lambert cites three examples:
The Great Salt Lake has shrunk in size over the years. “Prior to 2010, somebody would export a lake boundary and then bring it into Adobe Illustrator, where it might be re-scaled and transformed with an Illustrator function to fit the area of another map,” Lambert recalls. Now, with MAPublisher, National Geographic can use the same lake boundary in its maps of Utah, of the United States, and of the world, in each case simply reprojecting it on the fly without having to first export it to GIS software.
Many ofNational Geographic’s nearly 300 outdoor recreation maps overlap one another at different scales. When, for example, Great Smoky Mountain National Park produces a new trail dataset reflecting changes in trails, National Geographic can now incorporate those changes much more quickly than ever before by simply transforming them through different map projections in the geospatially-aware files.
The boundary between Pakistan and India is constantly changing. National Geographic can now make each change just once, then move it from its world map to its map of Asia and other products.
Starting in a Common Projection
National Geographic starts working on any new map products in MAPublisher. “We want to get off on the right foot, so we make sure that they are all in the common projection from the very beginning,” Lambert explains. His team uses MAPublisher right from the start to georeference files and then to incorporate additional GIS data from federal, state, and county agencies into them. “For example,” Lambert says, “if we get a data set from the National Park Service, we are able to quickly import it and split it into the different layers and styles throughout our entire map series. We can see which trails might be hiking trails, horse trails, or mountain biking trails and quickly apply our styles. We also receive information from the U.S. Geological Survey, such as national hydrological data sets.”
MAPublisher allows users to work in a GIS environment from inside Adobe Illustrator. For example, they can bring in a transportation data set from a county, then click on a road in Adobe Illustrator and bring up a MAPublisher viewing panel to display its attributes, such as its name, whether it is paved, and, if it is not, its clearance. “We can see all the information that these agencies are assigning to these different lines,” Lambert says. “Adobe Illustrator and MAPublisher work together seamlessly.” By contrast, he points out, with other programs you have to exit one and go into the other.
Reconciling Conflicting Data
Most of Patterson’s work revolves around making those very familiar black-banded brochures that visitors receive when they enter a national park. He began using MAPublisher in the mid-1990s, when Avenza introduced version 1.0. “We had just started converting our maps from manual production to digital production using Adobe Illustrator as our primary drawing software,” he recalls. “Soon afterward, geospatial data started becoming more available and the quality greatly improved. Of course, we wanted some means to bring these data into the graphic environment of Adobe Illustrator. MAPublisher provided us with the ideal tool for doing just that.”
Early on, Patterson’s team only used MAPublisher to import geospatial vector data into Adobe Illustrator to produce non-georeferenced maps. As the years went by, however, it saw the value of creating entirely geo-referenced maps.
To create a new map of a national park, Patterson’s team begins with an Adobe Illustrator template that contains all of the map layers that it would use for a typical NPS map—including lines, area colors, symbols, and labels. For even greater efficiency, it employs targeted layers with graphical styles applied to them. “A big part of our process at the beginning,” he explains, “is going on an online digital scavenger hunt, essentially finding whatever data we can that is in the public domain, from which we can compile our maps. We then import these various geospatial data sets into the Adobe Illustrator environment with MAPublisher.”
“The most time consuming aspect of map production is reconciling conflicting data,” says Patterson. “For example, analyzing and fixing different road data sources that don’t match with one another is an arduous process. However, thanks to the data manipulation tools in MAPublisher—which allows us to select, sort, and manipulate data by attribute—this task is now much easier.”
Patterson’s team updates NPS maps every year or two or three, depending on each park’s popularity. Working with a geographically-aware MAPublisher document allows it to take the previous printing of its map and import new data into it, which then drops into place where it should. For example, if a park builds a new trail, the park GIS specialist will send Patterson’s team a shapefile for that trail that it can quickly and easily import using MAPublisher. “It just works seamlessly,” says Patterson. Additionally, almost all NPS maps have shade relief art in the background. “We generate the shaded relief and then manipulate it using Avenza’s Geographic Imager tool in Adobe Photoshop. The result is a geographically aware Photoshop file of the shaded relief, which MAPublisher will automatically register to map line work in Adobe Illustrator.”
Geospatial PDFs
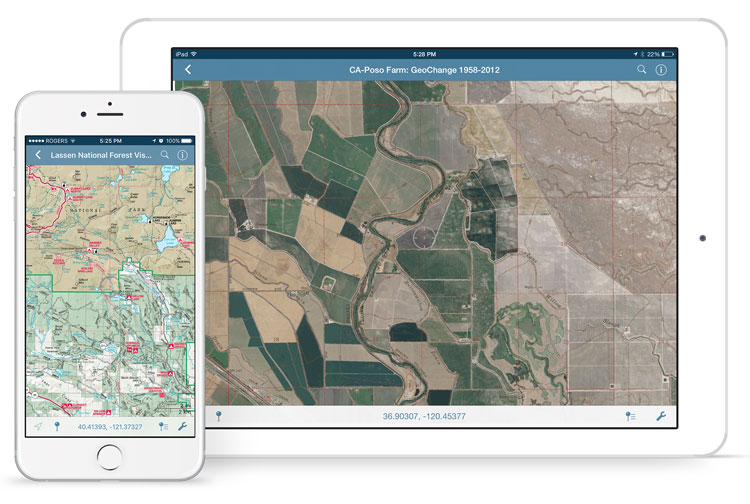
Another very important feature of Avenza’s software, Patterson says, is that it enables his team to save all of its printed maps as electronic files in geospatial PDF format for dissemination via the Avenza Maps app and accompanying digital map store direct to digital devices such as smart phones and tablets. Park visitors can then download and use these maps on their location-enabled mobile devices and, because the maps are geospatially aware, a little blue dot will show their location at all times as they explore a park, even in the absence of a cellular data connection.
Before publishing a new map of a national park, Patterson’s team typically field checks it, saved as a geospatial PDF, using the Avenza Maps app on an iPhone. “We refer to this draft map as we canvas the park,” Patterson says. “We can take notes right in the Avenza Maps app, drop locator pins, and record tracks. When finished field checking, we e-mail the data to ourselves and import it into the working map file through MAPublisher. The notes and tracks that we recorded in the field are used to update the final map, improving accuracy.”
One goal of Patterson’s team is to increase online access to NPS maps. “We are pretty excited about some of the new capabilities in MAPublisher,” says Patterson, “particularly, saving our park maps as Web tiles. We are going through a multi-year transformation right now, converting our maps from the UTM coordinate system to the Web Mercator coordinate system for compatibility with Google Maps, Bing Maps, and Apple Maps. We do all of this through the ‘Export Document to Web Tiles’ feature in MAPublisher, which is really pretty cool.”
Patterson’s team also recently began experimenting with MAPublisher’s Map Web Author tool, which allows quick and easy creation of data-rich and interactive HTML5 web maps from GIS data. It produced a prototype for Harpers Ferry National Historical Park that contains layered information and the ability to explore the map interactively. For example, it allows park visitors to compare contemporary photographs to those taken during the Civil War era at various viewpoints throughout the park.
Other Specialized Illustrator Plugins
There are dozens of plugins that extend Illustrator’s capabilities, for example to edit vector data, concatenate multiple paths, or precisely position nearby objects. Here is one list of Illustrator plugins. CADtools and VectorScribe are particularly noteworthy in this context, because they show that a professional base of CAD users like Illustrator as their working environment, just as GIS and mapping professionals do.
HotDoor’s CADtools 10 plugin provides an extensive set of CAD capabilities—including drawing, editing, labeling, dimensioning, transformation, creation, and utility tools—inside Illustrator. For example, users can insert dimensions or labels on objects, paths, or points in space, which update in real time in response to changes in the artwork. The can also move, transform, and measure objects with precision.
VectorScribe enables users to reduce file sizes by eliminating excess points while maintaining the shape of paths; slide points along paths, extends paths, or trim them; accomplish complex vector editing, such as adding points to tangencies, reverse paths, or smoothly connect curves to straight lines; edit corners on dynamic shapes; or dynamically measure distances and areas along paths.
Conclusions
The sources of geospatial data now include unmanned aerial vehicles (UAS), the Internet of Things (IOT), and myriad consumer devices and, consequently, the amount of available geospatial data is growing exponentially. At the same time, professionals and consumers now expect location to be routinely embedded in everything they do on their digital devices. MAPublisher helps cartographers keep up with this accelerating cycle of supply and demand by making it easier and faster for them to make beautiful maps. Recent attempts by other GIS software vendors to address the increasing demand for cartography and map creation within the Adobe environment is evidence that making maps in Adobe Illustrator is the preferred way to go. With MAPublisher leading the way, it is a workflow that is here to stay.
We’re excited to announce that we’ve completed the release of Avenza Maps 3.3 for iOS and Android. We addressed some early user feedback and made a few point releases to resolve those issues (3.3.1 for Android and 3.3.2 for iOS). We’re also working on another minor update that addresses some additional user feedback.
Avenza Maps 3.3
This update contains new features and performance improvements as well as fixes for reported bugs. Some highlights are mentioned below, for the full release notes see below.
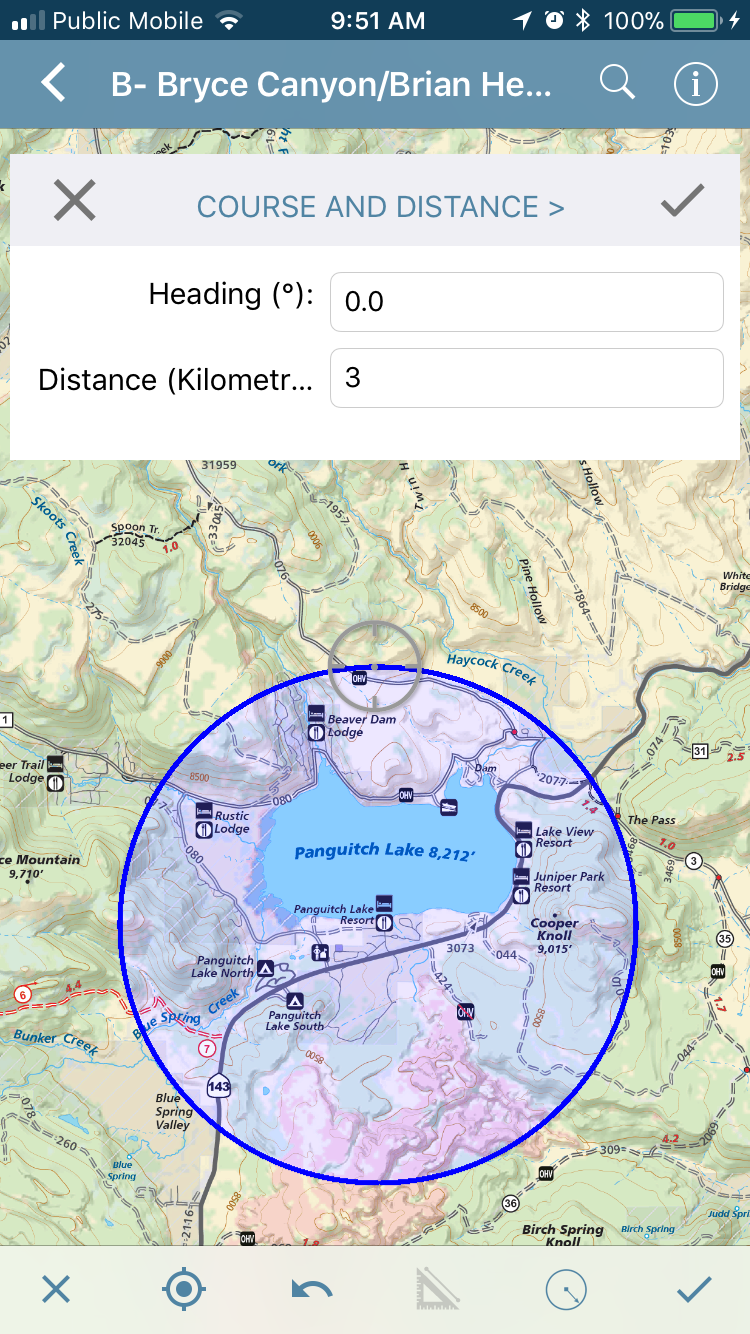
Redesigned Measure Tool. This tool has been completely redesigned and renamed — now known as the Draw and Measure tool. It features an improved interface which lets you draw shapes and measure more easily. While in a draw or measure mode, you can now quickly tap anywhere to enter a segment for a line or area. In addition, there are two precise input modes to enter segments: Point By Point and Course and Distance. Long press anywhere on the map to enter precise input mode. For Point By Point, simply enter the coordinates (lat/long, easting/northing or MGRS/USNG) to add a segment at an exact location. The Course and Distance mode allows you to enter the heading (angle) and distance from an initial location.
You can also now draw circles. Using only two points — an initial center point and a second point at any distance away — which means you can now draw circles that can act like buffers. It even works with the Point By Point and Course and Distance modes to enter specific distances or coordinates. Best of all, shapes and areas can now be saved as a map feature to your map. They can be exported as KML, CSV or GPX or even SHP (if you have Avenza Maps Pro). New style settings are available to adjust line thickness, stroke and fill colors, and opacity.
Release Notes
Redesigned Measure Tool (now known as “Draw and Measure”)
New advanced drawing capabilities, including tap anywhere to draw a segment and tap and hold to access “point by point” and “course and distance” modes
Draw, edit, save, export and import areas. Draw areas including circles using only two points.
Reorganized Settings including new settings to change location dot color and line and area colors including opacity
Record GPS Tracks will continue to run even when the map is closed
Map Store improvements including ability to preview map extent
This post was contributed by Hans van der Maarel of Red Geographics.
The problem with using GIS data for point symbols is that depending on the scale and symbolization you often end up with symbols partly overlapping each other. Of course, the symbols can be manually moved around after initial placement to get a more aesthetically pleasing result, but that can be a tedious and time-intensive task.
Thankfully, there is a way to automate at least part of this process by using MAPublisher and LabelPro.
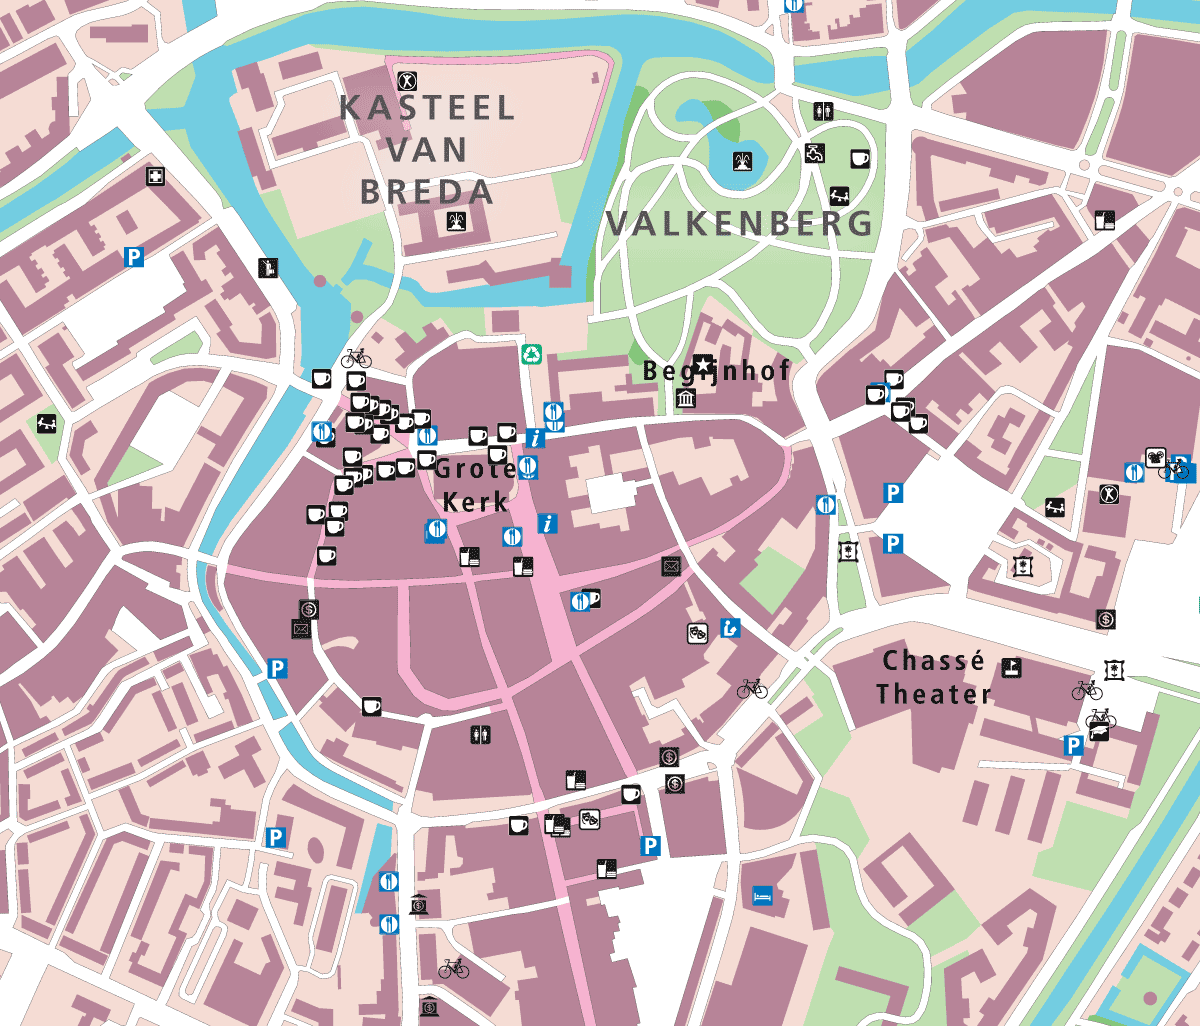
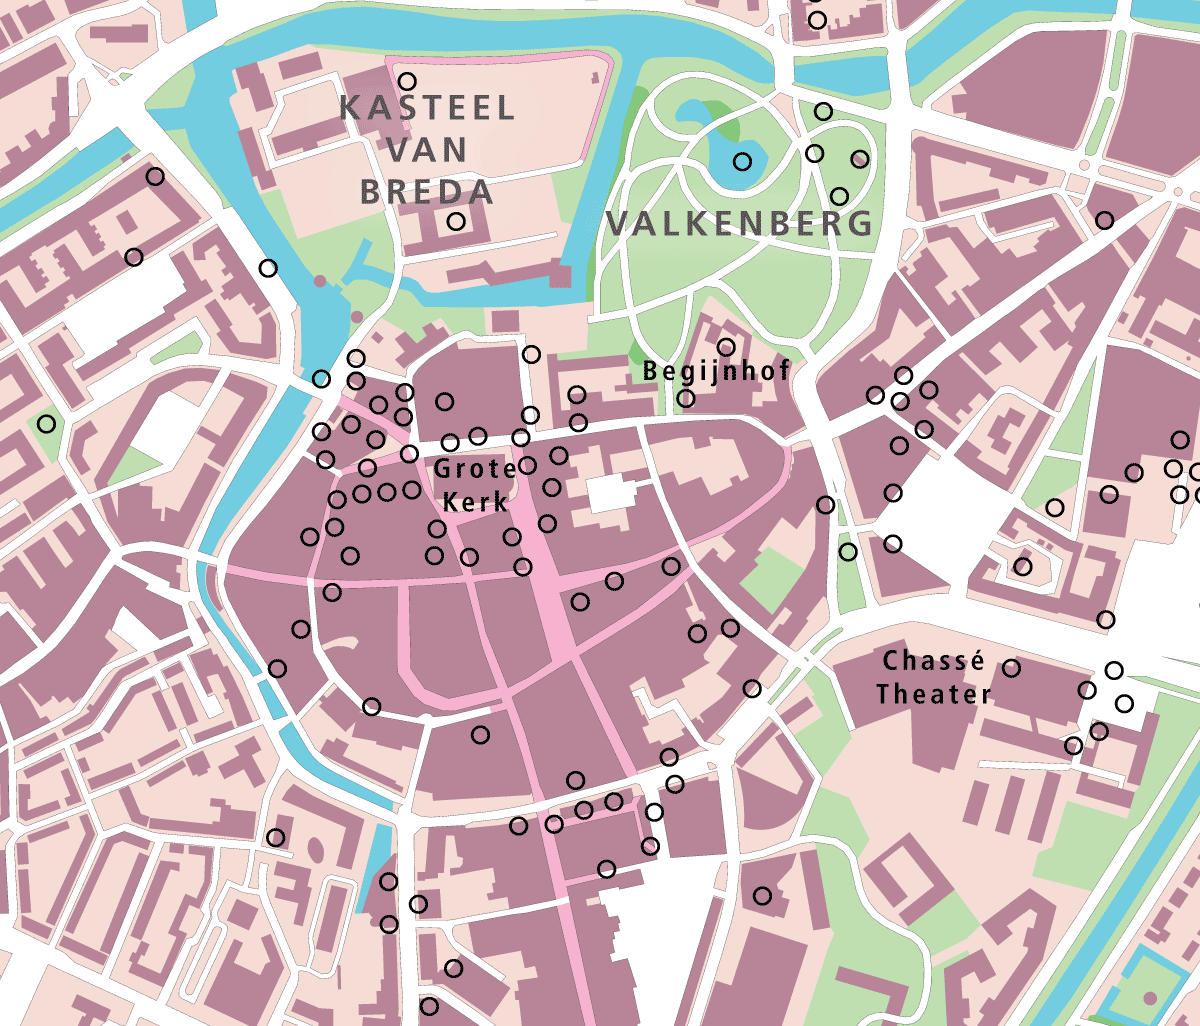
Example map of Breda, The Netherlands
This example shows the heart of an old European city (Breda in The Netherlands to be exact). The map is composed of Dutch Top10NL topographic base data, a few labels were manually added for larger features (such as the park), and points imported from OpenStreetMap (OSM) and styled using a Map Theme. As you can see, there are a number of spots where the symbols are densely located and overlap each other.
The MAPublisher LabelPro add-on is capable of collision-avoidance to make sure overlaps don’t happen. But it only works when generating labels (text). Fortunately, the solution is to trick LabelPro into processing symbols too, so that they can benefit from better placement without overlaps.
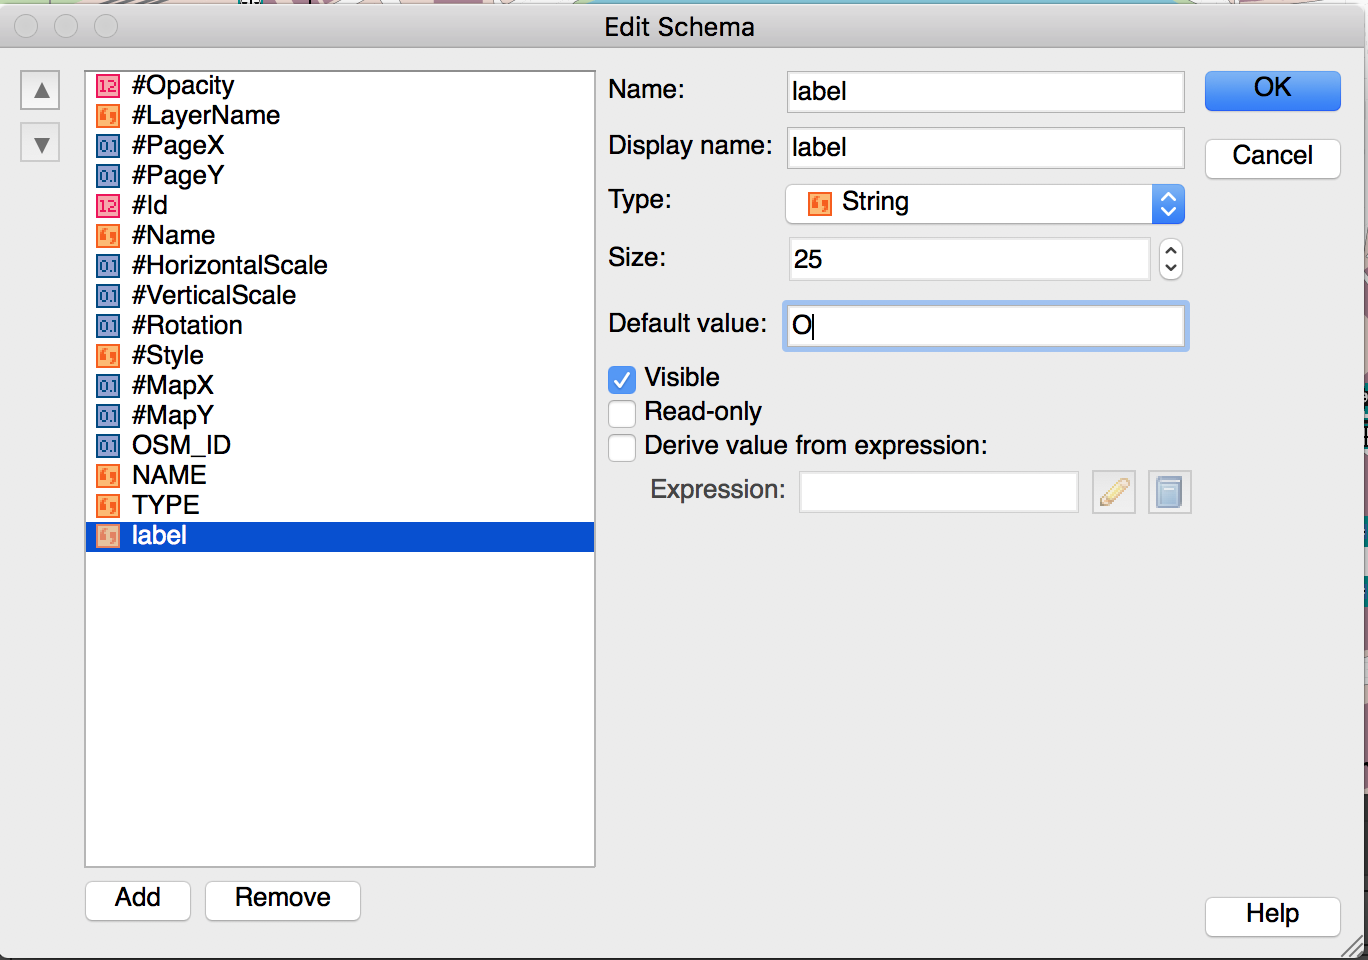
Let’s start by adding a column to the attributes to the OSM points layer and filling it with a default value, a capital O.
Thankfully, there is a way to automate at least part of this process by using MAPublisher and LabelPro.
Editing the attribute schema
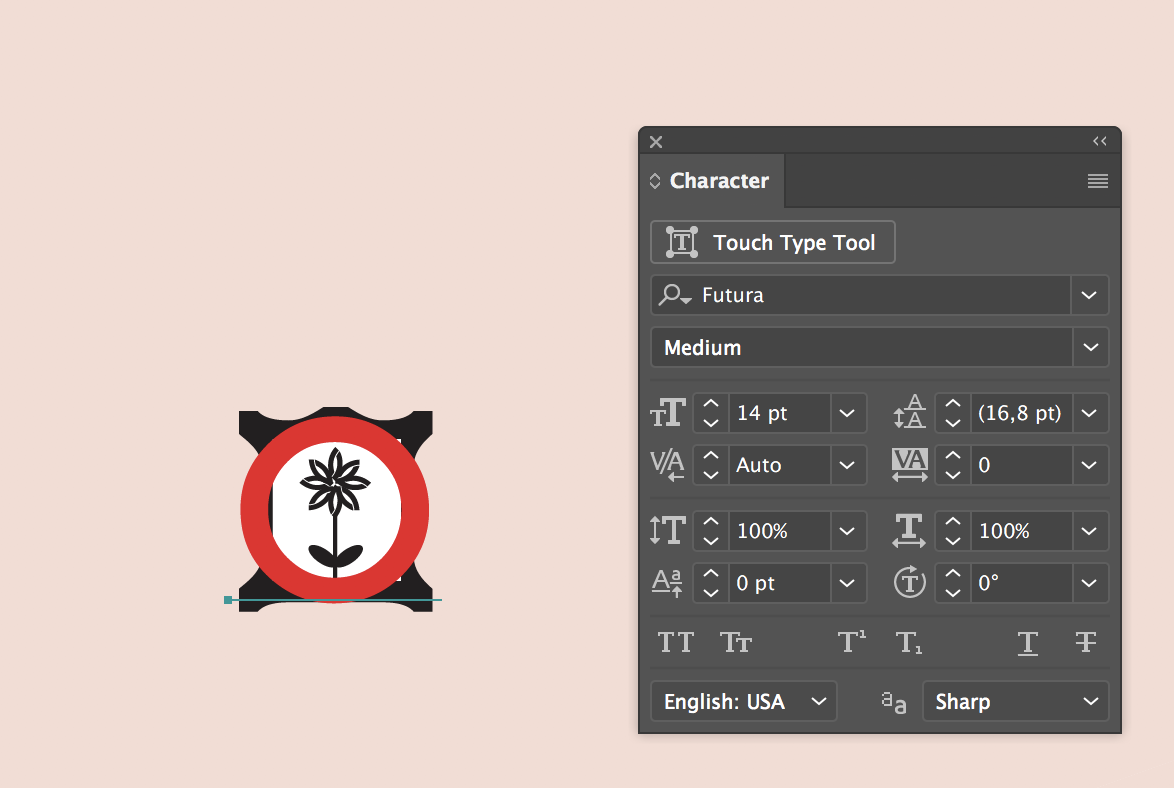
Next, determine how big the symbols are. On the artboard, use the Type tool to place a capital O and adjust its size so that it’s about the same size as one of the point symbols. In this case, a 14 pt Futura Medium, shown here in red, seems to cover it well (your results might be different).
Determine the approximate font size
Futura is a good font in this case because the O is a perfect circle. Once you’ve determined the approximate font size to use, delete the O text as it won’t be needed anymore.
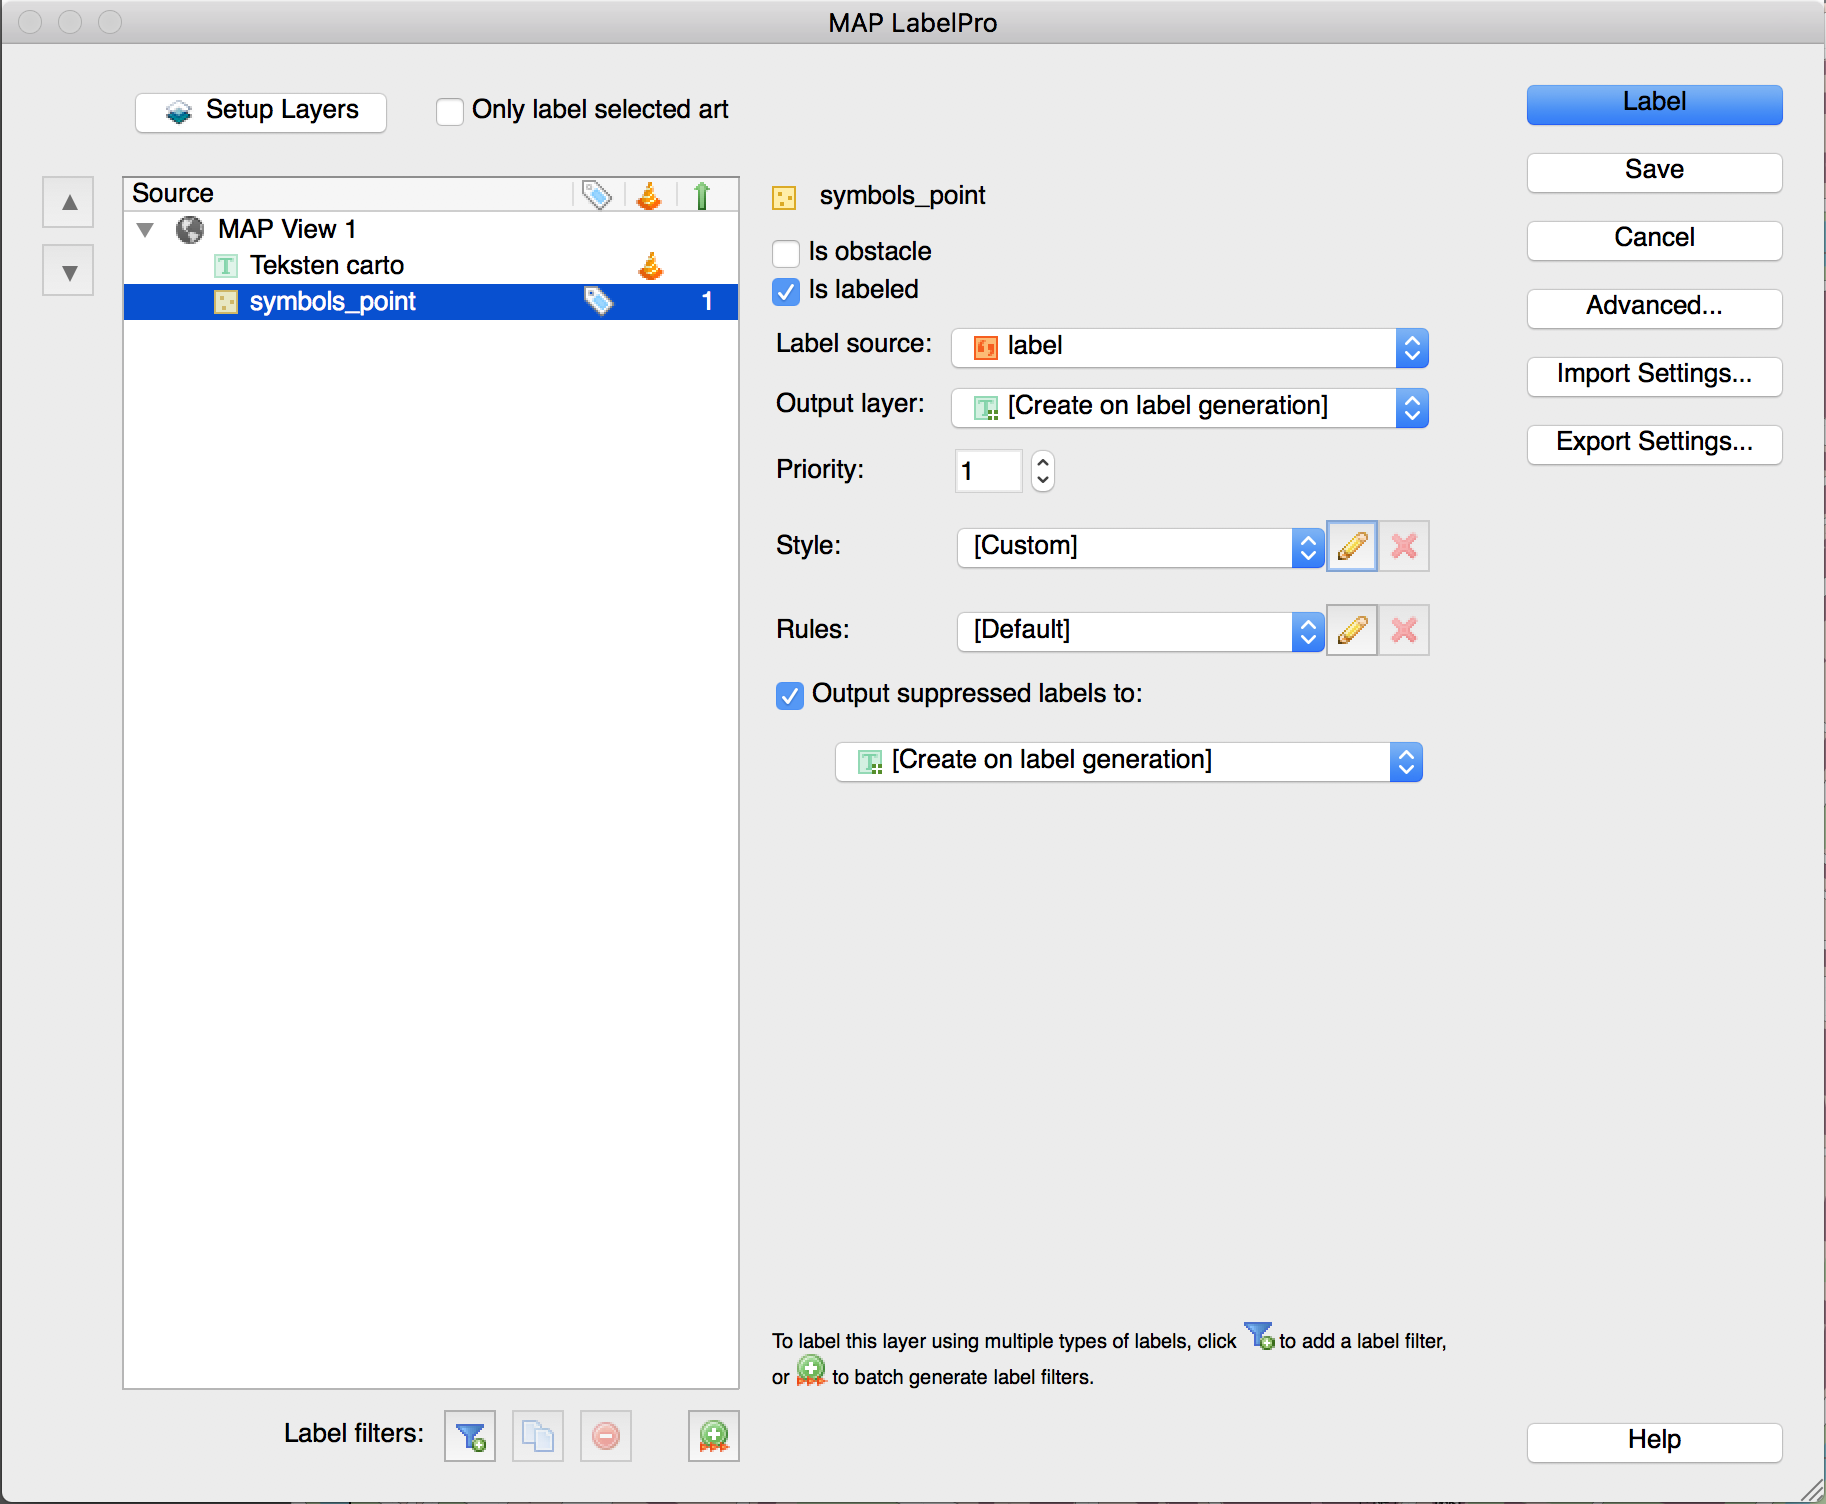
Next, set up the LabelPro labelling rules. Since there is already a layer with the manually placed labels and the symbols shouldn’t interfere with them, the manually placed labels will be designated as an obstacle layer. The symbols layer will be labelled with the attribute created earlier and the style set to the font and size that was just determined.
Set obstacle layer
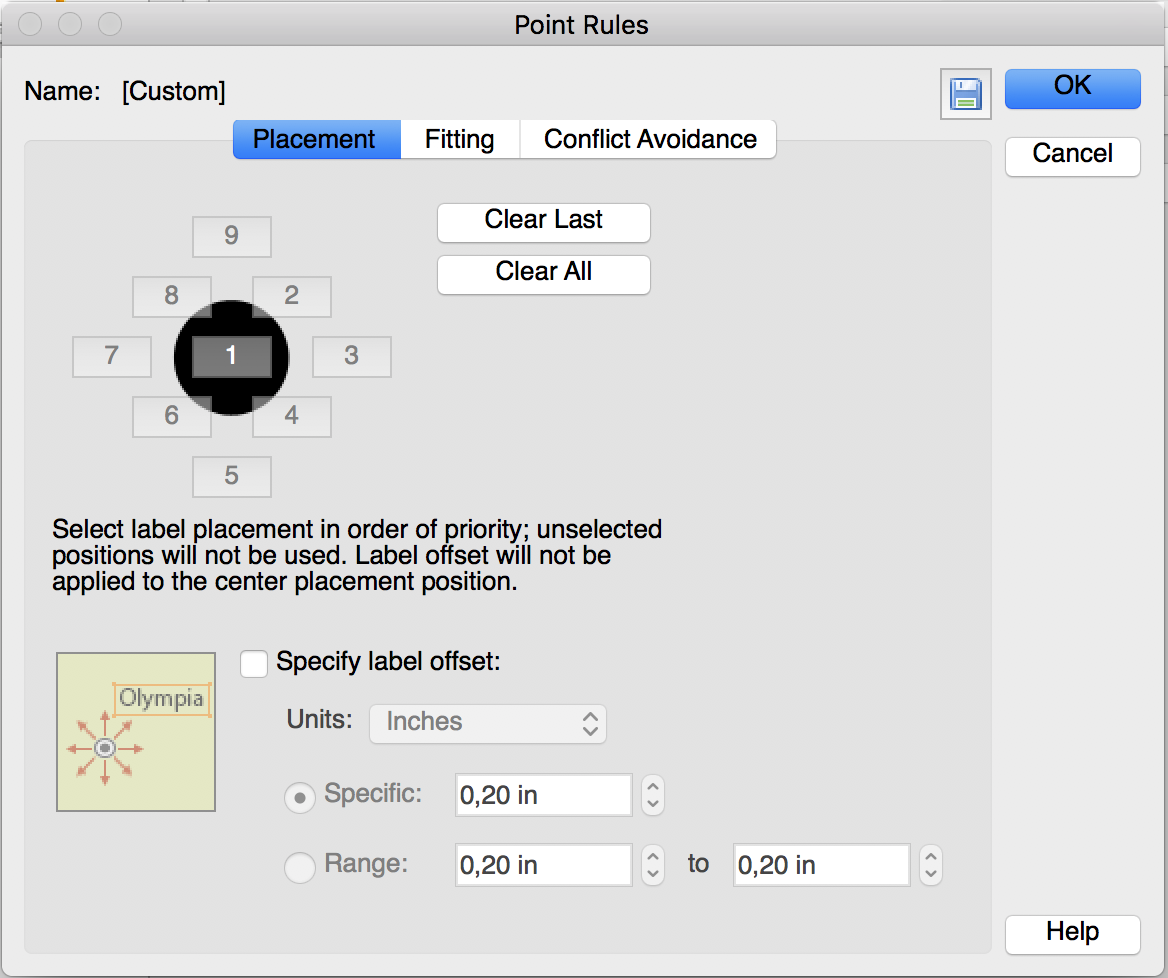
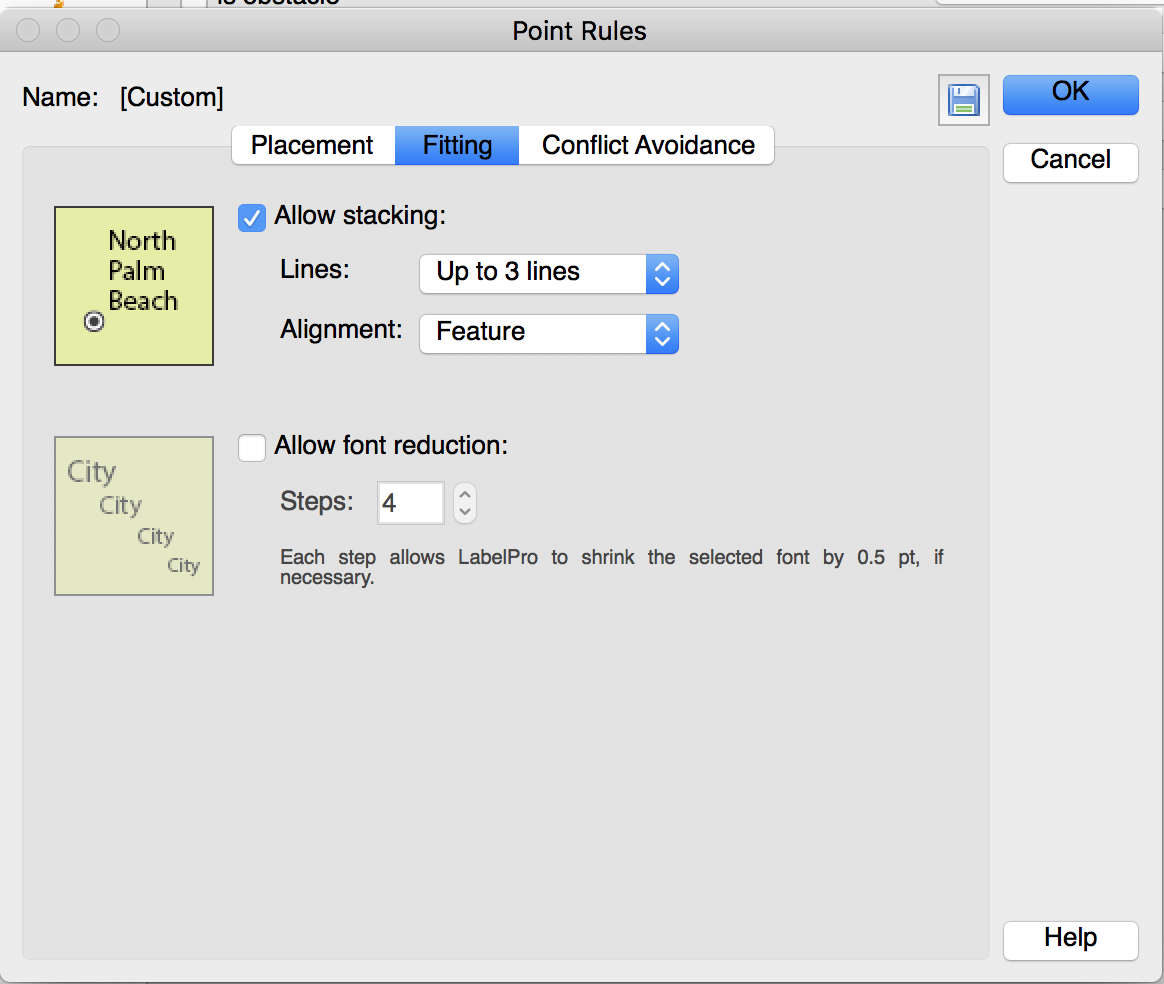
Setting the appropriate rules partly depends on personal preference but it’s important to specify that the placement prefers the center position (position 1 on the placement control). In other words: if there’s enough space for placement, the label doesn’t need to be moved or offset. Another important rule to configure is that font reduction should be turned off. All of the labels (eventually symbols) are going to be a fixed and similar size.
Set placement point rulesSet fitting point rules
Also, another good practice is to specify a suppression layer. Any labels that can’t be placed with the rules set will be placed on the suppression layer. After placement, you can determine if any labels need to be adjusted manually.
Let’s label! Go ahead and label with these settings and afterward hide the original symbols layer and the suppression layer. The map is filled with O’s where the original symbols are located.
O labels placed
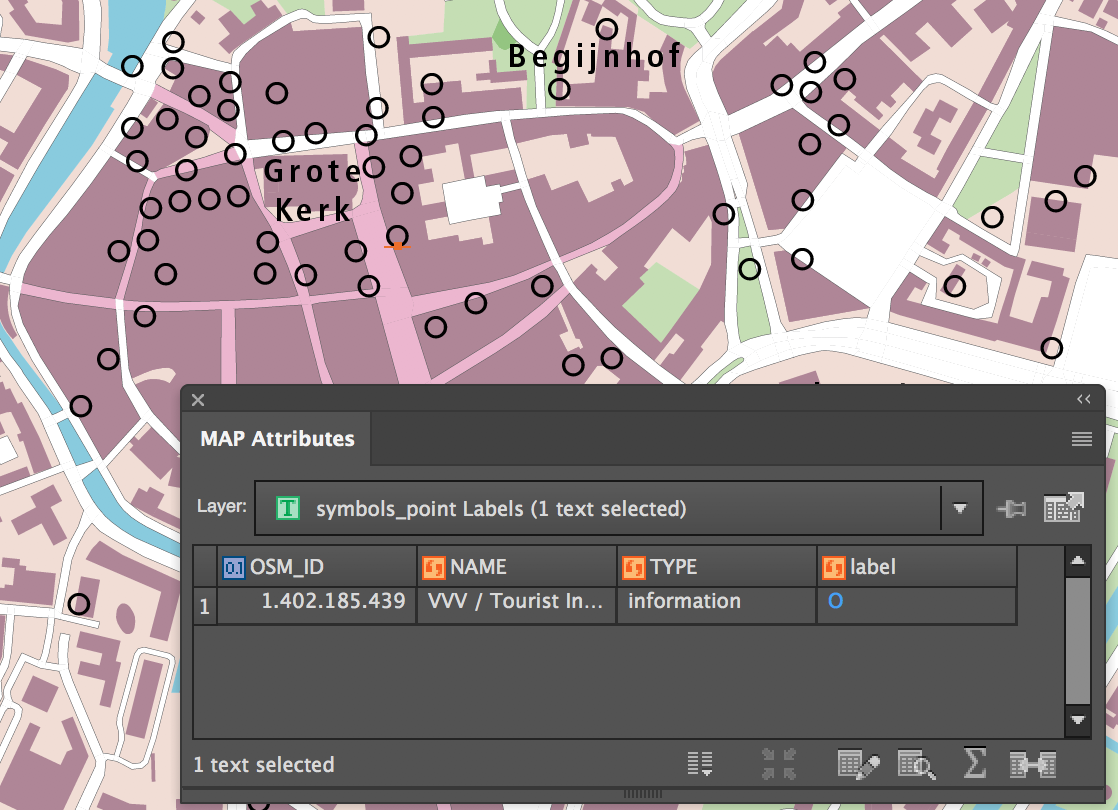
At first glance, this does not seem very useful, but closer inspection shows that the labels have retained the attributes of the original OSM point symbols.
Attributes migrated to the O labels
This means that if they can be turned back into points, they will be able to be styled!
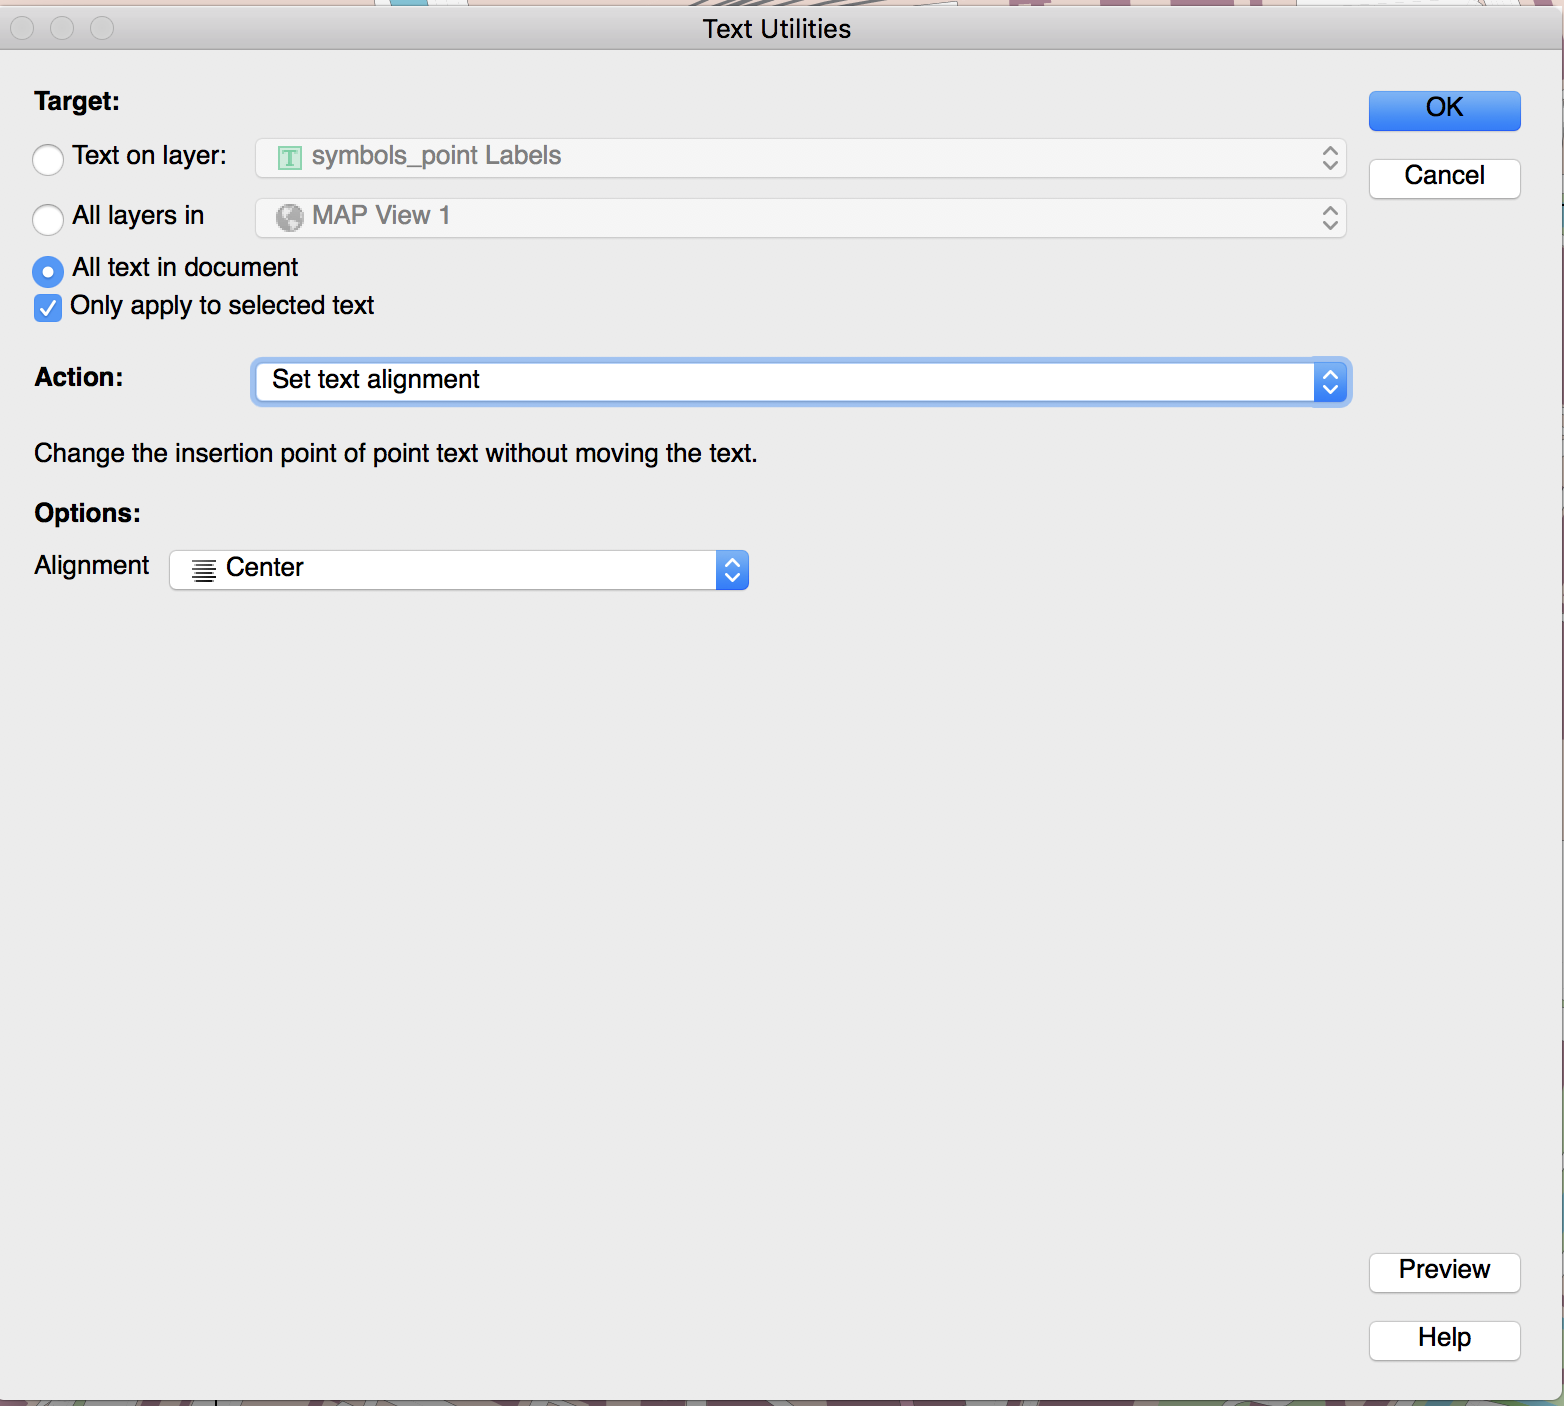
In order to turn them back into points, a text reference point needs to be created. In other words: a little dot on the text selection line, in the center of the O. This is a two-step process. First, select all the O’s on the artboard, open MAPublisher Text Utilities, and set the Action to Set text alignment and Alignment to Center. This action changes the alignment of the text without changing the actual position of the text (due to LabelPro labeling the text alignment is different based on where the label ended up in relation to the original point). This step takes care of the horizontal positioning.
Set text alignment in MAPublisher Text Utilities
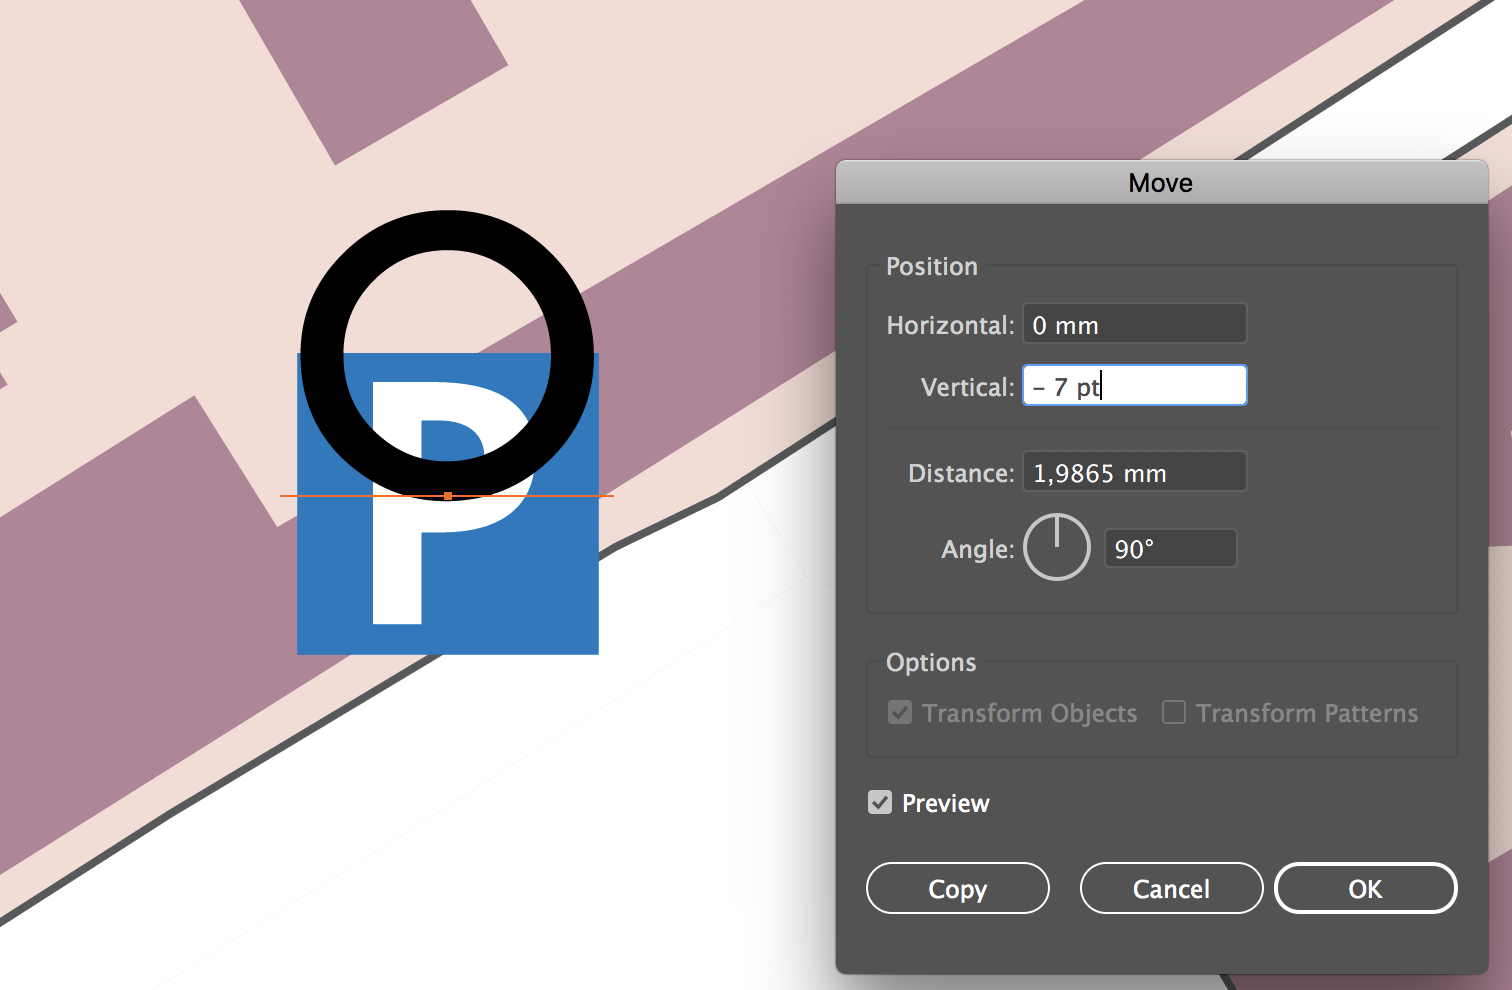
The second step is to adjust vertical positioning. Vertical positioning is adjusted by moving all text up by a certain distance. Make sure all the O’s are selected, then use the (Adobe Illustrator) Move tool. In the Position group, set the Horizontal to 0 (no adjustment here since Text Utilities was used), set the Vertical to minus half the text size (font size in this example was 14 pt, so a vertical adjustment of -7 pt), and the Angle to 90 degrees.
Use the Move panel to fine tune position
For reference, this example is zoomed into a symbol that did not get displaced.
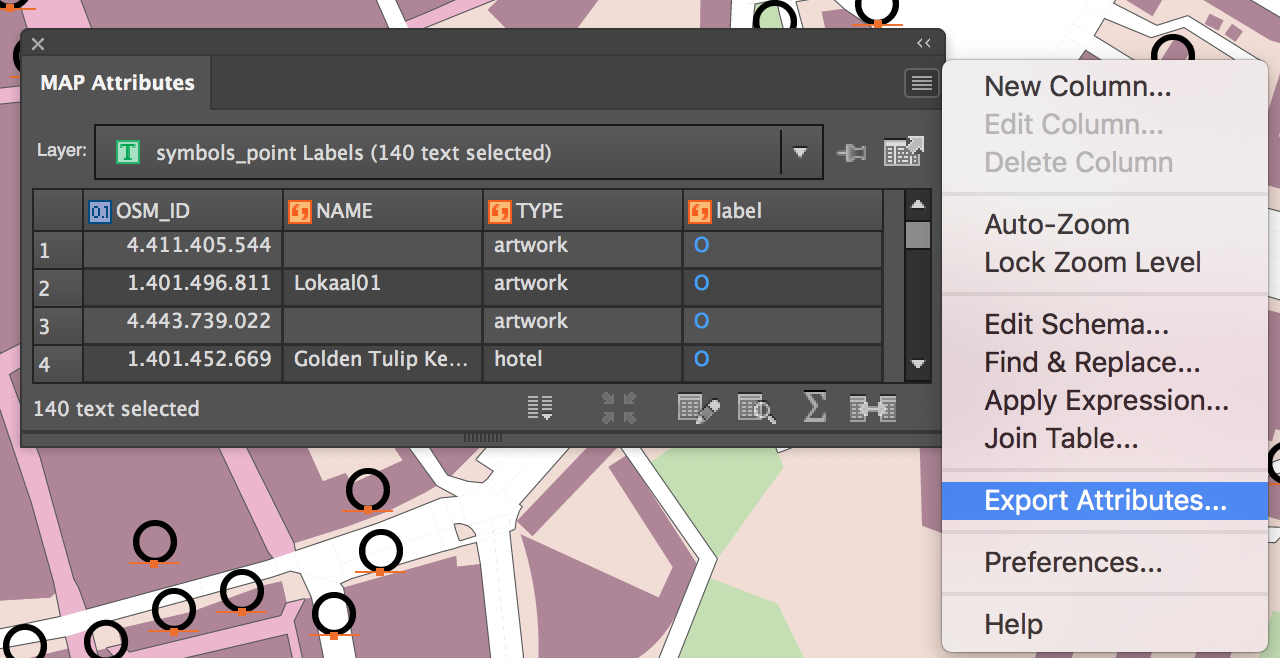
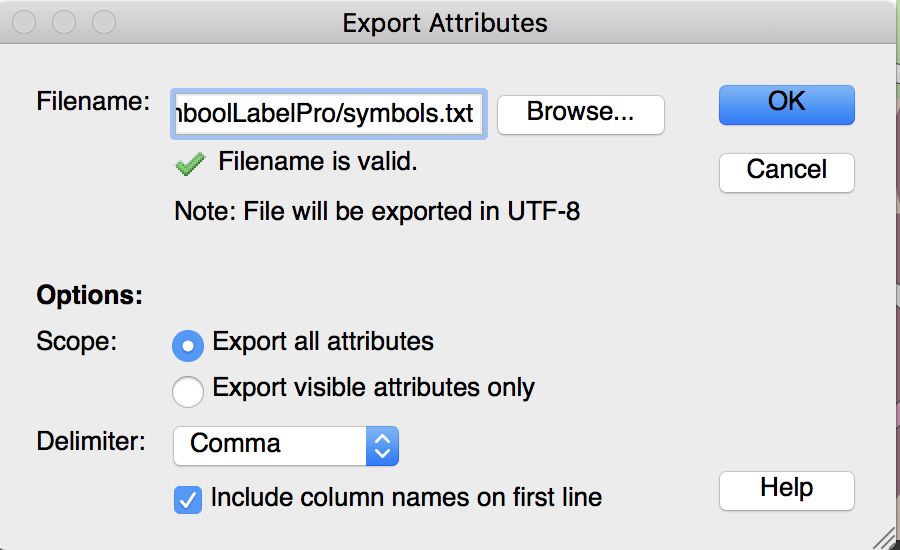
Next, these labels need to be turned into point symbols. There is a handy option in MAPublisher Text Utilities that can do that, but it places a point to the lower left of the text and the symbols need to use the center text reference point that was just created. Instead, with all of the O labels selected, open the MAP Attributes panel and export the attribute table to a text file. Make sure to specify the option Export All Attributes because there are two important hidden attributes needed to make this work: #MapX and #MapY, which are the coordinates of the text reference point.
Export attributes to a .txt file (Click for larger version)Export attributes to a .txt file
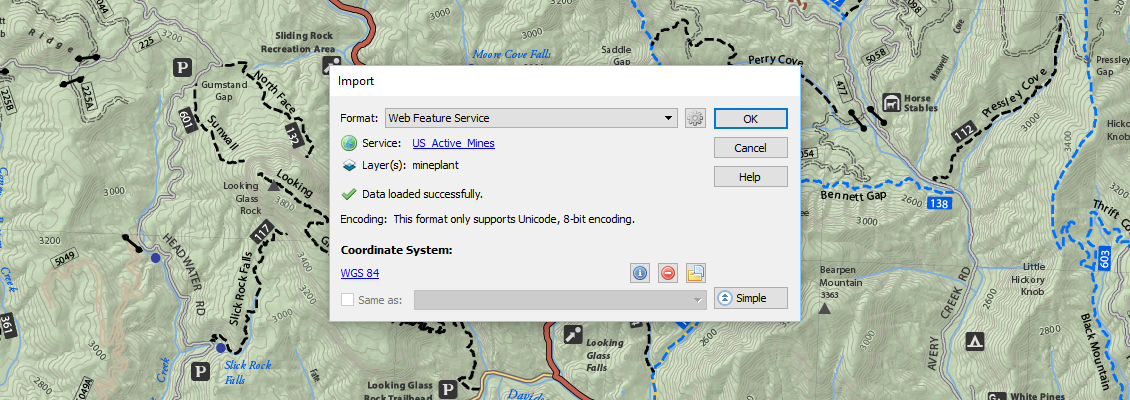
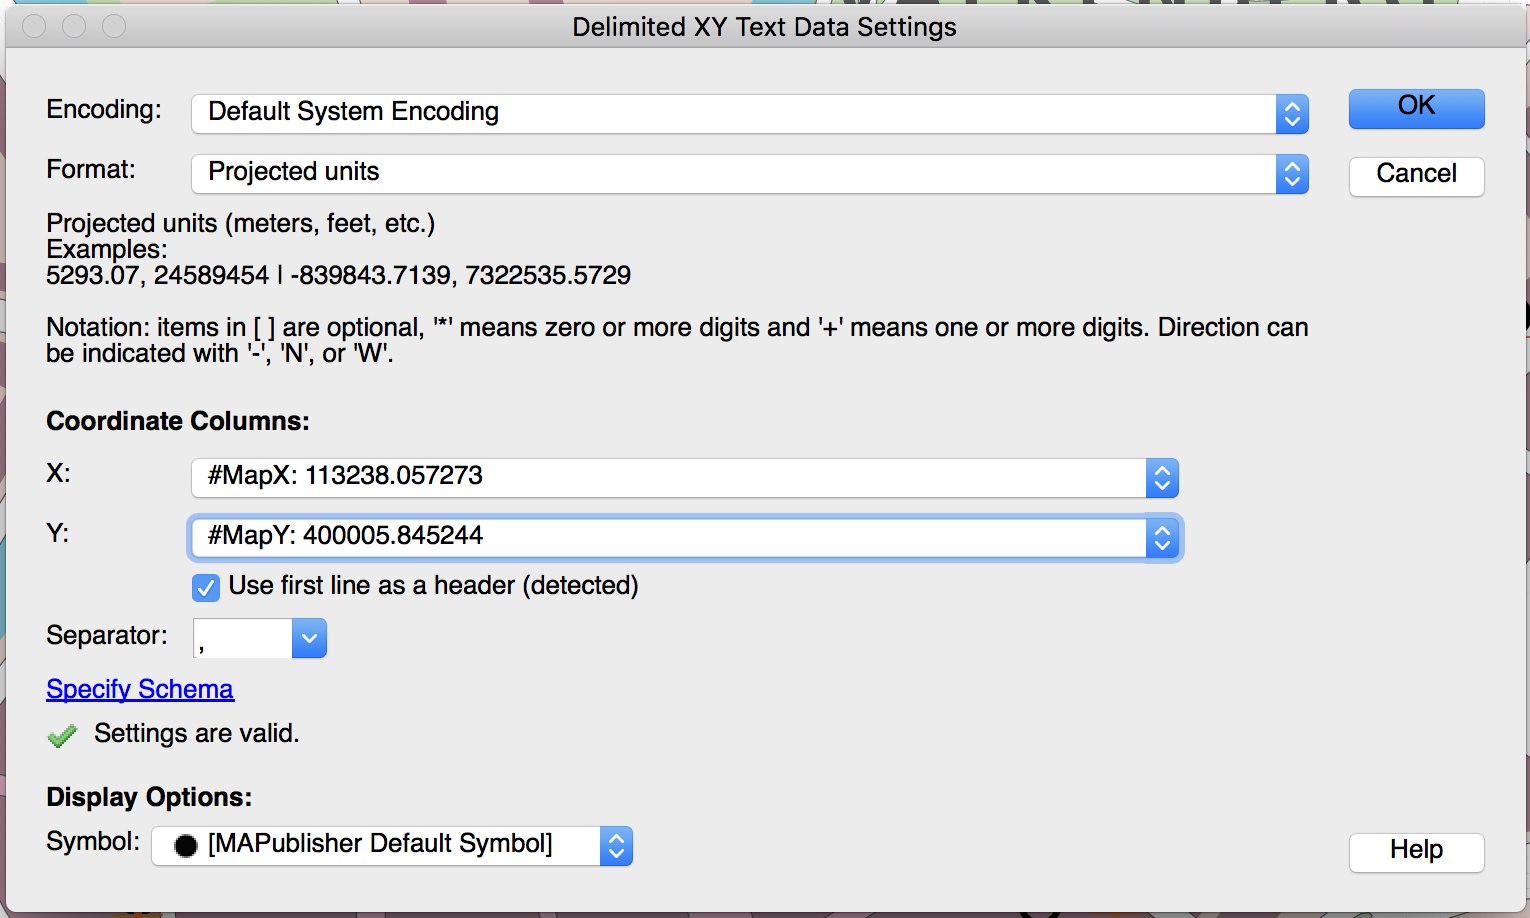
Using MAPublisher Import, add the attributes text file that was just created to the map and make sure to appropriately specify #MapX and #MapY in the X and Y coordinate columns.
Import .txt file as Delimited XY
Since there is no projection information stored in the text file, you’ll need to specify that the coordinates are in the same system as the MAP View it’s coming from and you’ll need to add it to that MAP View upon import.
On the map, there is now a new point layer and because they still have all of their original attributes, the layer can simply be added to the MAP Theme to have all the point symbols reapplied to them instantly. Let’s admire the results:
Symbols reapplied with MAP Themes
If needed, repeat the last few steps for the suppressed labels as well (to a different file and different layer of course) to see what still needs to be done manually.
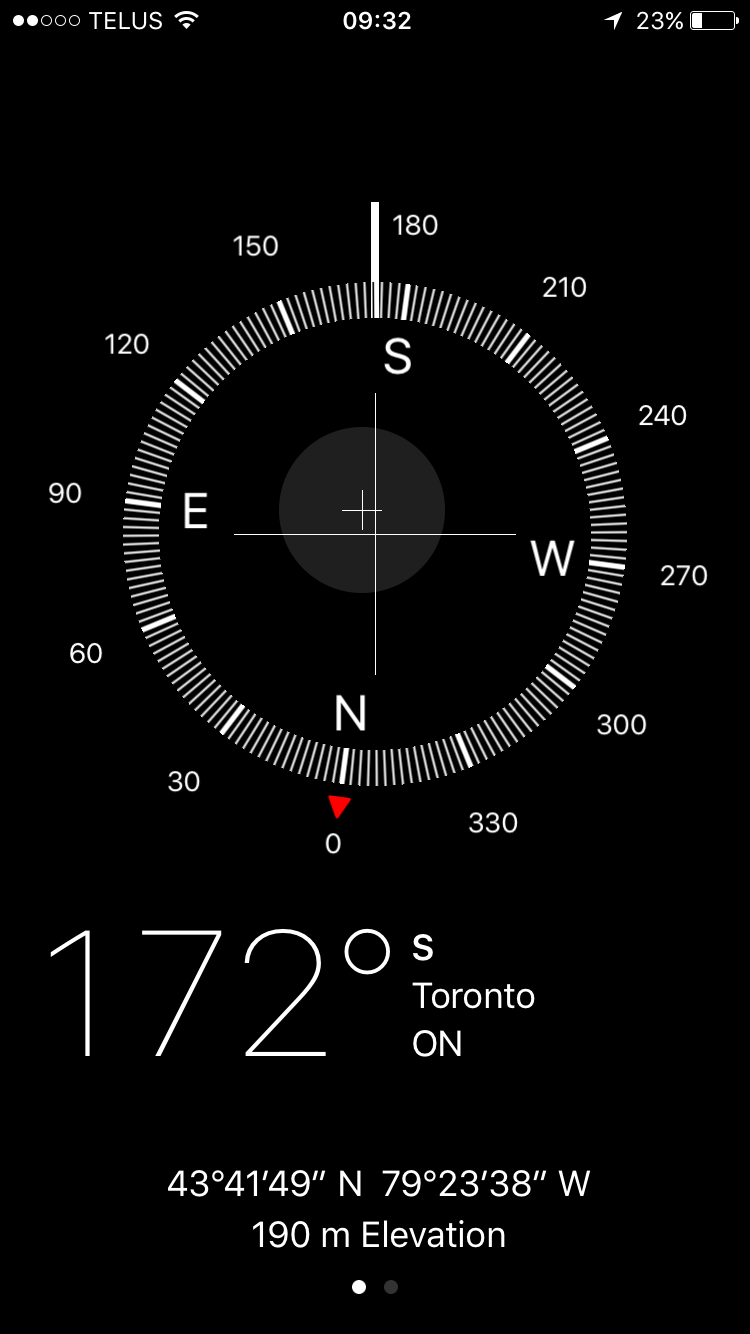
One of the great features of Avenza Maps is being able to navigate offline using your own maps or maps from the Map Store. By tapping the GPS icon twice (once to locate yourself and then again to enable the compass), the map will rotate and align with your compass. Your current location is represented by a blue dot and the little arrow points in the direction you are facing. This feature allows you to navigate easily, however it can be problematic when your devices’ compass isn’t calibrated. If you notice that your blue dot’s arrow is not pointing in the right direction, or isn’t functioning as you’d expect, try these steps to calibrate your device’s compass!
Android
Not calibrated (Android)
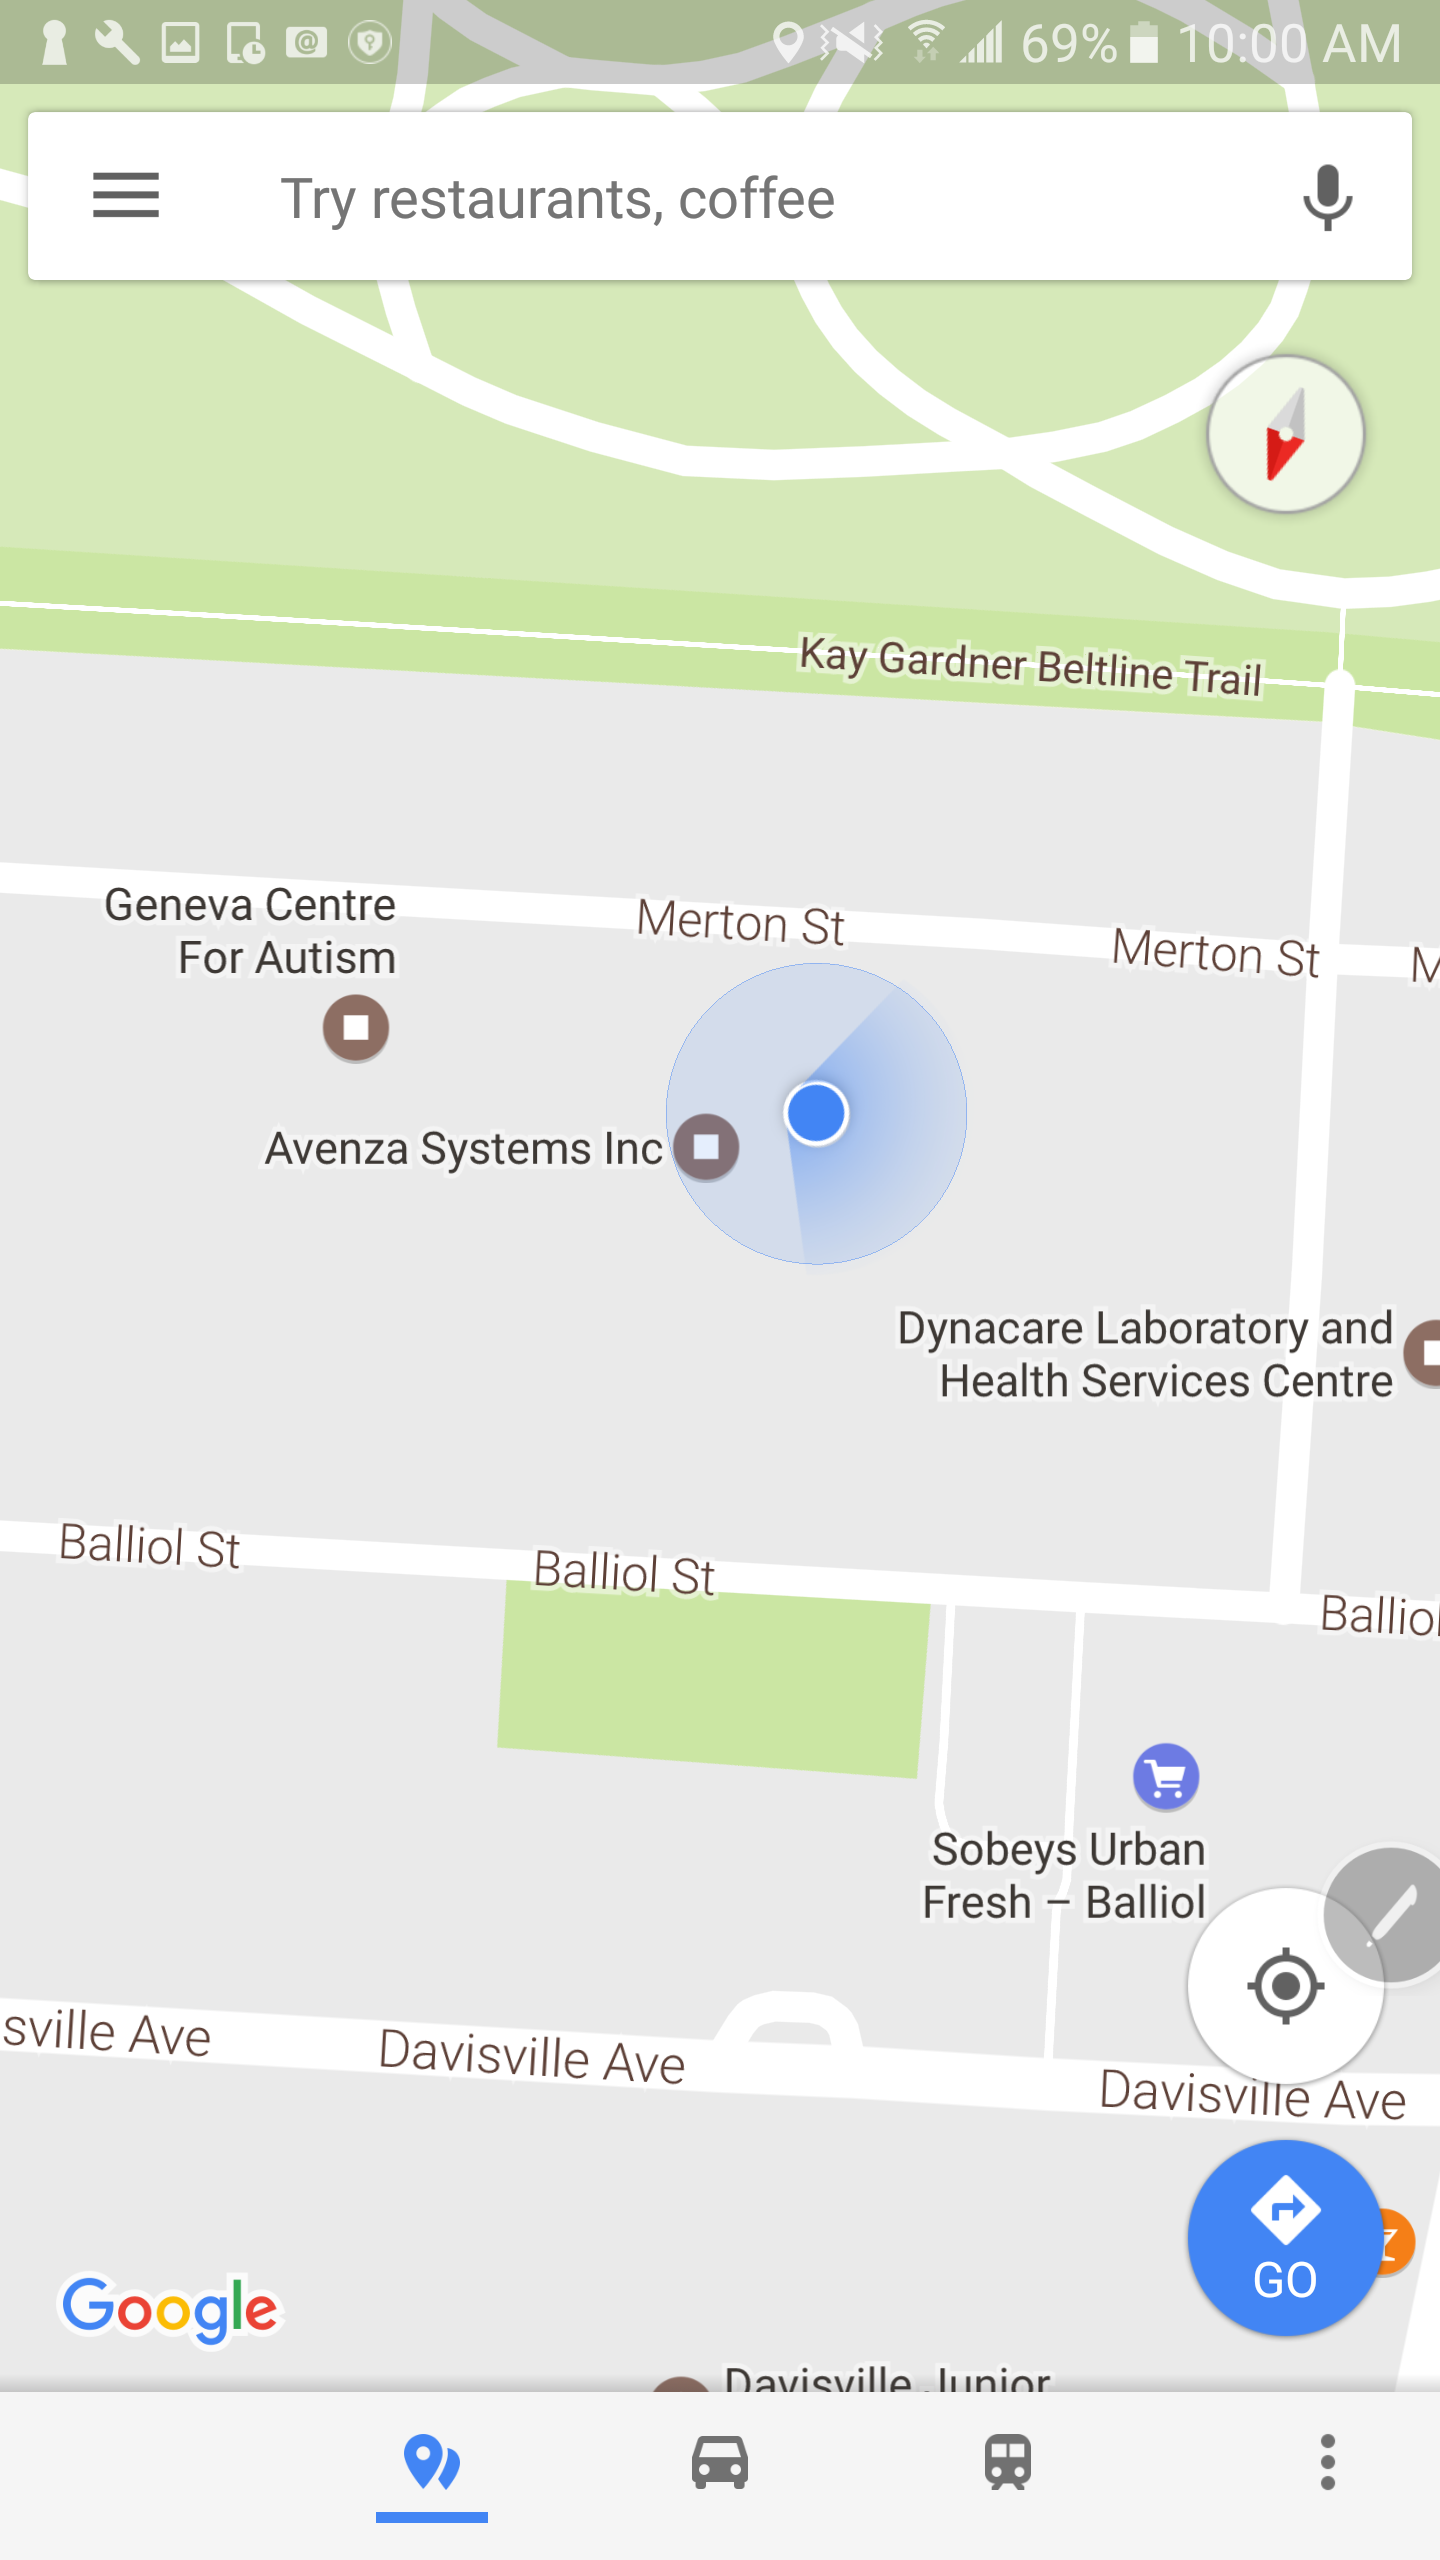
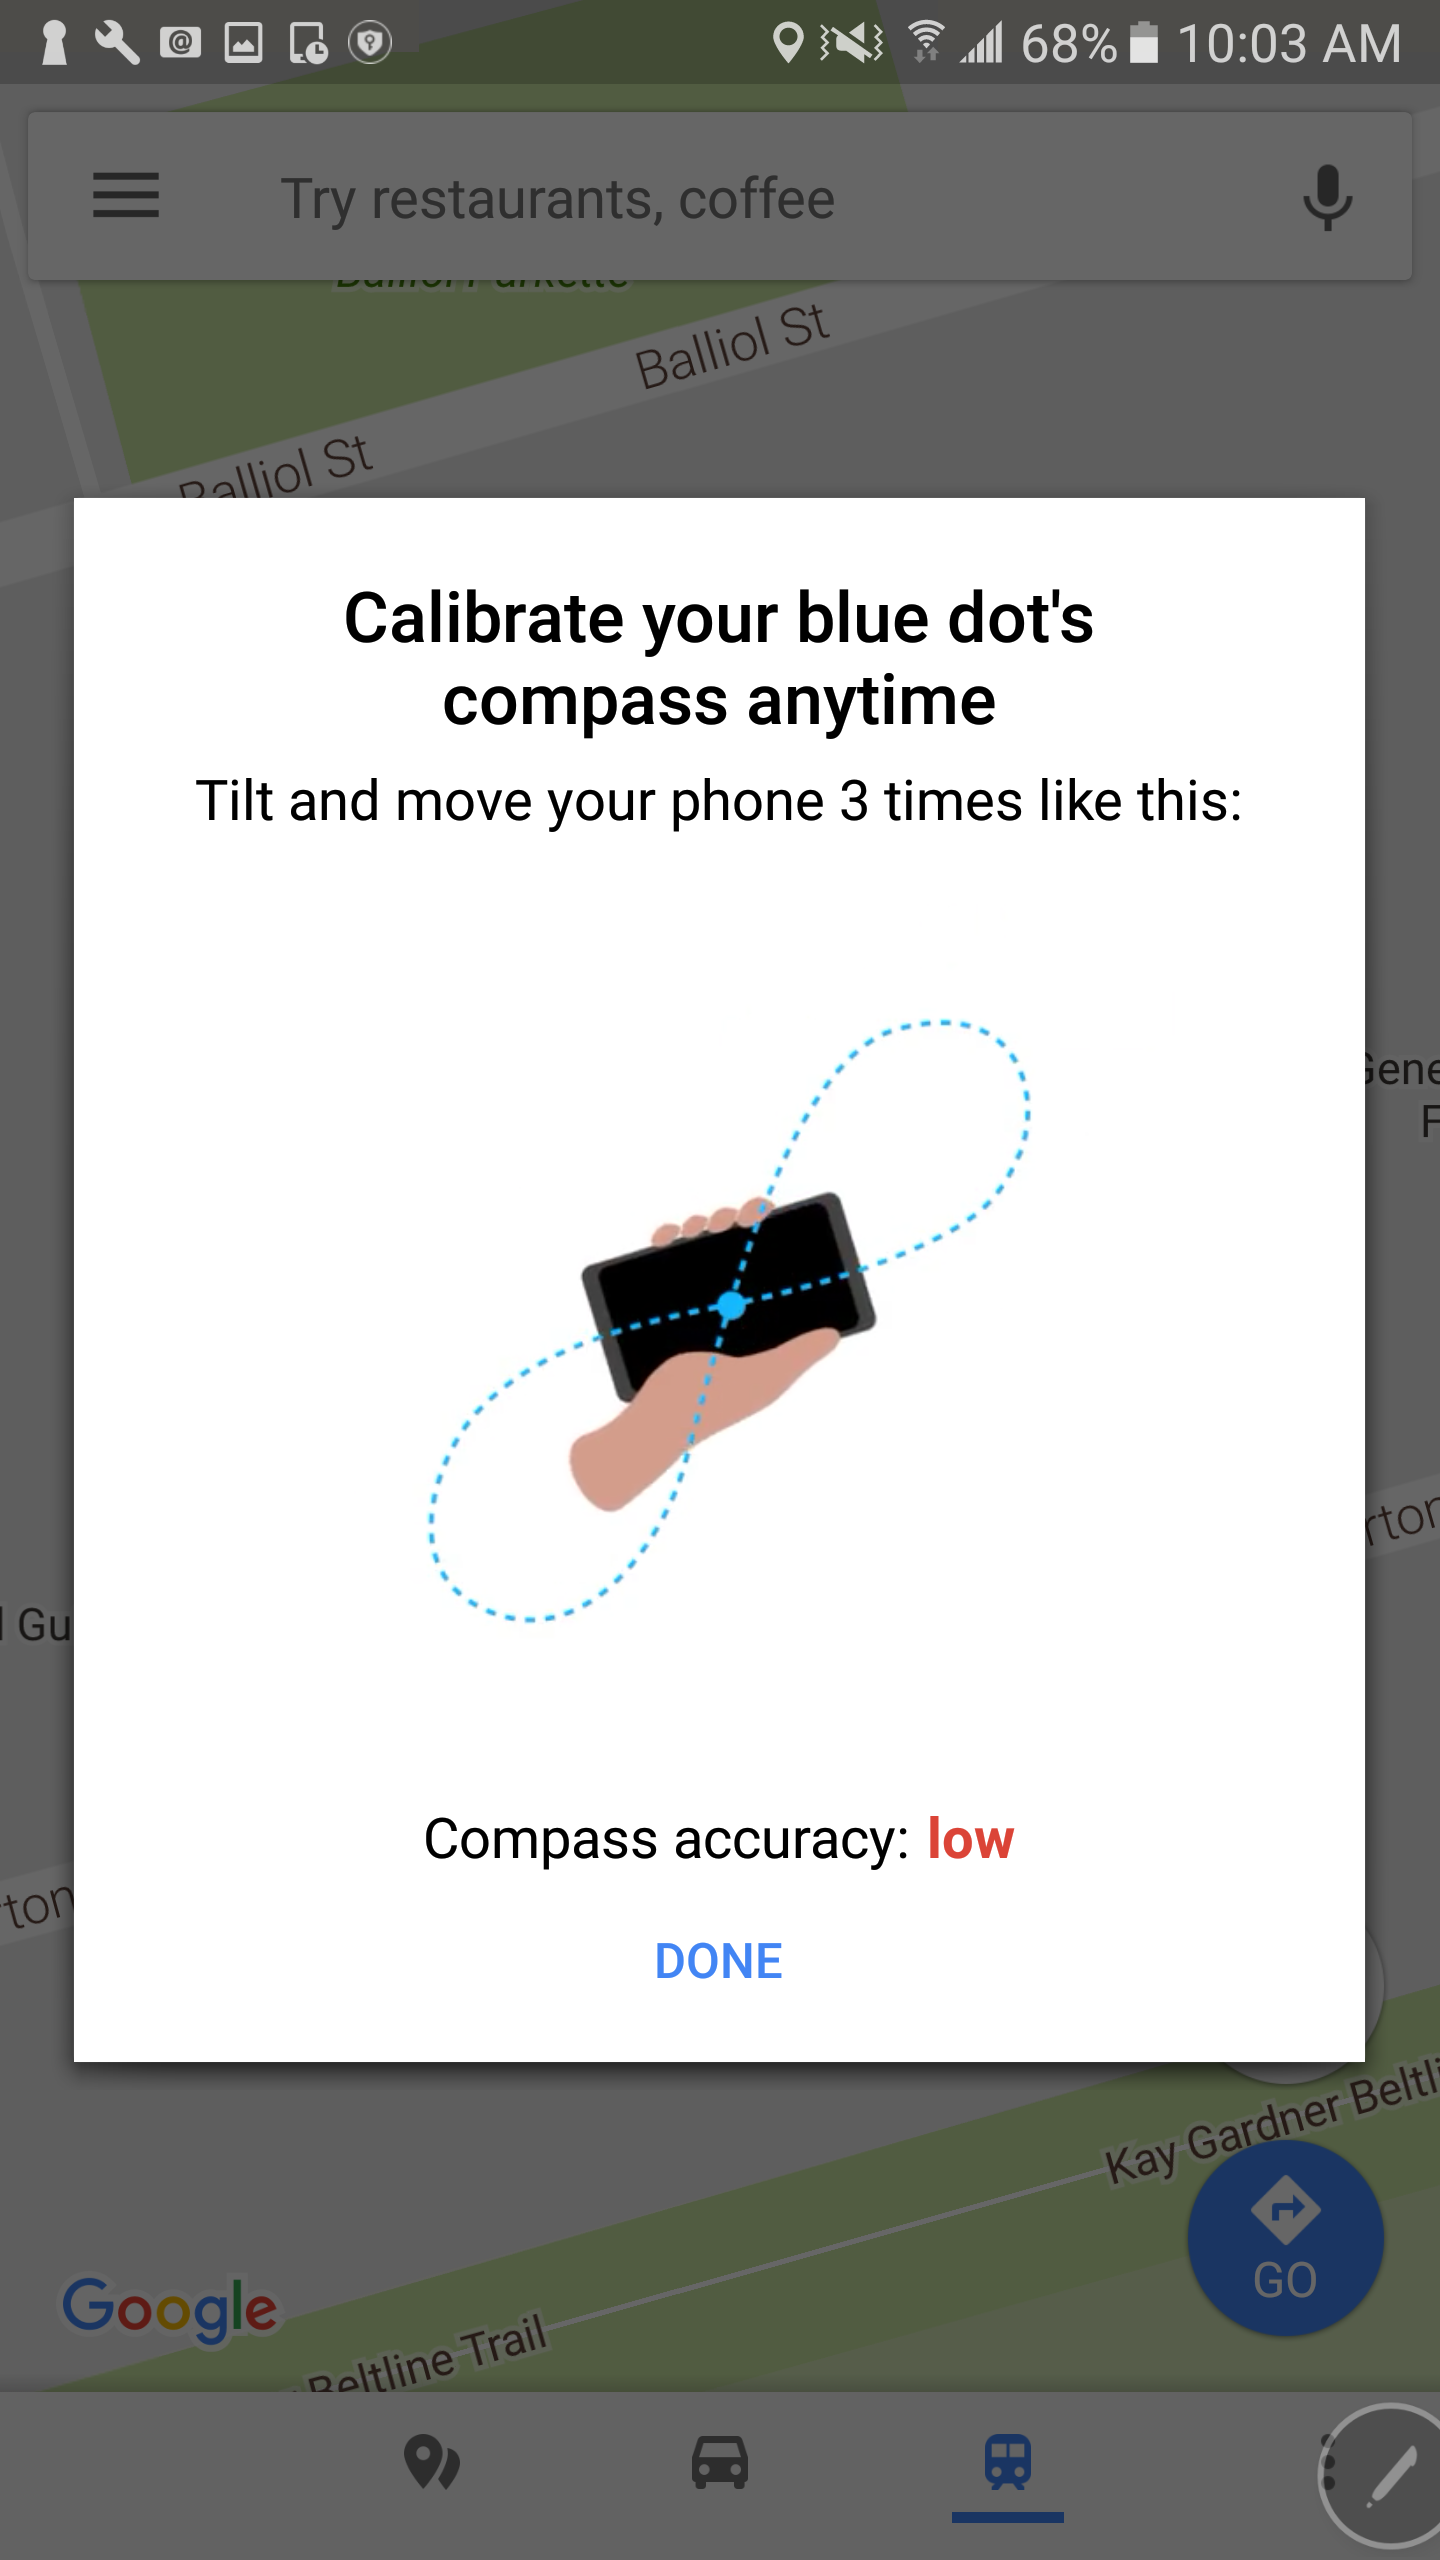
To calibrate your compass on Android, go to your Google Maps app. If your blue dot’s beam (the blue shading coming out of it) is pointing in a different direction to where you are facing or is very wide, your compass will need to be calibrated. To calibrate, tap the blue dot and select “calibrate blue dot compass”. From here, you will be instructed to move and tilt your device in a figure 8 pattern, shown in the following diagram.
Calibrate device (Android)
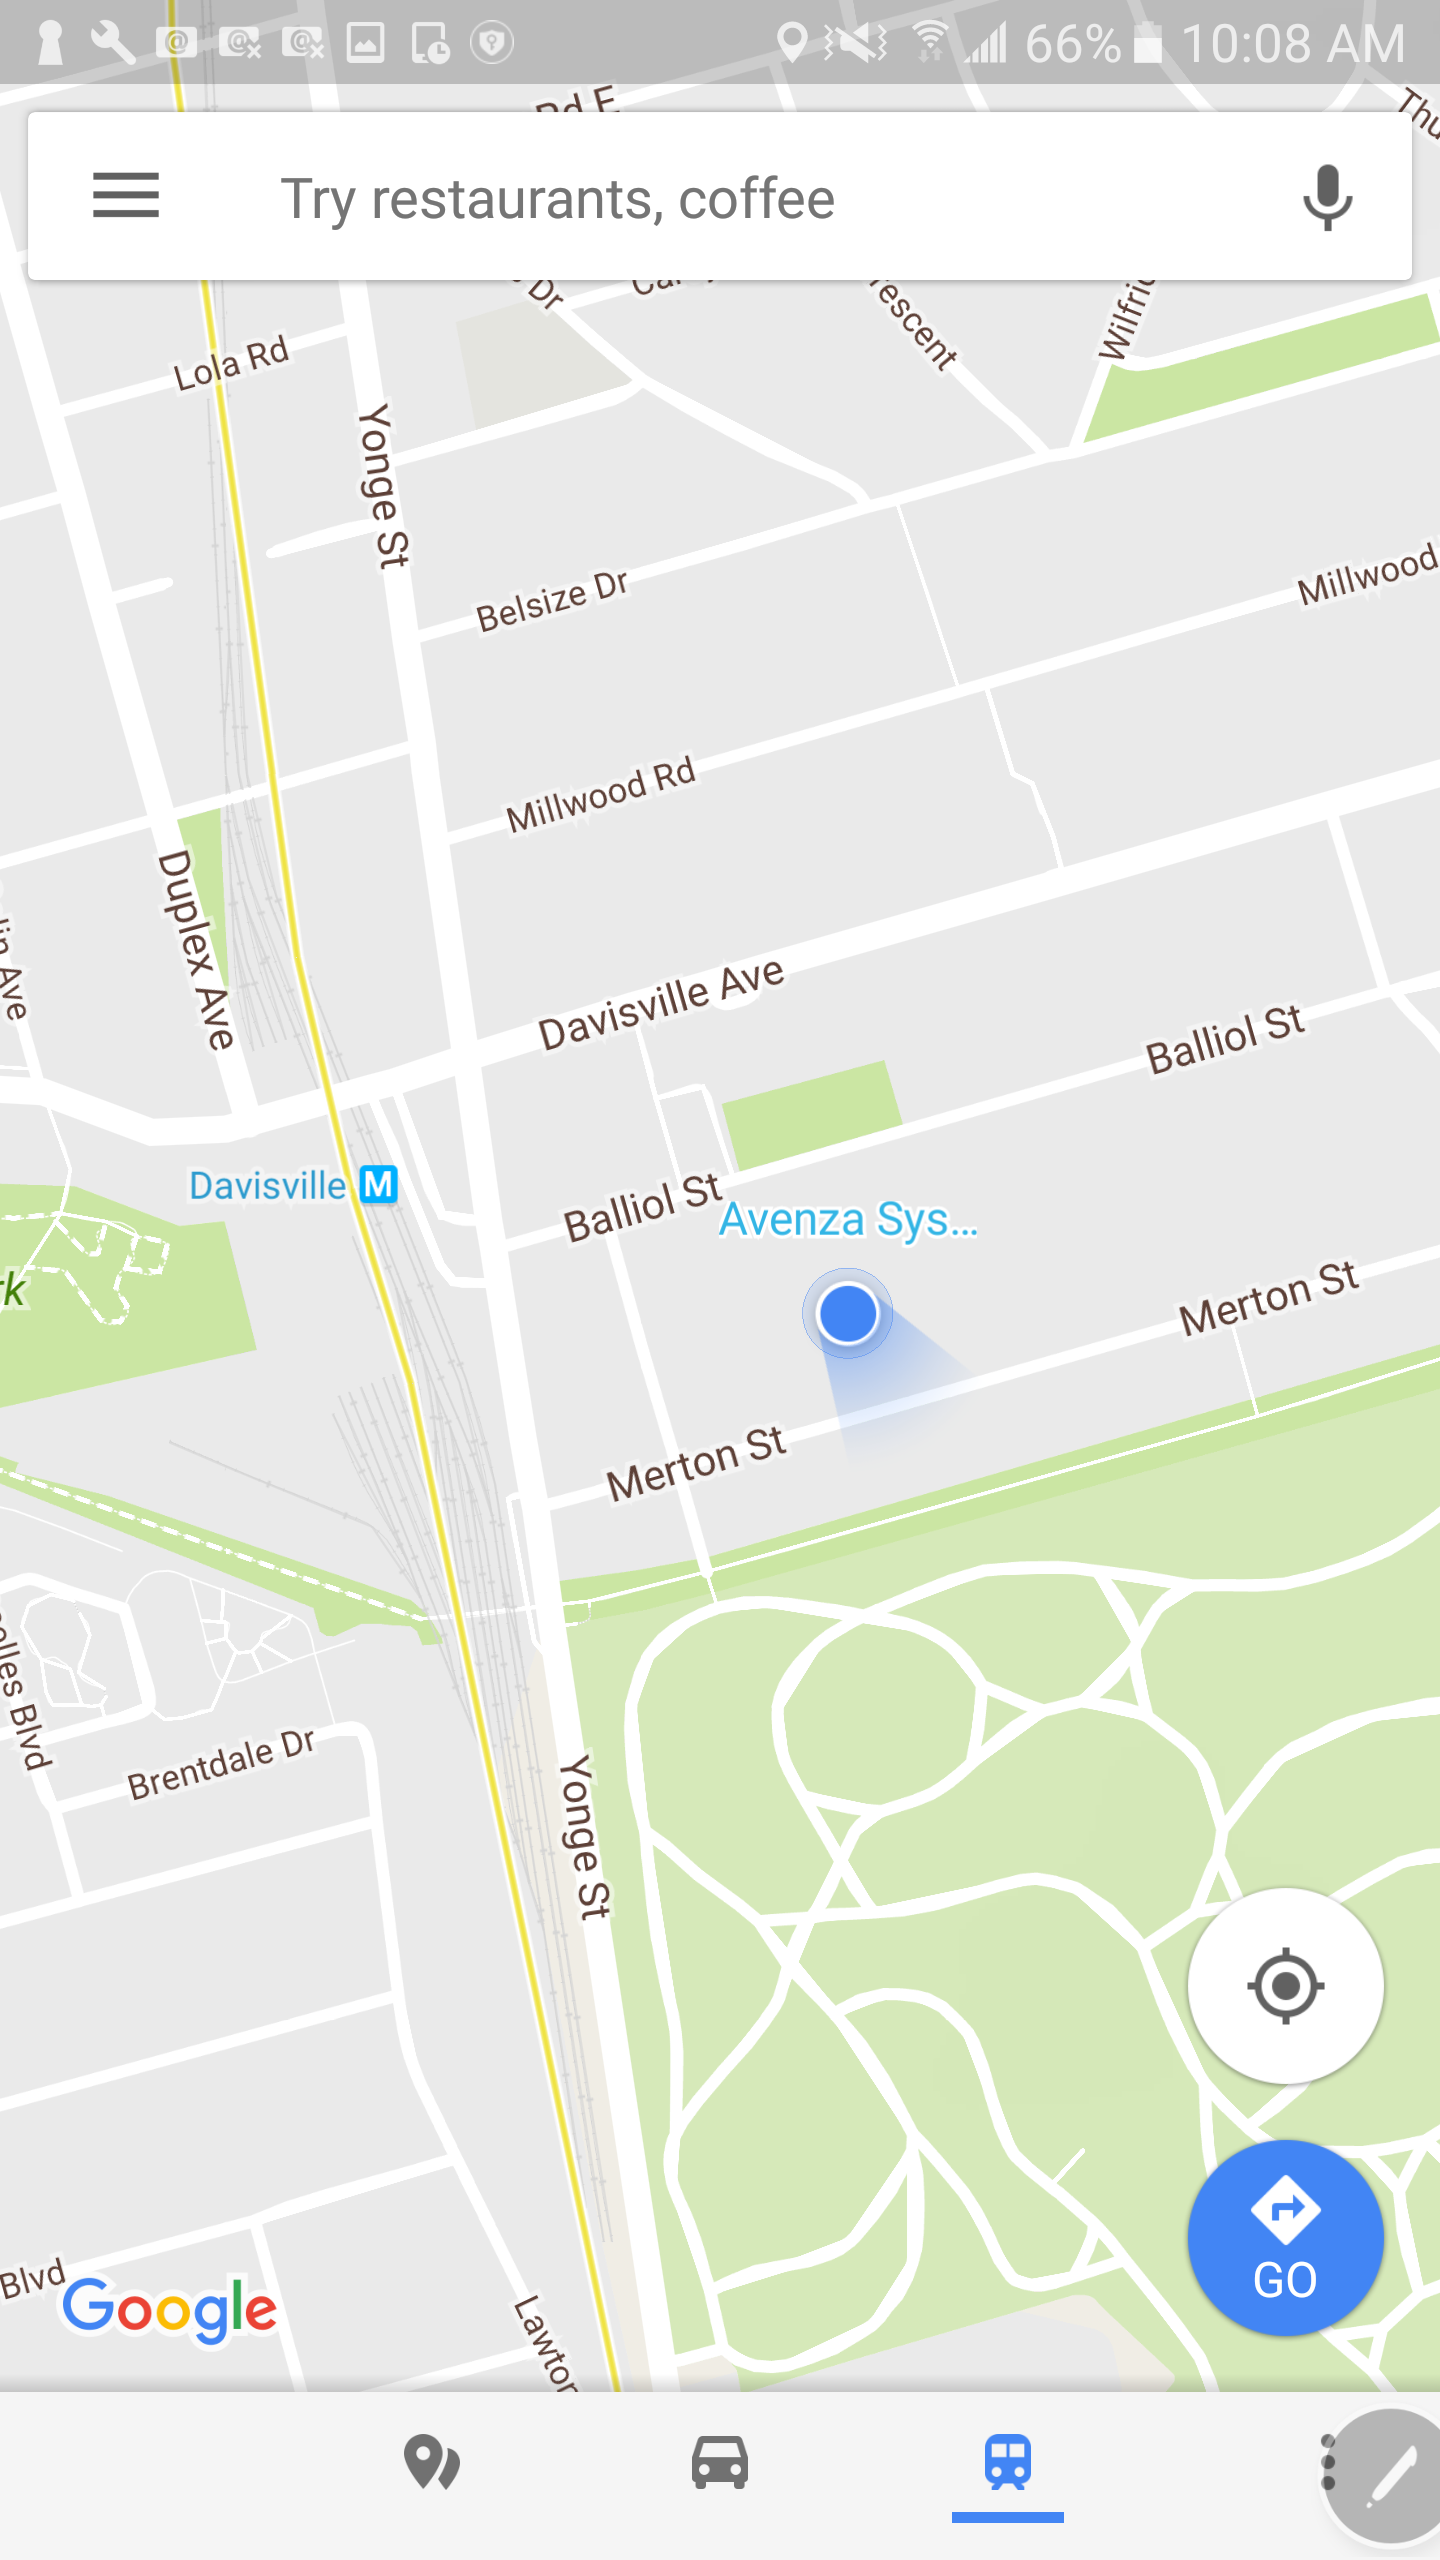
Your compass accuracy will improve as you continue to do this. When you are happy with your compass accuracy, tap Done. The beam from the blue dot on the display will now be narrower and point in the right direction. If at any point the accuracy lowers again, this process can be repeated. If this does not solve your issues, you can select “report blue dot issues” by pressing the blue dot again. For more information, click here.
Calibrated device (Android)
iOS
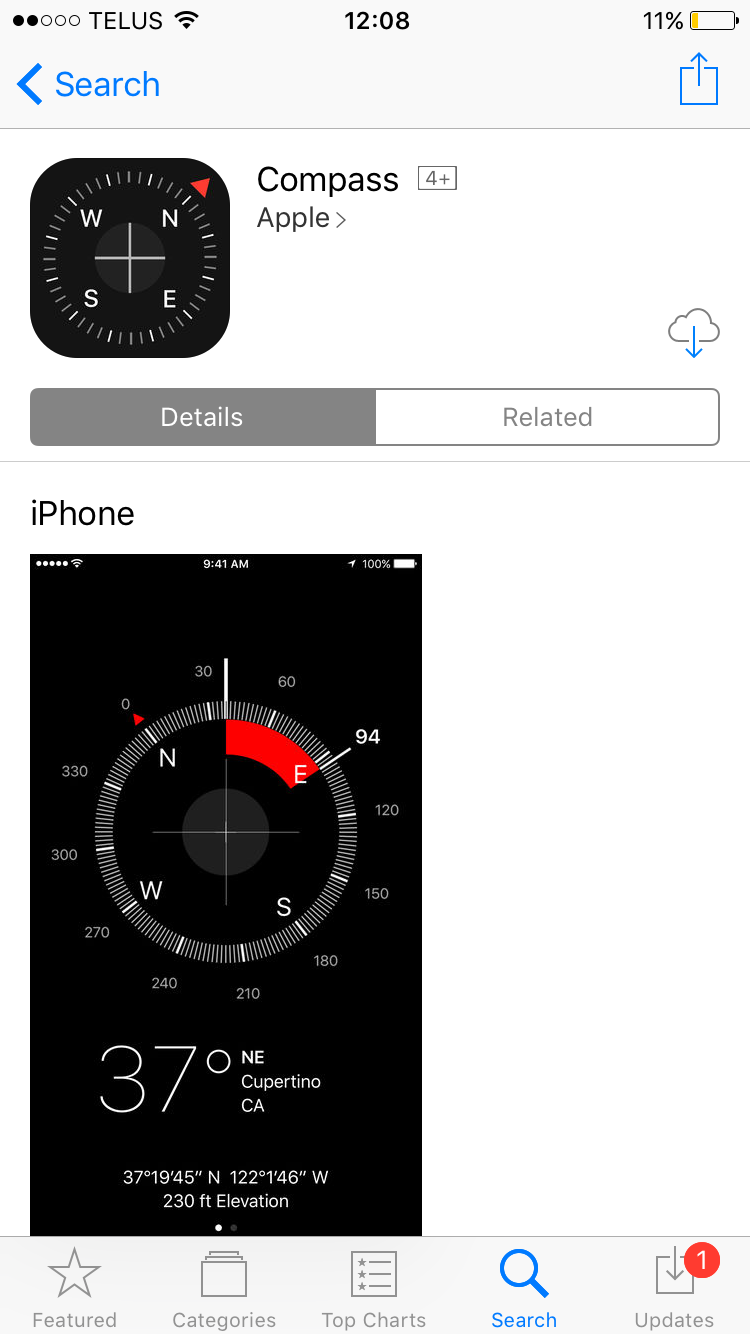
On Apple devices, use the Compass app to calibrate your compass. This app comes pre-installed on iPhone devices. If for any reason it has been deleted, it can be found in the App Store if you search for “Compass”.
Compass app on App Store (iOS)
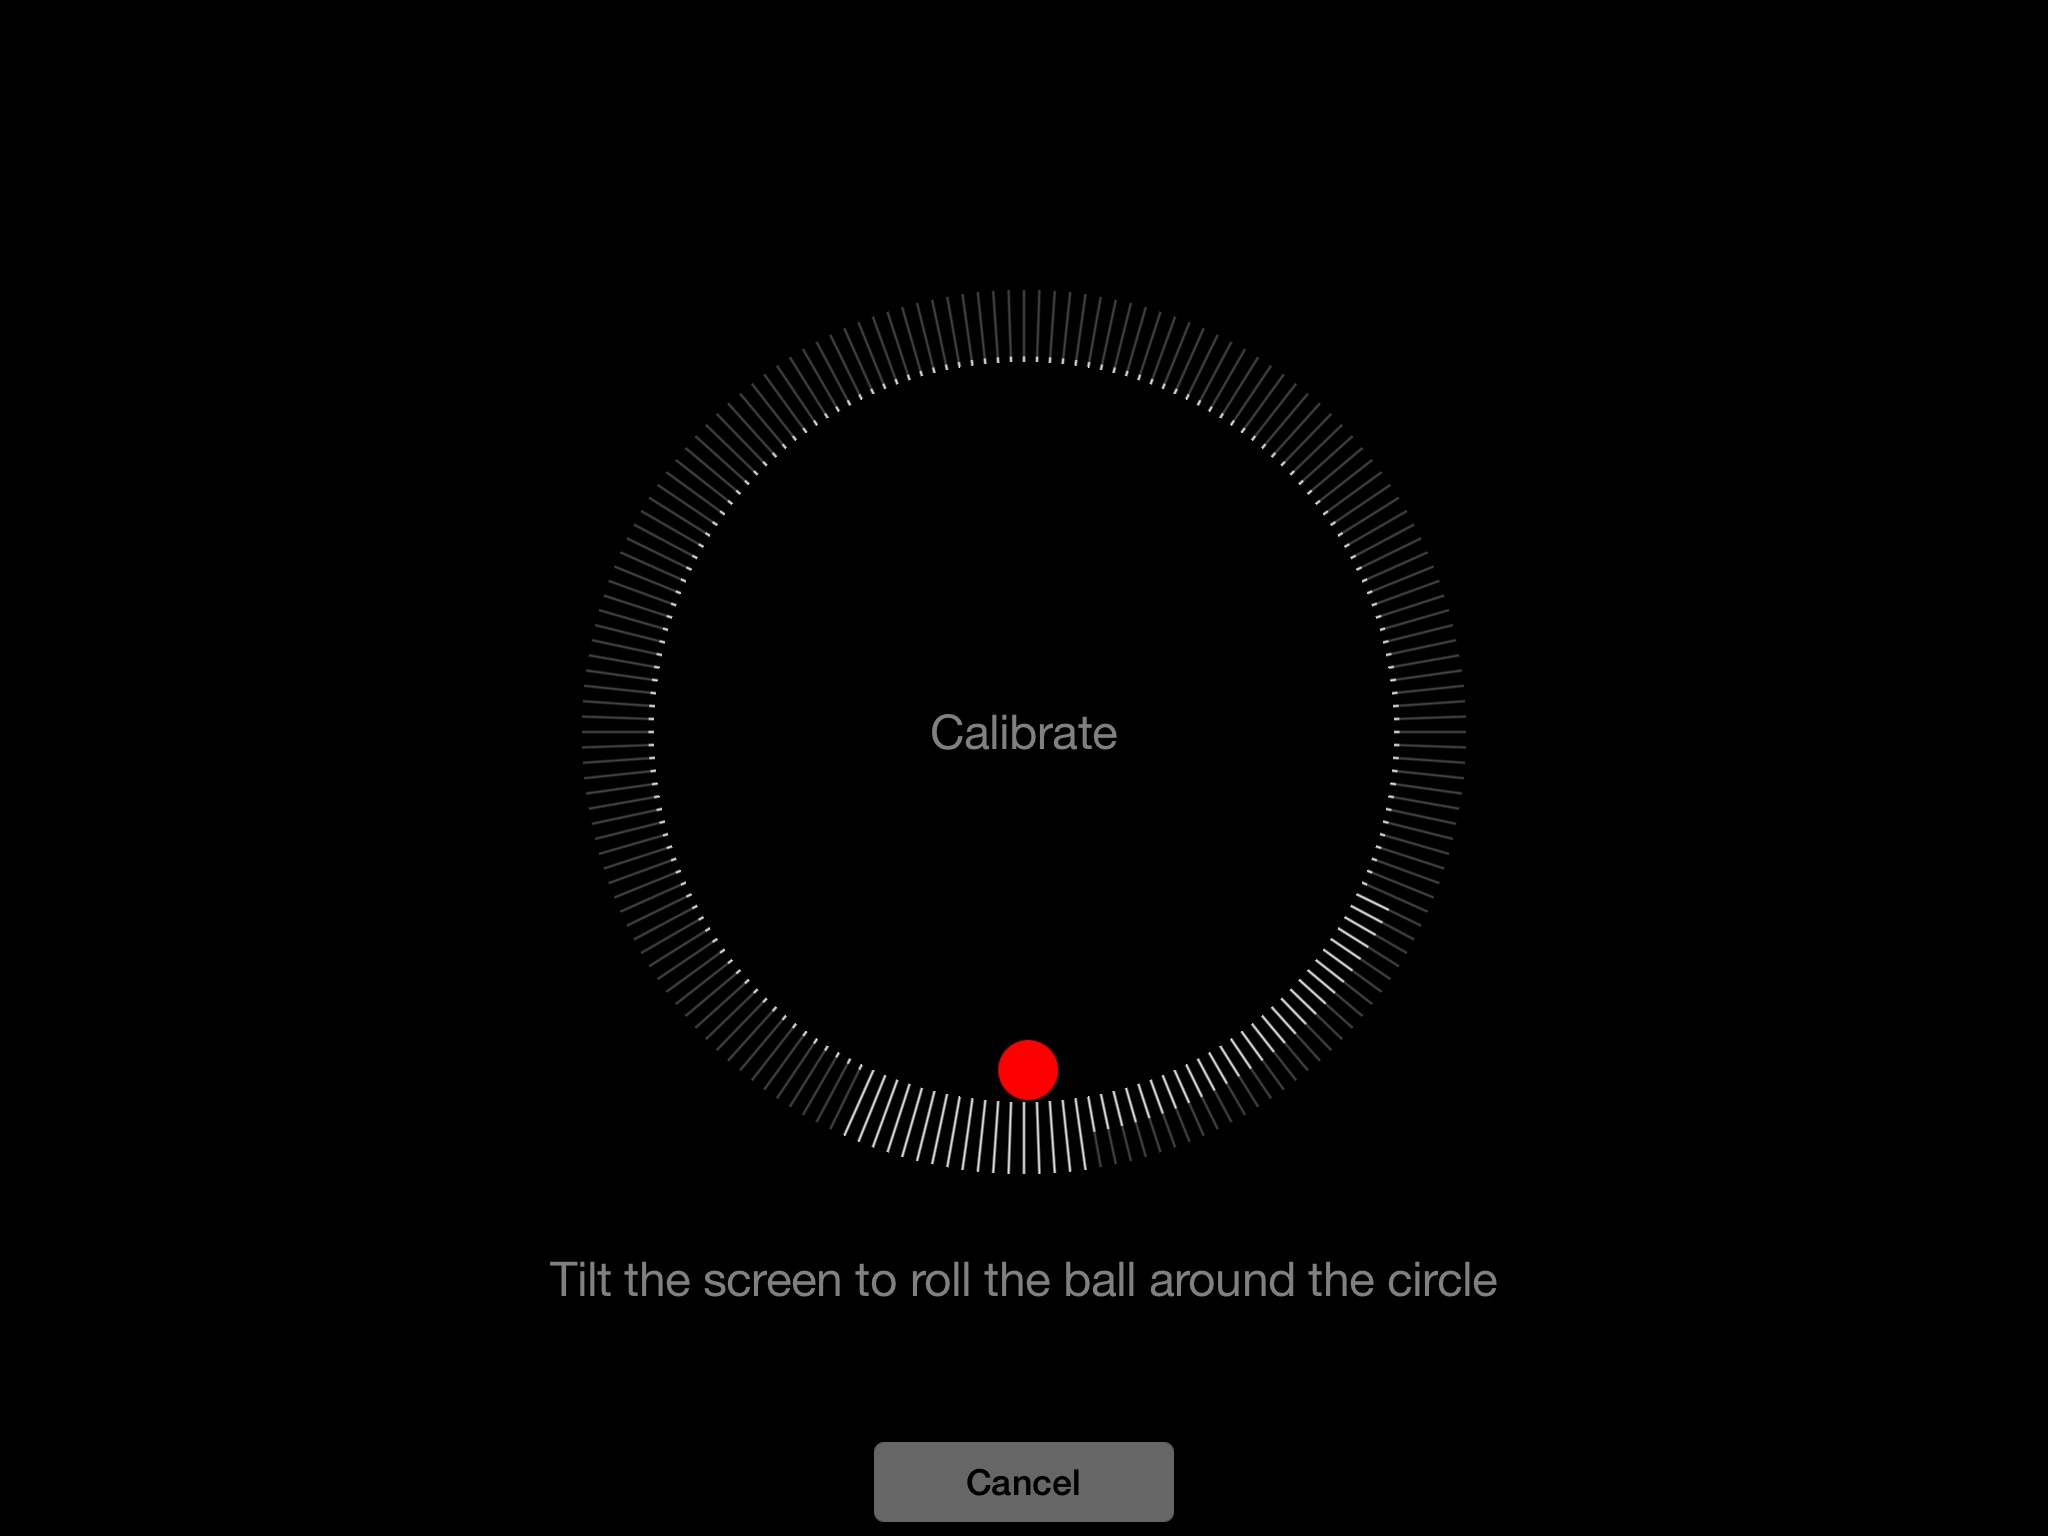
When the calibration screen appears after you open the Compass app, you’ll need to perform a few easy steps to calibrate the compass. Follow the on screen instructions and tilt your phone until the ball moves all the way around the circle. If you are using an earlier iOS, you will be prompted to move your phone in a figure 8 motion.
Calibrate device (iOS)
Once this process has been completed, the default compass screen will appear – your compass is calibrated and ready to be used! If the default compass screen appears as soon as the app is opened, your compass is already calibrated. If you see a different page appear on screen, the Compass app also doubles as a leveler; swipe left you will return to the compass screen.
MAPublisher LabelPro intelligently labels your map layers using custom rules and styles. One of the popular uses of this feature is to create highway shields. The result is a cleaner map and is widely used on road maps around the world. While MAPublisher has many default options for highway shields, it is possible to create custom shields to improve your map as well. This blog will outline the steps to create and customize highway shields for your map.
Step One
Import your data into MAPublisher, ensuring your road line data has an attribute field for highway route numbers. Highway shields can work with any data type, however, traditional highway shields are created with a highway number with no additional characters. Using the integer data type enforces this and is recommended for highway shields.
Step Two
On the MAPublisher toolbar, in the Labels subsection, click the MAP LabelPro button.
Step Three
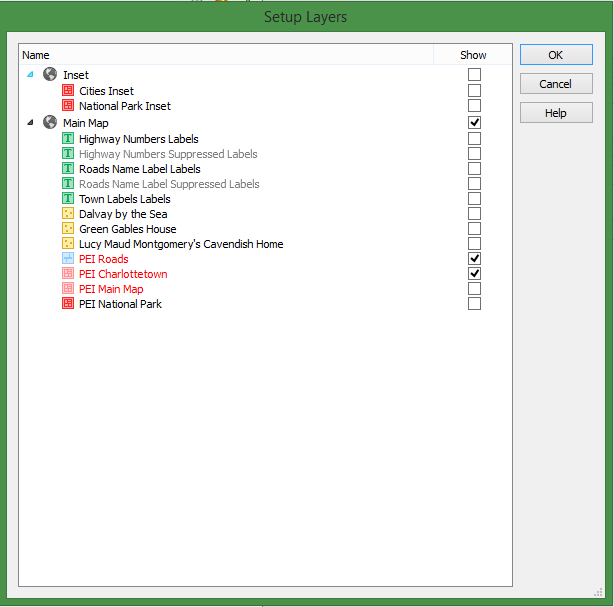
On the MAP LabelPro dialog box, click the Setup Layers button. This allows you to select which layers are going to be labeled or used as obstacles. This means you can label multiple features at the same time as the highway shields. Click the checkbox next to your roads layer and click OK.
Step Four
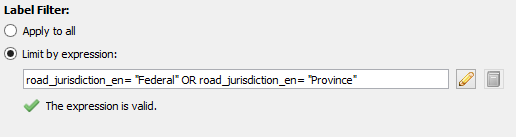
Optionally, you may want to only create highway shields on some of the roads within your road layer. For example, if your roads layer also contains roads that are not highways, you don’t want them labelled with a highway shield. The solution is to create a Label Filter. To do this, first create a new filter by clicking Add label filter button at the bottom of the dialog box. Next, in the Label Filter section, select Limit by expression and click the Edit icon. This opens the Expression Builder dialog box. In this example, the expression entered selects only roads that have a jurisdiction designated as “Federal” or “Province”. Only these roads will be labelled with a highway shield.
Step Five
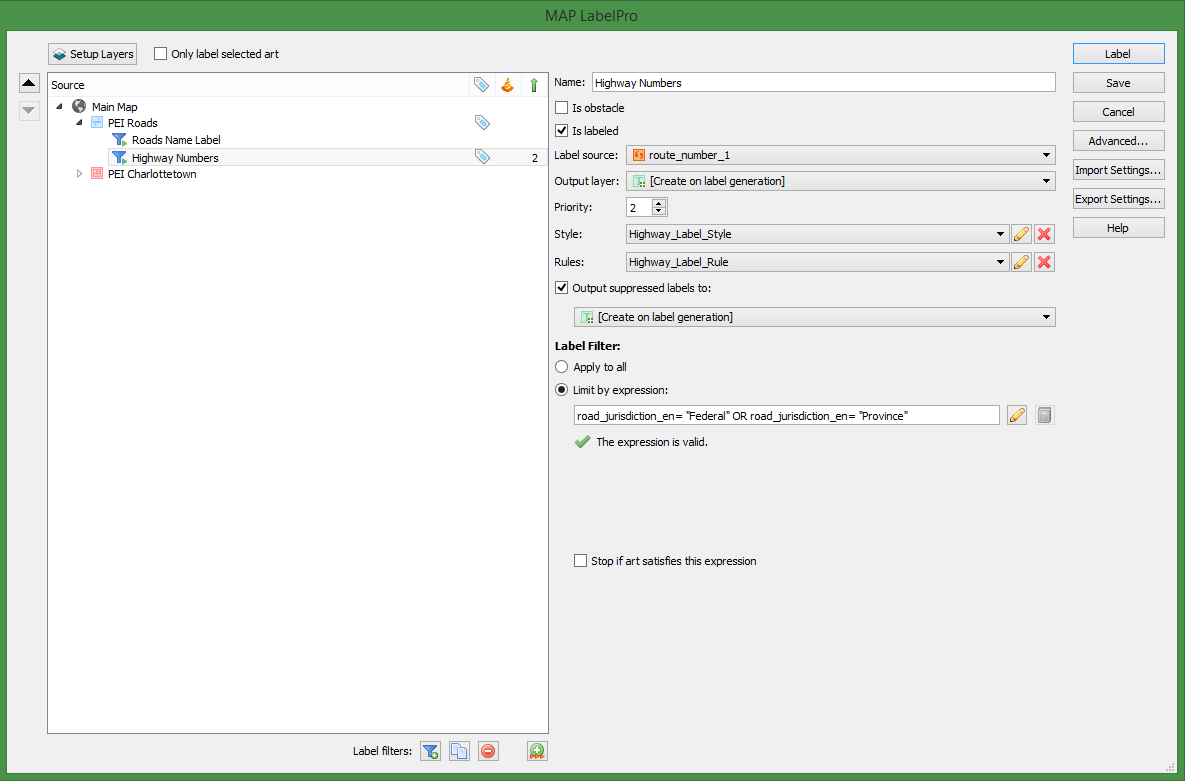
If you didn’t create a label filter, click the layer in the Source list you would like to label. On the right side, ensure that the “Is labeled” checkbox is checked. Immediately below, in the Label Source drop-down, select the field that contains the highway route numbers.
Step Six
Select or create a rule from the Rules drop-down. The pre-defined Highways and Interstate rules that are included with MAPublisher follow conventional mapping patterns, but if you want to customize the setup of your shields, click the Edit button. Once you are satisfied with your rules, click OK to return to the MAP LabelPro dialog box.
Step Seven
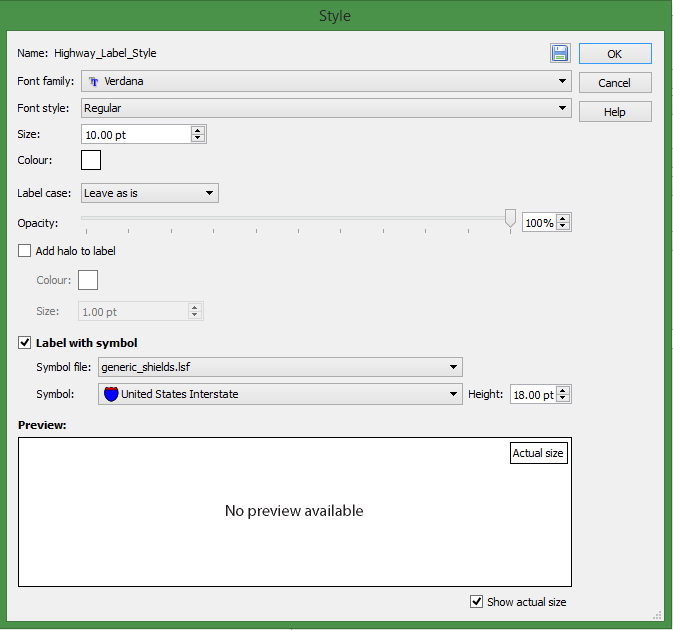
To customize the appearance of the shields, click the Edit button beside the Style drop-down. To add highway shields, click the Label with symbol check box to enable its settings. The Symbol file is the shield library, where you can pick between Canadian, US State and generic shields. The Symbol drop-down is where you can pick the shield from the shield library specified. All shields will have the same symbol, if you want multiple shield shapes on your map, you’ll have to create label filters as outlined previously in step four. The Font family, Font Style, Size, Colour and Label case affect the appearance of the text within the shield. Click OK when finished setting the style.
Step Eight
Back in the MAP LabelPro main dialog box, click the “Output suppressed labels to” check box. This moves all excess labels such as duplicate shields or shields that clash with other features on your map to a Suppressed layer. You can view features on the Suppressed layer after to see which labels were not included and you can decide to keep or delete them.
Step Nine
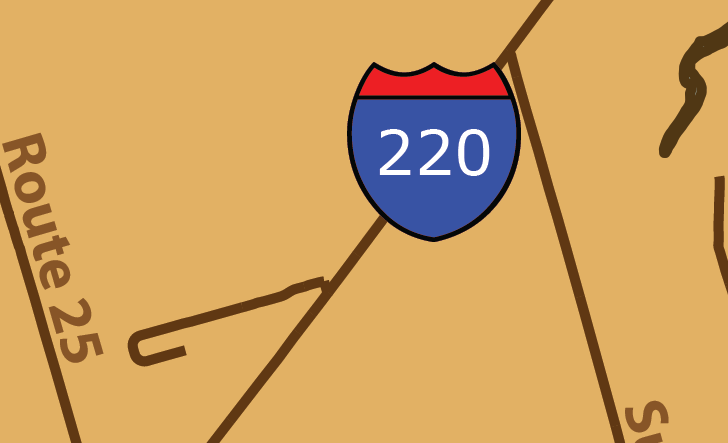
Click Label to begin the labeling process.
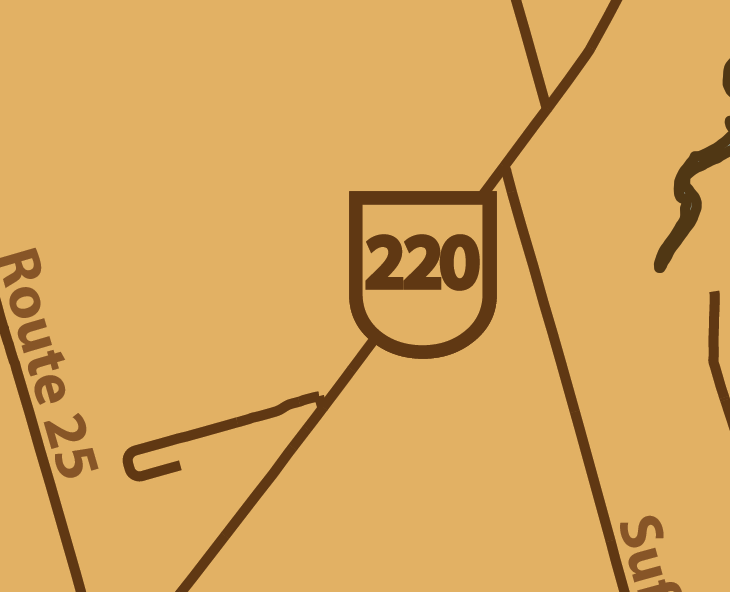
Step Ten
When all of your shields are generated, you can do some additional customization. In the Illustrator Layers panel, select all of your shields. From here, any changes to the colour, stroke colour and other settings you would use on objects, will be applied to your shields. With this functionality, you can create the exact shields you want for your map.
Using a Web Map Service (WMS) is a great way to easily get up-to-date imagery for your project. An issue you may run into, however, is that a server may not allow you to download images over a certain size (in pixels). The image resolution provided on most servers is usually high enough for most projects but there may be some instances where a higher resolution is needed (e.g. a poster-sized map or a web map that covers a large area).
One possible workaround for this issue is to get several small-area, high-resolution images from a WMS and then mosaic them together to make one large-area, high-resolution image. Here, we will use the City of Toronto Web Map Service to:
Get an image of downtown Toronto
Tile the image to split it into four smaller images
Use the extents of the four tiled images to get four high-resolution images
Mosaic the images to one large high-resolution image
Download an Image from the Web Map Service
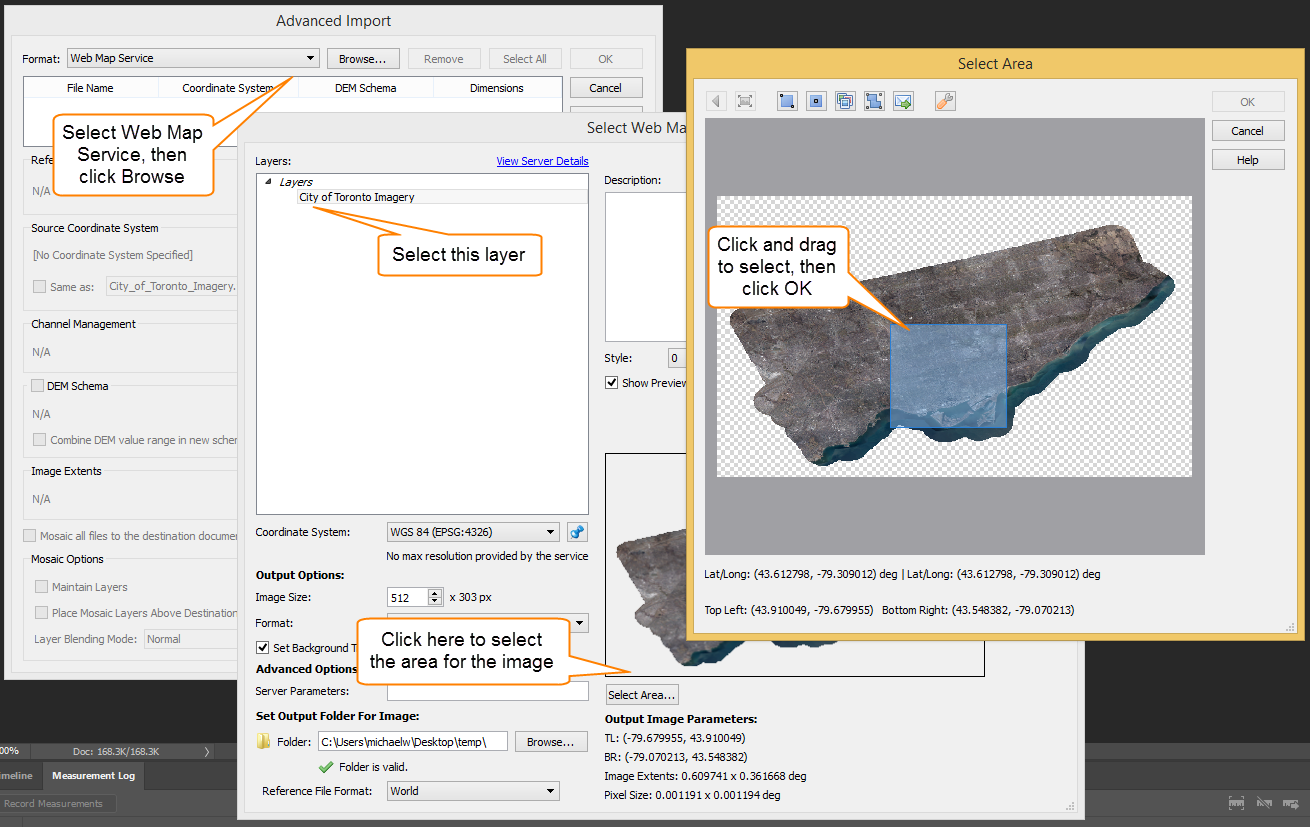
First we will get an image of downtown Toronto from the City of Toronto WMS. Click the Advanced Import button on the Geographic Imager panel. Select Web Map Service from the Format drop-down and click Browse. Click Load services from Avenza and select City of Toronto WMS from the list.
Download an Image from the Web Map Service (Click for larger version)
Select City of Toronto Imagery from the list of layers. Click Select Area then drag a box to zoom in on an area of downtown. Click OK to return to the previous window. There is no need to change the image size because we will use this image to get the extents of a higher resolution image. Leave the other options as default and click OK to load the image, and click OK again on the Advanced Import dialog box. The selected image will now open in Adobe Photoshop.
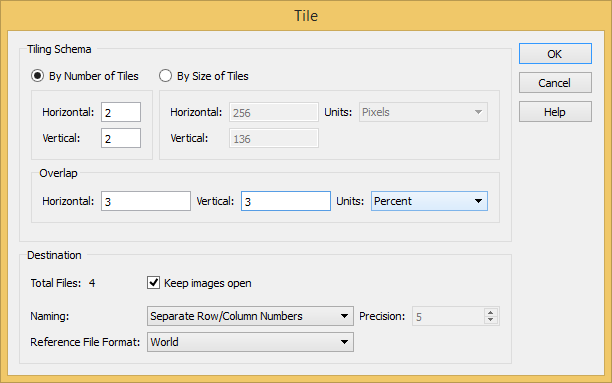
Tile the Image
Next, let’s tile the image to split it into four separate images. Open the Tile dialog box from the Geographic Imager panel. Choose By Number of Tiles as the Tiling Schema and change Horizontal and Vertical to 2. Change the Horizontal and Vertical Overlap to 3 percent. It’s important to have overlap between the images so they will mosaic properly when the data is transformed.
Tile the Image (Click for larger version)
Click the Keep Images Open check box to enable it. Choose a name and location to save the tiles. You can save them to a temporary location because they will not be part of the final product. The four image tiles will open in separate tabs.
Estimate a Web Map Service’s Maximum Image Size
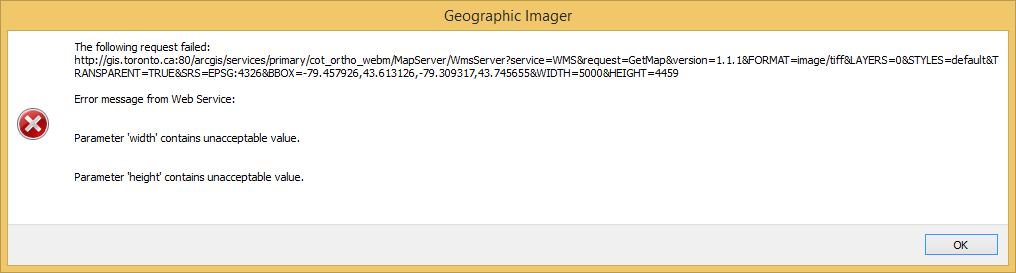
Open the City of Toronto Imagery WMS again and select an area. In this service, as with many other services, the maximum resolution is not provided. We can, however, use trial and error to find the largest image that the service will allow us to download. A WMS has a maximum allowed width and height set for an image request. The maximum width is usually the same as the maximum height.
Set the resolution of the image by adjusting the width of the image in pixels under Output Options. First, try setting Image Size to a pixel width of 5000. Height will update automatically based on the image’s dimensions. Click OK and you will see an error that says “Parameter ‘width’ contains unacceptable value” (or height if the images higher than it is wide). OK the error to close it.
Estimate a Web Map Service’s Maximum Image Size (Click for larger version)
To estimate the maximum width and height allowed by a web service, you can adjust the image size to see when the server returns an error. The maximum width and height for the City of Toronto WMS is about 4000 pixels.
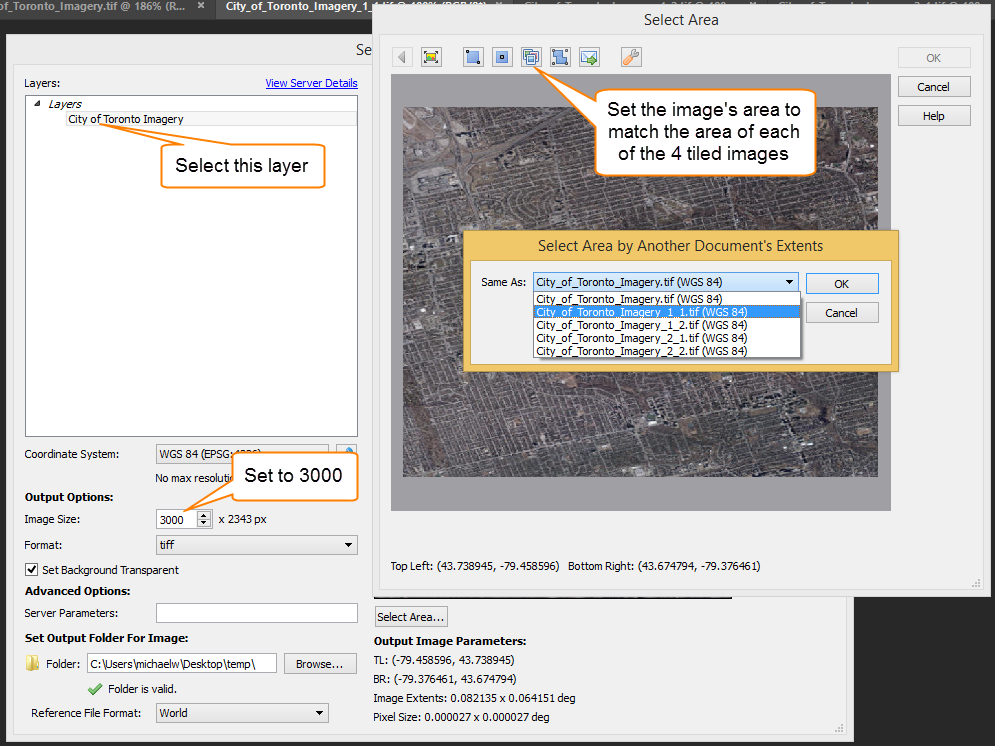
Downloading and Mosaicking Large Images
Next we will use the geographic extents of the four tiled images to download four higher resolution images with matching extents then mosaic the images together. Import an image again from the City of Toronto WMS using Advanced Import. Select an area, click Select Area by Another Document’s Extents and choose the first tiled image from the dropdown menu. The Select Area dialog will display an area matching that image’s area. Click OK to return to the previous screen.
Downloading large images (Click for larger version)
Enter 3000 as the Image Size. Click OK to add the image to the Advanced Import dialog box. Repeat the above steps for each of the remaining three tiled images.
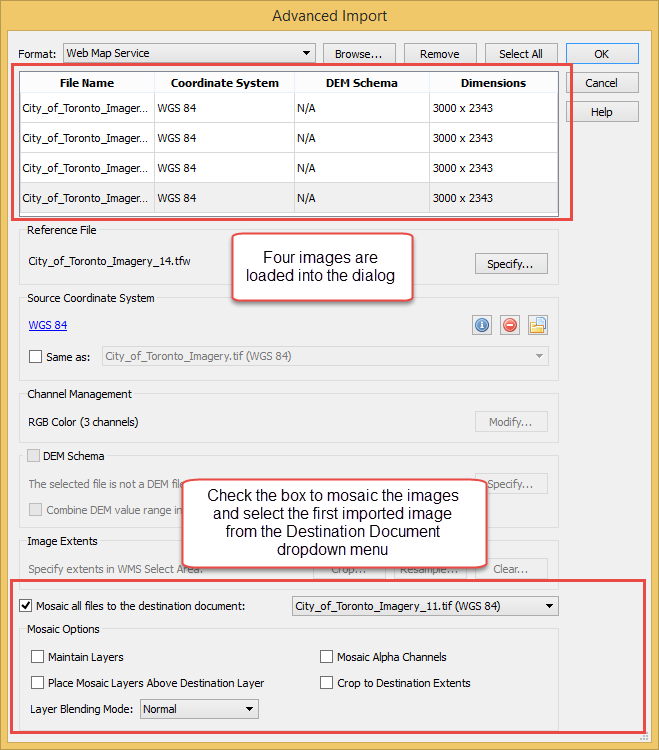
Creating a mosaic of four images (two by two) makes a single image just under 6000 pixels wide because of the overlap between the tiles (the height will vary depending on the area you selected). This is larger than the maximum size allowed by the WMS. Check the box Mosaic All Files to the Destination Document and select one of the images currently loaded in the dialog window from the drop-down menu. Leave the other options unchecked and select Normal as the Layer Blending Mode. This will merge the four images into a single document.
Mosaicking large images (Click for larger version)
Avoid Downloading Images Greater than the Maximum Image Resolution
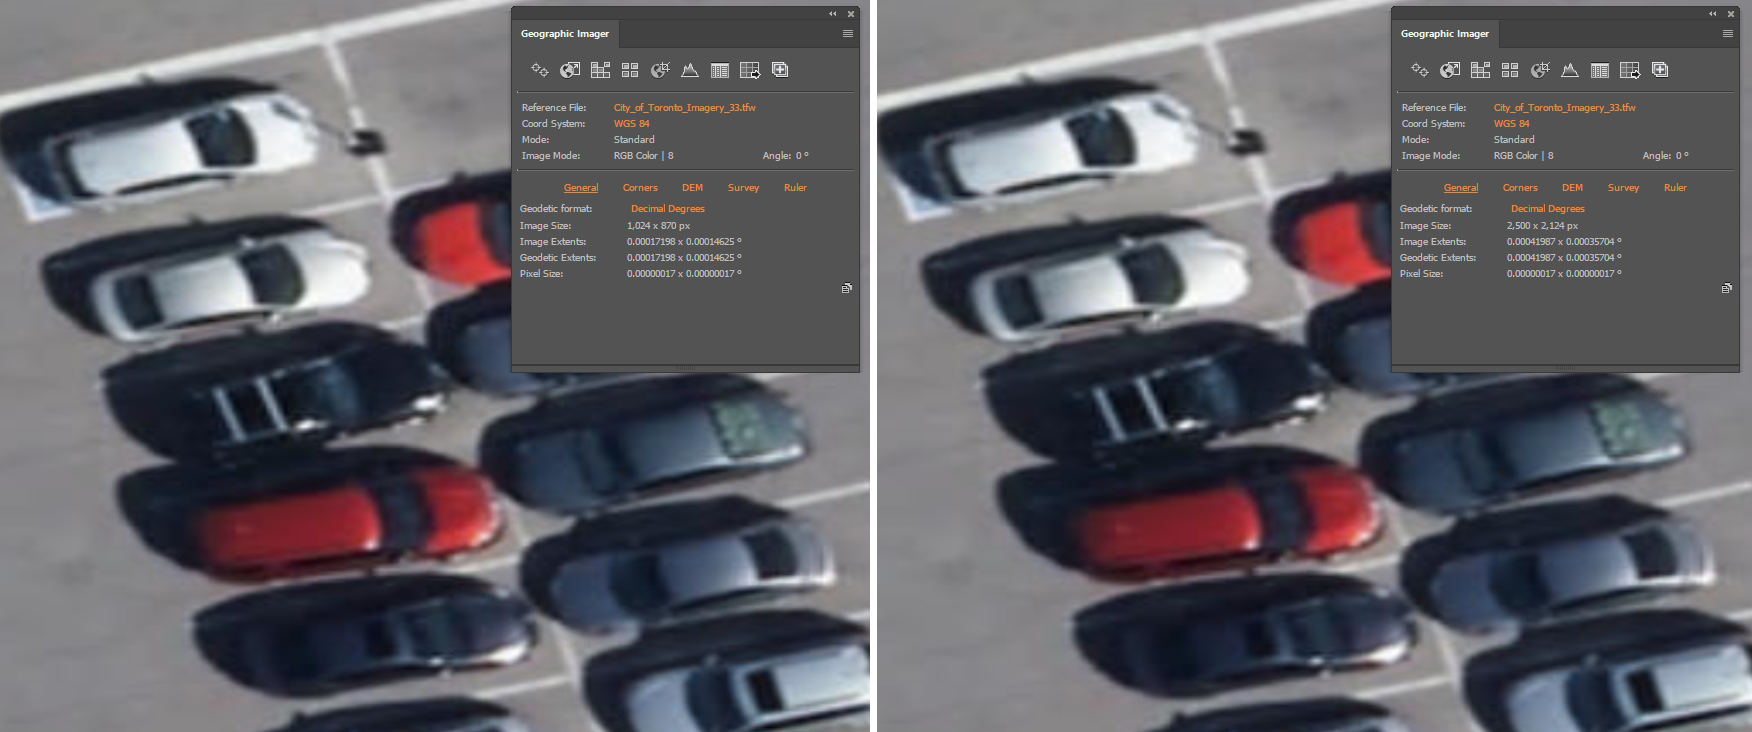
One further consideration when getting imagery from a service is to avoid requesting an image that is higher resolution than the full resolution of the image on the service. In this case, the number of pixels in the image and, therefore, the image size will increase without any increase in the actual resolution of the image.
To see an example of this, get an image from a WMS by zooming in on a small area and downloading images of varying resolution. The pictures below show two images of the same area side by side at different resolutions. The image on the left is 1024 by 870 pixels and the one on the right is 2500 by 2124 pixels but there is no noticeable difference between them. This is because the image exceeds the resolution of the image on the server so the WMS resamples the image to a higher resolution, creating duplicate pixels.
Avoid Downloading Images Greater than the Maximum Image Resolution (Click for larger version)
With the latest release of Geographic Imager 5.2, it’s now possible to easily import images directly from an ArcGIS Online account or an ArcGIS web service. This will allow you to use shared data within your ArcGIS Online organizational account and connect to publicly available map servers from various online sources.
ArcGIS Online is a collaborative web GIS that allows you to store and share GIS data using Esri’s secure cloud. Before, you may have had to download raster layers to your local machine and then import them into Adobe Photoshop using Geographic Imager. Now, Geographic Imager has a much-improved workflow to get ArcGIS Online image layers into Adobe Photoshop with full georeferencing.
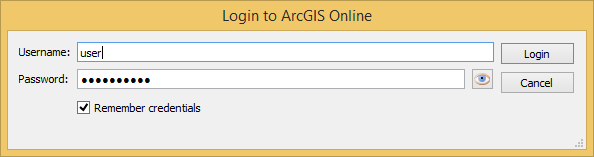
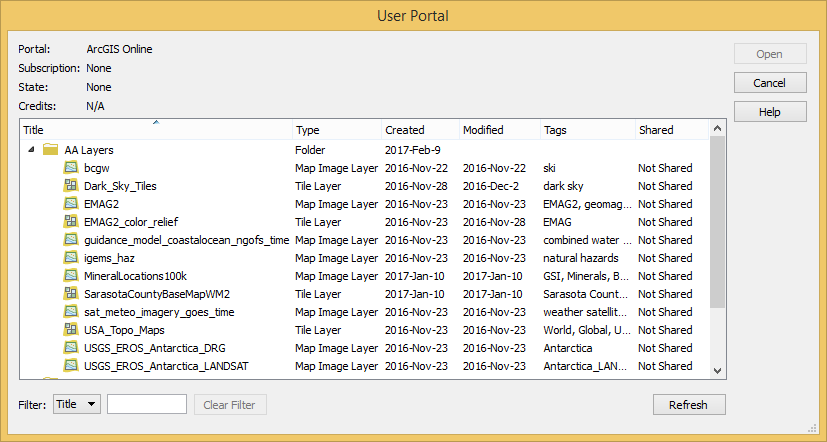
Currently, the types of datasets allowed are Map Image Layers and Tile Layers. To load a layer, open Advanced Import and select ArcGIS Online from the Format drop-down list. Enter the credentials for your ArcGIS Online account and select an image layer from your user portal.
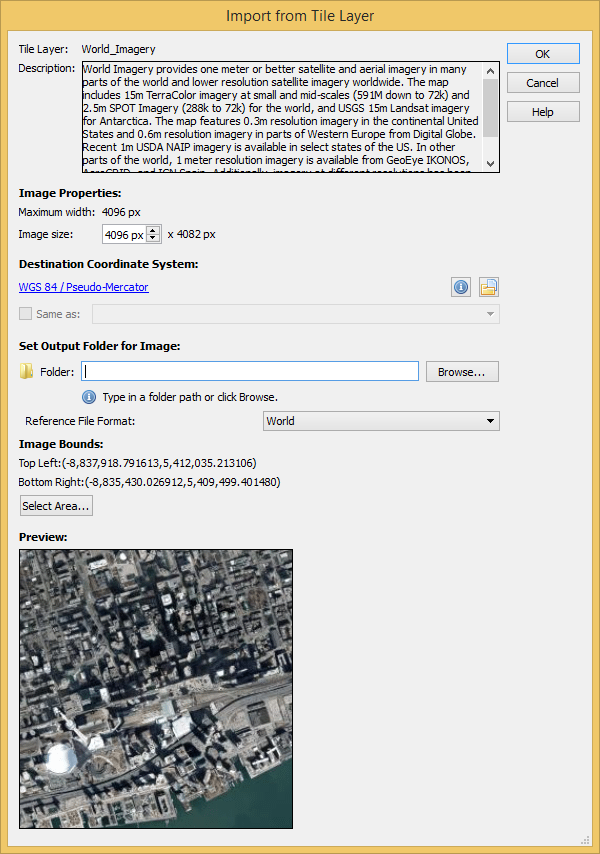
Images can be resized and transformed on import. To extract a specific area from the image, click Select Area. The interface is the same as the one used for WMS Import.
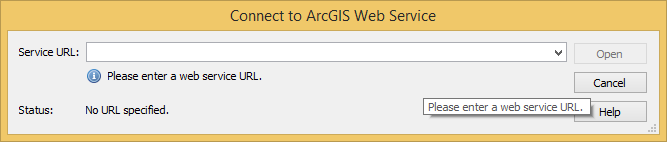
In addition to using your own organization’s data, you can connect to publicly available data from a wide variety of organizations by connecting to an ArcGIS Web Service. To connect to a web service, use Advanced Import and select ArcGIS Web Service from the Format drop-down menu. Click Browse and enter the URL for the service. This is a great option when searching for data from open data portals created by government agencies.
Avenza Maps is capable of importing and displaying georeferenced maps in several different formats. The app processes a map by rasterizing and tiling it on import. The speed and result of processing will vary depending on the type of file used and the size and dimensions. We’ll discuss the types of files allowed and the advantages of each.
Usually larger files take longer to process than smaller ones with some exceptions. An image may have a very high resolution but a small disk size due to image compression. It is recommended that images be less than 100 megapixels for upload to the app. A geospatial PDF file with many vector features may also take a long time to process. In this case, you should convert the file to an image to avoid having to rasterize vector data in the app.
Maps can be loaded into the app faster by processing them before import. Maps can also be preprocessed by uploading them to the Avenza Maps Store or using the Export to Avenza Maps tool in Geographic Imager or MAPublisher.
Comparison of Allowed File Types
GeoTIFF
A GeoTIFF is a TIFF file (Tagged Image File Format) with spatial information embedded in the file. This format is typically the preferred format for uploading directly to Avenza Maps without preprocessing. Since this is an image format, the app doesn’t need to rasterize the file on import meaning processing times will generally be faster compared to PDF’s, and it will maintain the native resolution.
It is also possible to import a normal TIFF file by zipping it with a TIFF World File (TFW) and either a WKT or PRJ file which contains projection information. It is best not to do this for the sake of simplicity. Usually, any GIS software that can produce a world file will also be able to save to GeoTIFF.
Geospatial PDF
A Geospatial PDF stores spatial data in either raster or vector format as well as associated attributes and layer information. Files should comply with the Adobe Acrobat PDF 1.7 specification which has been standard since 2006.
Avenza Maps rasterizes geospatial PDF files on import which discards layer and attribute information. PDF files typically take longer to process than image files. There is also a chance that the file may process incorrectly (e.g. discarding labels).
Despite this, there are some instances when it may be preferable to use a geospatial PDF file. For example, the map may already be in this format and isn’t worthwhile to convert to another format. Geospatial PDF files tend to be smaller than image files so they would be a good solution if device storage space or download speed is an issue. Also, occasionally converting from PDF to TIFF degrades the image quality and may make maps illegible.
To ensure a geospatial PDF file has a good balance between size and quality, open the file in Adobe Acrobat and go to Advanced > PDF Optimizer. This is especially helpful if the map contains large raster images.
JPEG
JPEG is an image format like TIFF but it does not have the ability to store spatial information. To load a JPEG into Avenza Maps, it must be zipped with a JPEG World File (JGW) and either WKT or PRJ file. JPEG files are compressed so this may be an option to consider if file size is a consideration, however, a better alternative would be to compress a GeoTIFF file.
Processing Maps with MAPublisher, Geographic Imager, and the Map Store
It is best to process maps before loading them into the app because desktop computers are more powerful than mobile devices. It also avoids having to process the file each time the map is loaded onto a device. Geographic Imager and MAPublisher each have a utility to export to an Avenza Maps package with the capability to upload directly to the Avenza Map Store if you have a vendor account.
Running these utilities produces a folder that contains a ZIP file with a thumbnail to show a preview of the map, a reference file, and a folder called tiles that contains a tiled version of the map in PNG format. This ZIP file can be imported into the app in the same way as other files.
In the latest GeoJSON specification (2016), the coordinate reference system for all coordinates is a geographic coordinate reference system—using the World Geodetic System 1984 (WGS 84) datum—with longitude and latitude units of decimal degrees. The previous specification (2008) allowed for the use of alternative coordinates systems, but this was removed because of interoperability issues.
MAPublisher still recognizes GeoJSON files with a specified coordinate system even though it is no longer officially supported. However, if no coordinate system is specified, MAPublisher will assume the coordinates are in WGS 84. Occasionally, this may cause a problem of improperly formatted files that contain projected coordinates but have no specified coordinate system. In this case, users will need to either choose a coordinate system during import or modify the GeoJSON file by adding a coordinate reference system (CRS) object manually.
Selecting a Coordinate System on Import
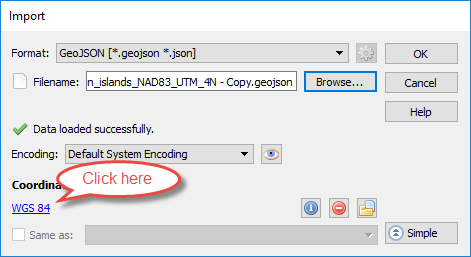
To change the coordinate system using the Import dialog box, click Advanced and select the WGS 84 link under Coordinate System. Ignore the warning about changing the coordinate system by clicking “Replace coordinate system”. Select the correct projected coordinate system from the list.
Modifying the GeoJSON File Manually
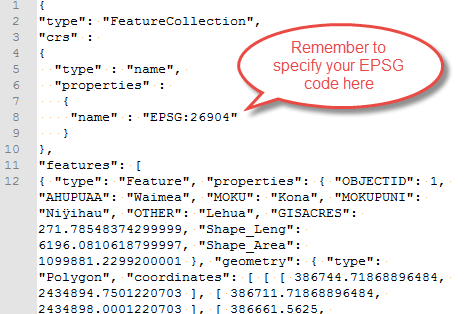
Coordinate reference systems can be specified in a GeoJSON file using a CRS object. You can view the contents of any GeoJSON file by opening it in a text editor such as Notepad. Copy and paste the text below after the line: “type”: “FeatureCollection”, (usually on line 2). Change the EPSG number to the correct CRS for your dataset. See Spatialreference.org to lookup an EPSG code.