For the majority of Avenza Maps users, layers are indispensable. Not only are layers a repository where placemarks, tracks, and photos are stored, but they also enable you to both manage and share map feature data.
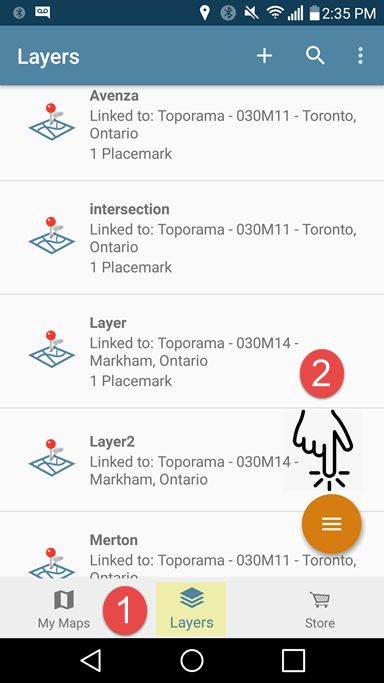
With the release of Avenza Maps 3.5, Android users will be introduced to a feature that was previously only available on the iOS platform, the Layers tab. The Layers tab is an invaluable resource which provides a complete listing of all layers in the app database, including their existing map associations. But what is most exciting about the Layers tab is it’s new ability to export layers. Exporting layers from the Layers tab will streamline data archiving. From the Layers tab, you now have the ability to export an individual layer, multiple, or all existing layers in one fell swoop.
Let’s see just how easy it is now to archive your map feature data.
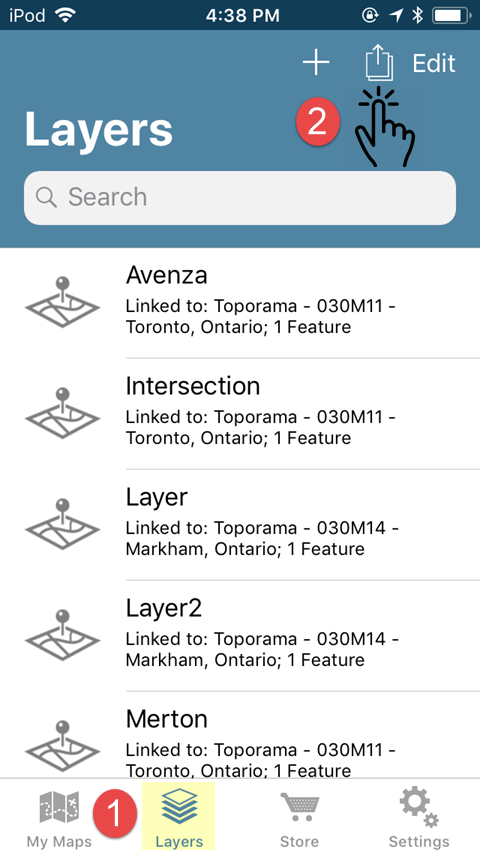
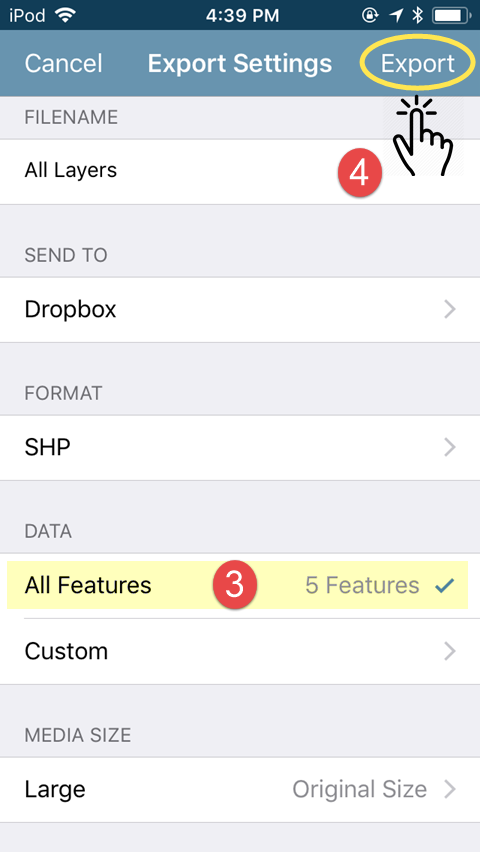
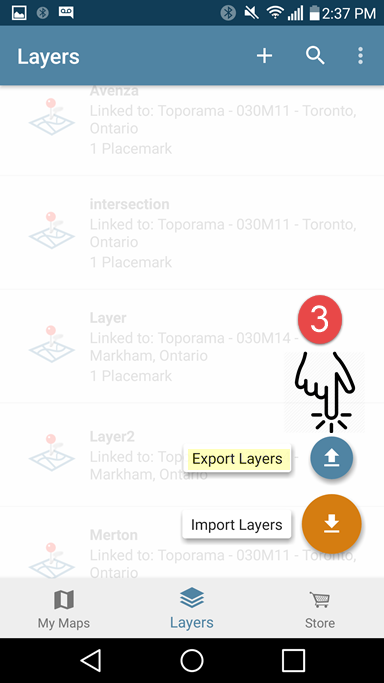
Say we had two topographic maps. One map contains two layers while the other has three separate layers. Below is an example of how all five layers can be exported from the Layers tab at once.
iOS
Android
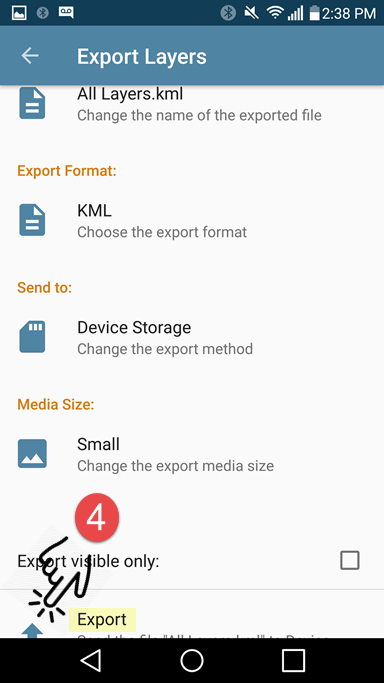
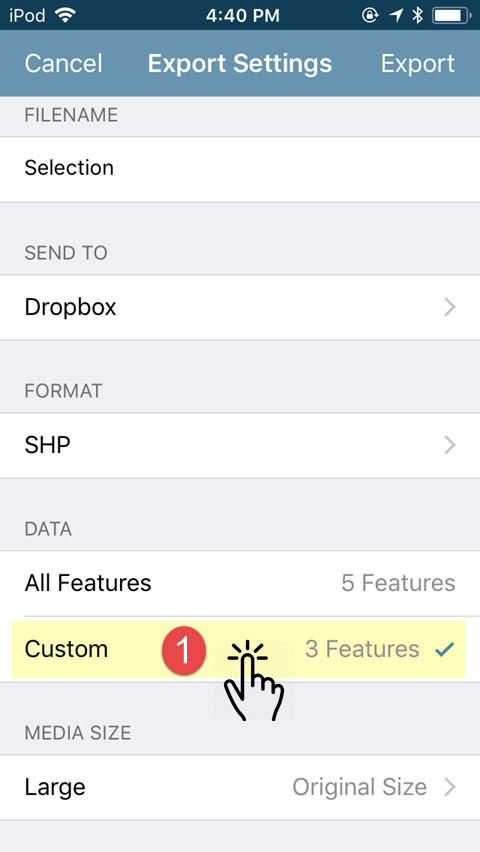
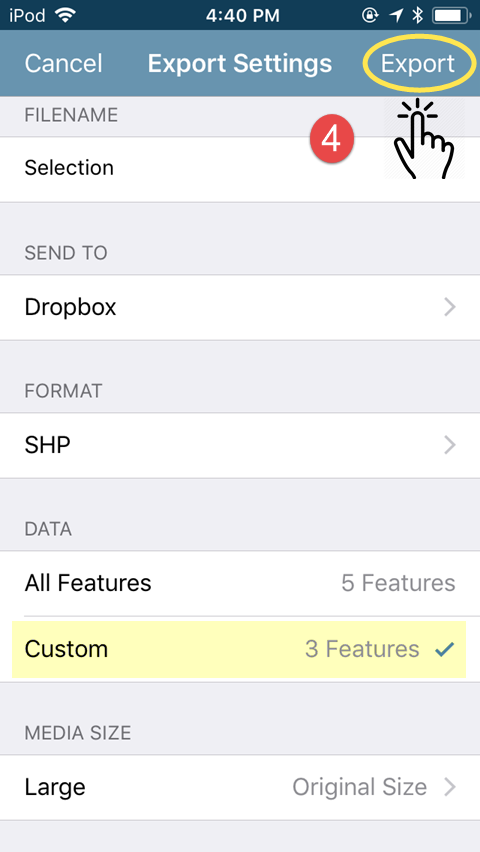
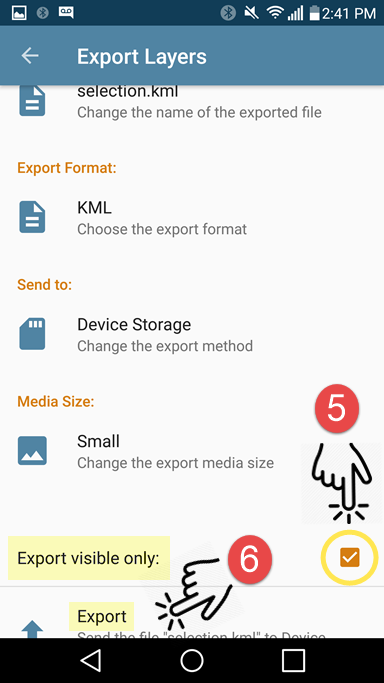
If you plan on importing your exported data back into the app, it is important that you export to either the KML or Shapefile (requires a Pro subscription) formats. Once you have tapped on Export, navigate to the storage location and tap Upload (iOS) or tap the check-mark icon (Android) to export. All of your layers will be exported to a single file for archiving. If you wish to restore these layers at a later date, you can simply import them back into the Layers tab and all layers will appear in the layers tab as they did prior to export.
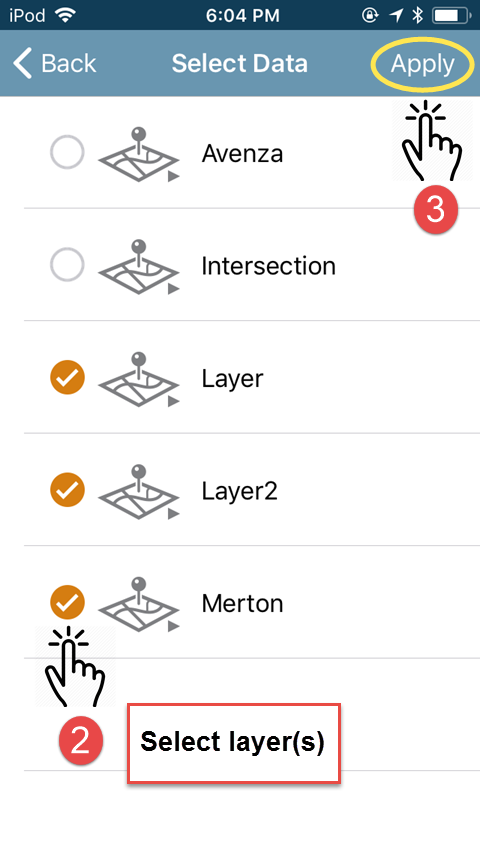
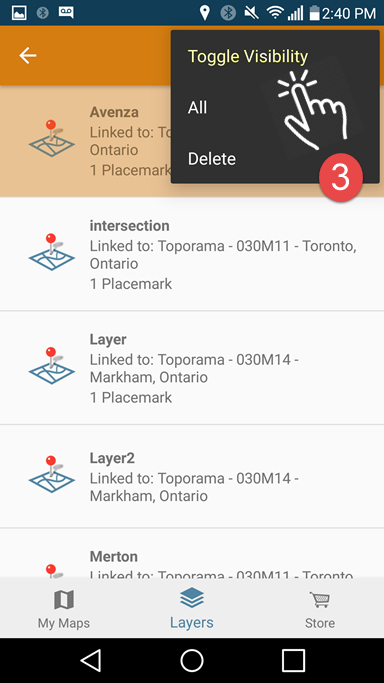
The following example is very similar but this time we are only exporting a selection of layers from the Layers tab.
iOS
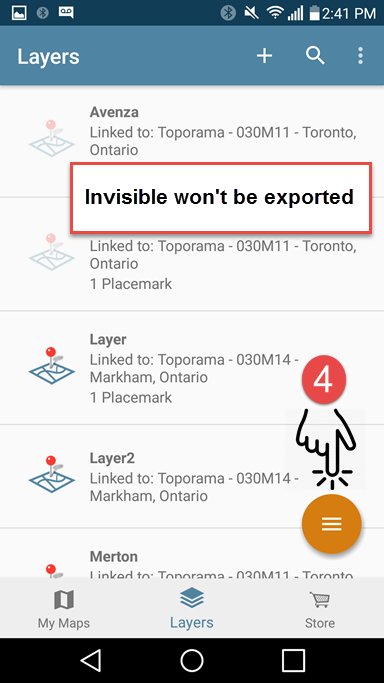
Android
When it comes to exporting map feature data from multiple maps, the Layers tab is now clearly the most efficient method. A word of caution, if you are exporting large amounts of map feature data, it is advised that you break your export up into separate files as opposed to saving all of your layers to a single file. If you are exporting to email, there are restrictions to the size allowed for file attachments. Additionally, when exporting large files, there are resource limitations that may come into play and which vary by device and work environment.
Your data is a valuable resource. Countless hours can be devoted to data collection and the resulting map features are vital to the completion of your work projects. For most, it is extremely important to regularly export data for backup or archiving. Exporting layers from the Layers tab has just made this process that much easier.
Recently we hosted a webinar with our friends at Map the Xperience who shared their thoughts on some of the key elements of cartography and making maps from good to great. Part One of this blog discusses two of the four elements in greater detail: Map quality and connecting with the user.
Good maps are ones that the reader can use to get from A to B with as few unwanted detours as possible. However, a great map can go well beyond the functional while helping users enhance the experience of the map area. It all starts with readability and the ability to meet the needs of map users who may want to use the same map in different ways, for different purposes.
1. Map Quality
Map quality encompasses several different aspects of map publishing including resolution and depth of detail. Accuracy is another element of quality which we will cover in a future Part Two of the blog, but let’s start with resolution. Publishers have always been careful with printing maps at a resolution that supports the size of the printed map, whether the finished map will appear in a book or on a wall. The challenge is that today, maps may be printed in a variety of formats, and used in a variety of ways and therefore have different requirements for resolution. Print on demand services like MapSherpa offers a wide range of printed sizes, and the ability to isolate a portion of a particular map for printing. To make it work, maps must be high enough in resolution to print well in larger formats.
Print sizes are not the only challenge facing map publishers today. Maps printed on alternative media are becoming more popular. Map the Xperience also prints maps on blankets and clothes as keepsake items and recognizes the special requirements for resolution in order to maintain the integrity of the map on different media. Furthermore, digital maps and maps for web applications need to be created in high-resolution to support the ability to zoom in and out to various map scales.
The important message here is that great maps are made at the highest and most appropriate resolution possible to support all of the map formats, print sizes, and media types in which it will be published or displayed.
2. Connecting With the User
Just like with any manufactured product, the more you know about your target audience, the better you can be at producing something that they will love. Maps are no different because if you can anticipate what the end-user wants and needs to know, and incorporate them into the map, users will appreciate and value it. We are big fans of activity-specific maps which tend to be some of the most popular ones in the Avenza Map Store. That’s because maps that are made for a particular activity or intended for a set of activities in mind tend to have the most relevant detail and useful features for the intended map readers. Publishers like MapSynergy understand the importance of connecting with users in this way, producing maps of popular ski resorts that show far more information than the average resort map, including direction of runs, boundaries, and even the location of trees. Creating maps enriched with audience-specific information is much easier today than it used to be with better data sources, imagery, and mapping software that simplifies working with layers of data.
Connecting with users also takes into account the role that maps can play in helping the user to plan a trip, experience everything the area has to offer, and to remember the trip once they have returned home. Many people find maps to be fascinating to look at, but think about how much more interesting it is to look at the map of an area you’ve traveled, remembering the things you saw and did. Map the Xperience makes maps for hunting and fishing and they take great care to include everything from boat put-ins and take outs, land designations, campgrounds and other features useful to hunters and anglers.
Great maps illustrate exactly what the user needs and wants to see. They go well beyond being functional to being scalable to any format, and connecting with the user in such a way as to enhance the user’s experience before, during and after the trip. Stay tuned for Part Two of this blog post where we discuss two more elements of great maps—Accuracy and Presentation.
We’re excited to announce that we’ve completed the release of Avenza Maps 3.5 for iOS and Android. This update contains new features and performance improvements as well as fixes for reported issues. Some highlights are mentioned below, for the full release notes see below.
Plus subscription. We’ve renamed the Unlock Map Imports subscription tier to Plus. The simply named Plus subscription tier will better align with more features that we’ll be introducing in the near future. This subscription still allows you to import as many of your own maps as you want—ideal for map and outdoor enthusiasts who enjoying sourcing and loading their own or third-party maps.
Active and inactive maps. In this release we’re introducing the ability to make imported maps (not including those downloaded from the Map Store) inactive. In previous releases, the standard version (without a paid subscription) allowed you to only import up to three of your own maps into the app and were limited from importing any more. However, now you’ll be able to import as many of your own maps as you’d like. The first three imported maps will be considered ‘active’ and available to use with all of the app’s functionality. Subsequent imported maps will be considered ‘inactive’. Inactive maps can still be opened and viewed, but without GPS location and map tools enabled. You will have the ability to delete active maps that you no longer use and then activate new ones to stay within the three active map limit. Maps downloaded from the Map Store (versus imported from an external source) are always location-enabled and are never limited. To import an unlimited number of your own maps with full location-enabled features and functionality, Plus and Pro subscriptions are available.
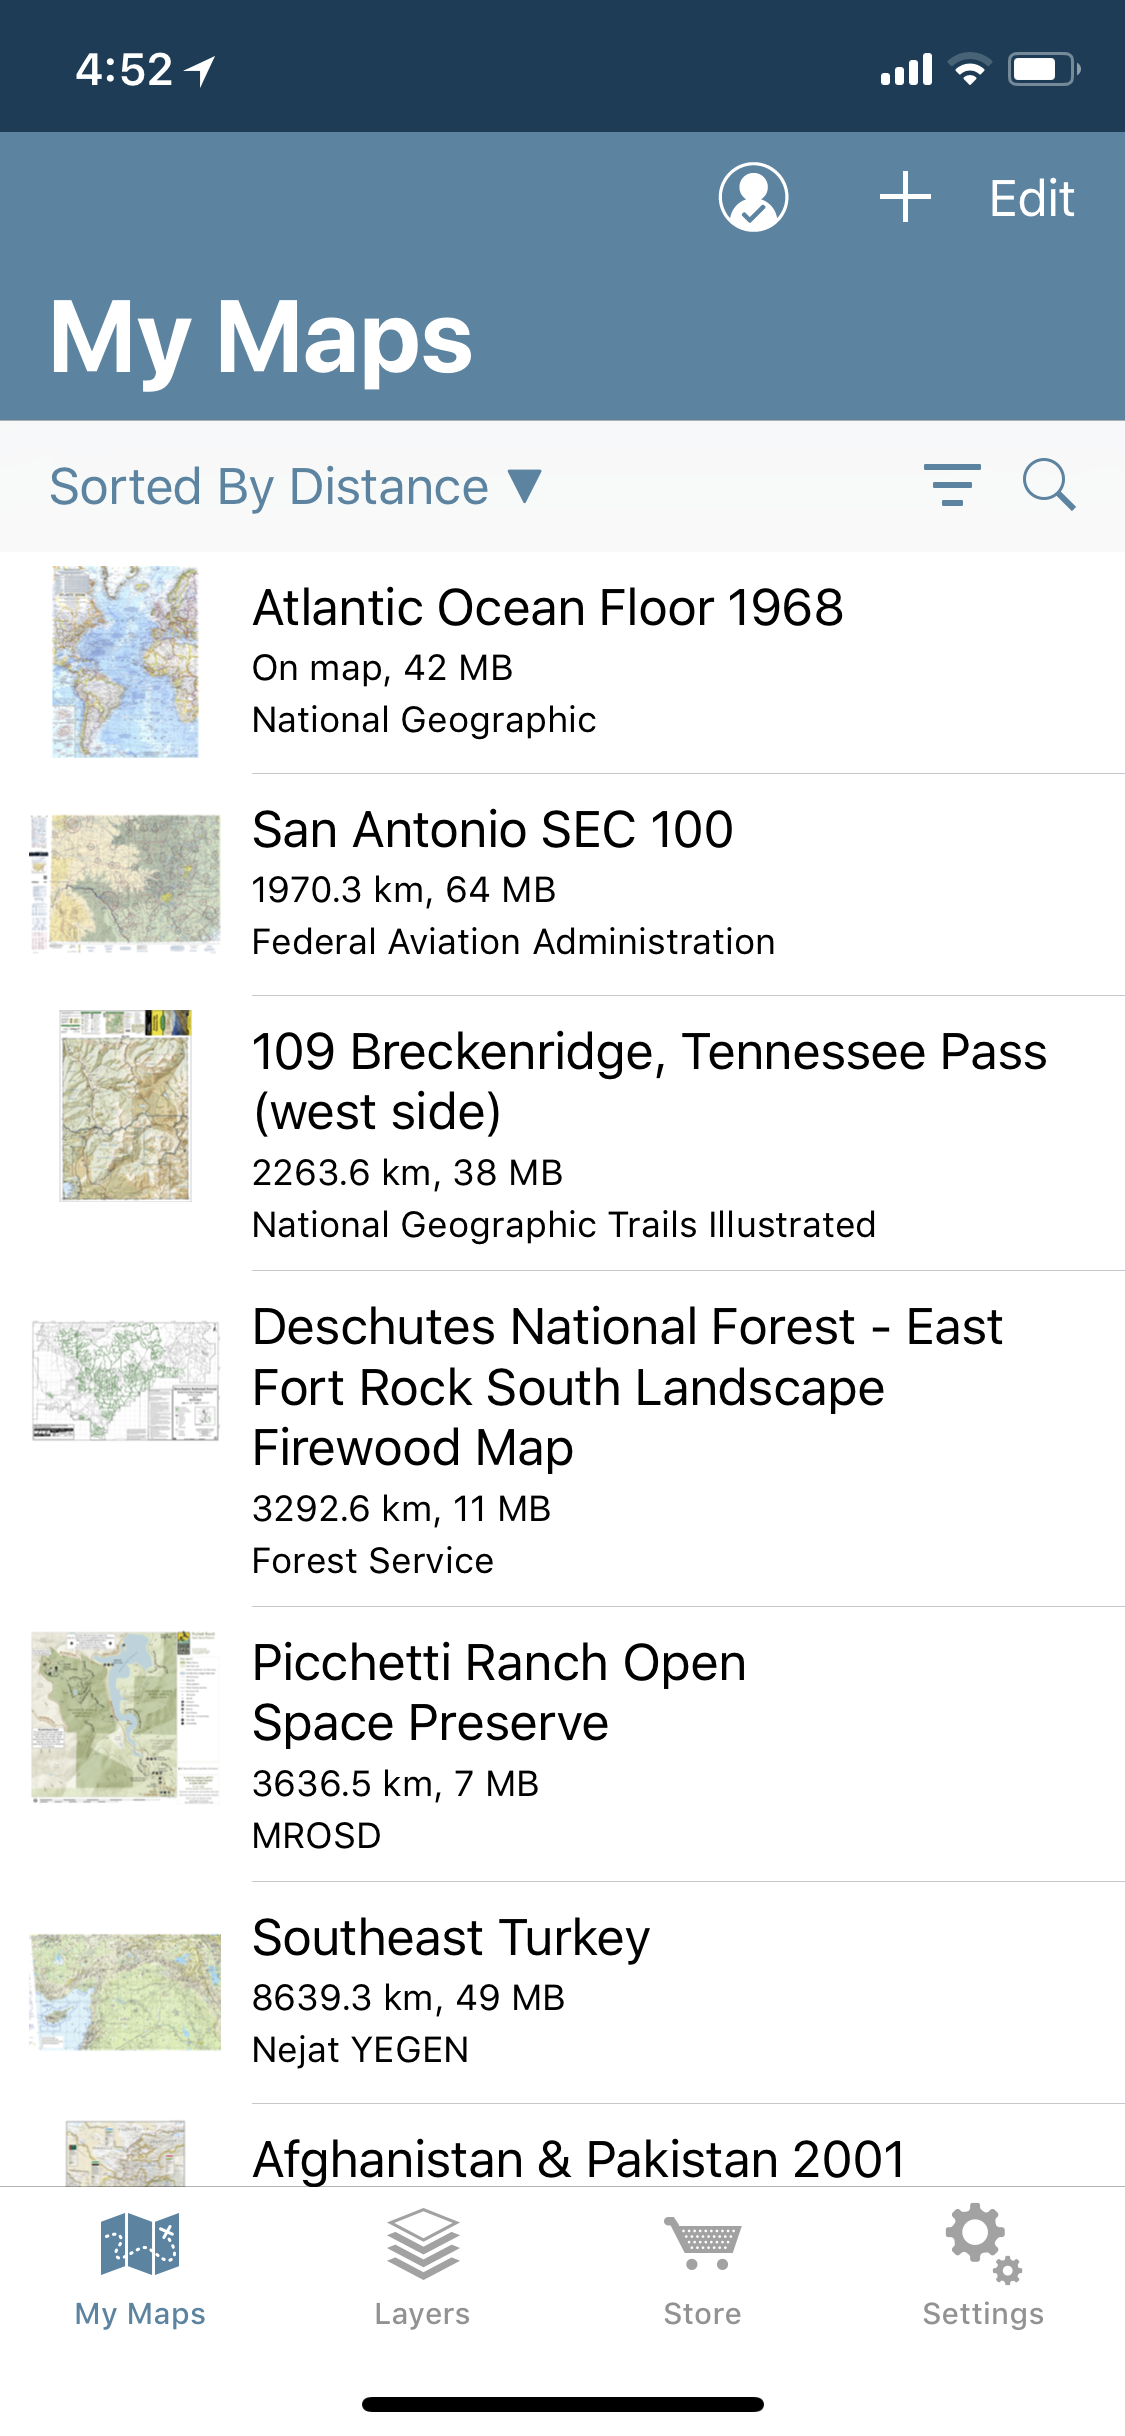
Sort and filter your maps. This release provides some handy sort and filter options on the My Maps screen. You’ll have the ability to sort by distance (how far away a map is from your current location), by name, by date, and by how much storage the map takes (measured in MB). In addition, you’ll now be able to filter maps to show only those from the Map Store, maps that you imported, folders and collections, active or inactive maps, just maps (no folders), or all items.
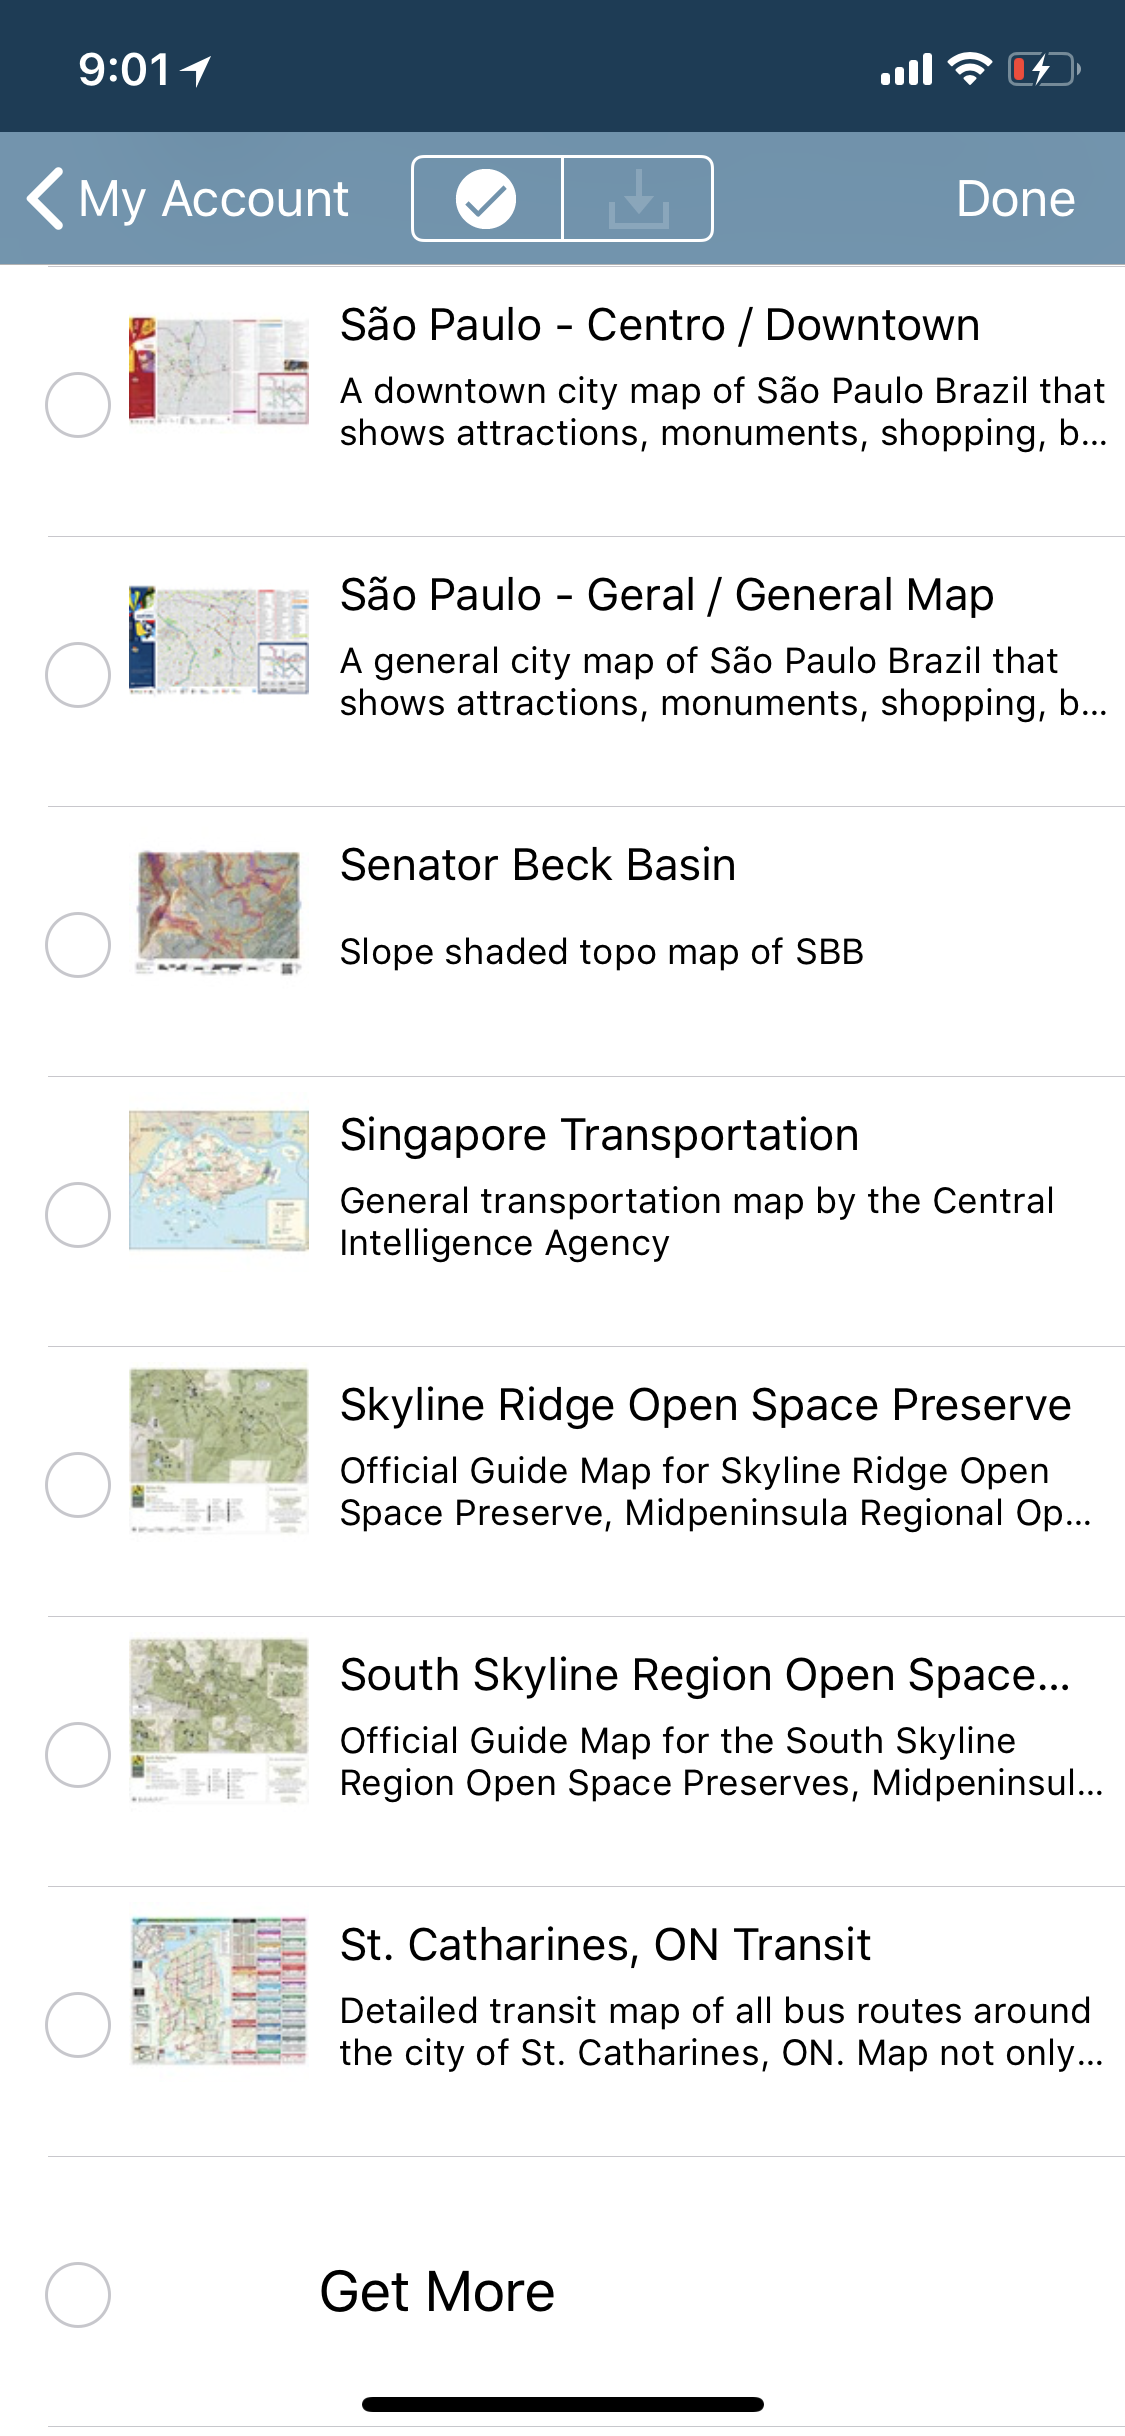
Map Store Login and My Account improvements. The user interface around logging and viewing your Avenza Maps account details has been vastly improved. You now have the ability to change your password, change your email, and view your download history. The Download History screen has new functionality as well. Previously you were only able to download one map at a time. Now you’ll be able to select multiple maps at a time and download in bulk. In addition, you’ll also be able to access map descriptions without having to go to the Map Store to look it up.
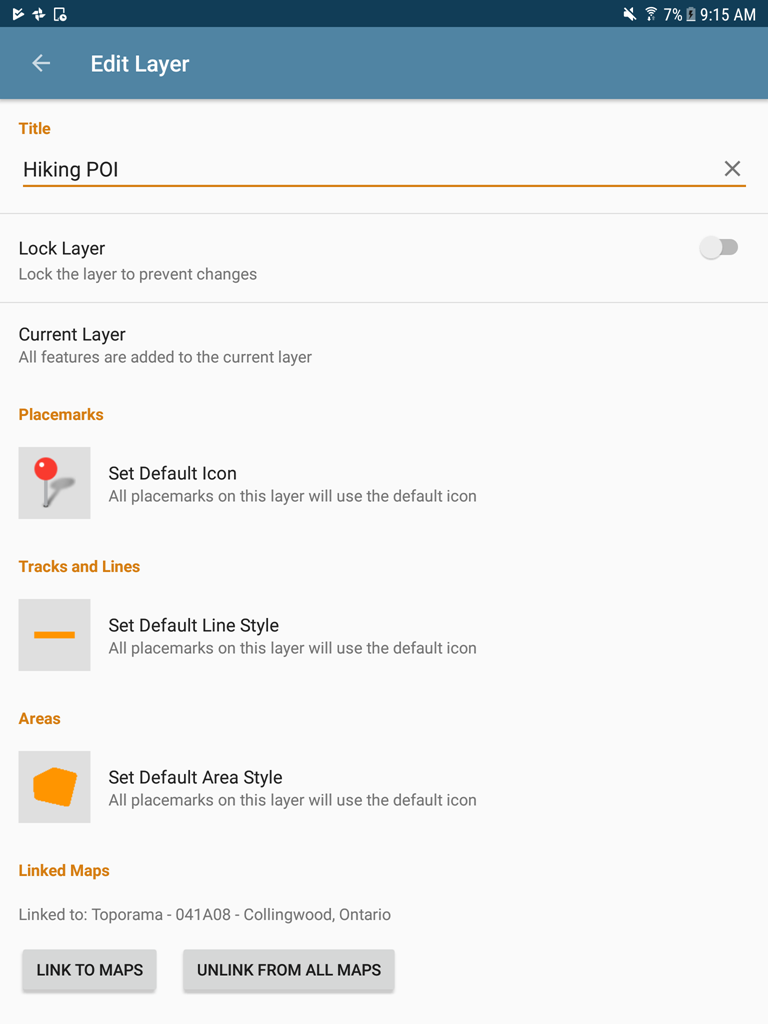
Layers now available on Avenza Maps for Android. Rejoice Android users, layers are finally here! Having the same functionality as the iOS version, map features (placemarks, lines, tracks, areas, photos, and schema) are now contained on layers. Map features can be managed here, including adding, deleting, and editing map feature information. In addition, the layers can be linked (and unlinked) to maps, so that map data can continue to be used even if a map is no longer on the device. Similarly, if that map is installed again, you’ll be able to link that layer to the map again. You’ll also be able to export layers data directly from the Layers screen without having to go into each map.
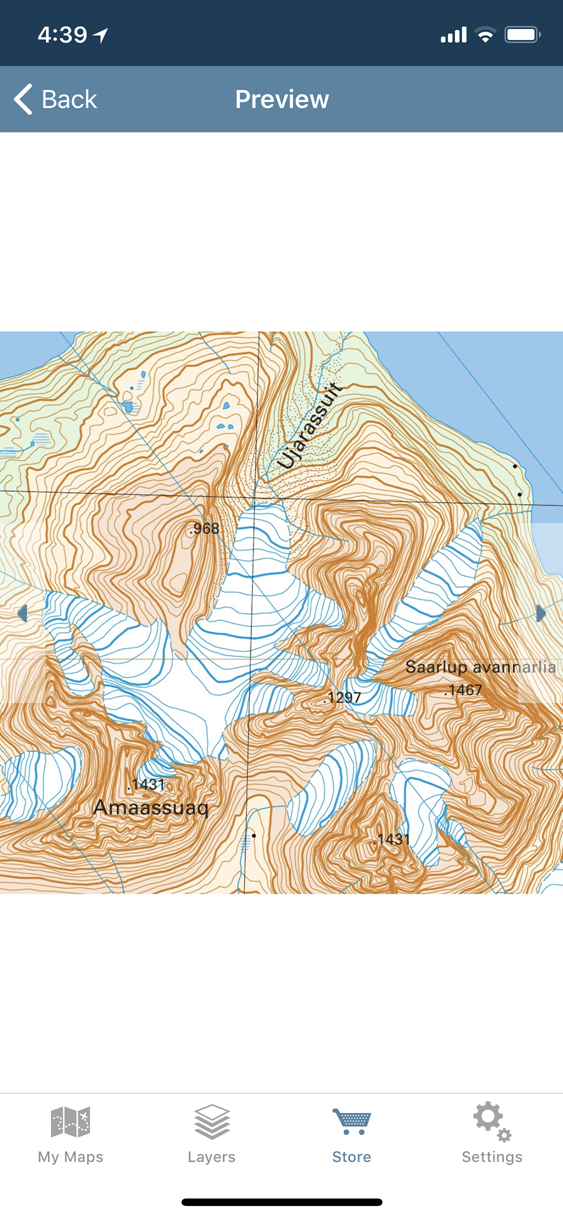
Better quality Map Store previews. All of the map listing previews in the Map Store have been updated and now have higher resolution of busy sections of the map to provide better detail of features, lines, labels, and colours.
Release Notes
User experience improvements, including sorting and filter options on the My Maps screen
Newly designed Map Store Login and My Account screens
Re-discover, select and re-download previously purchased Map Store maps using new options available on the Downloads History screen
Export Layers data directly from the Layers screen
Link a layer to any available maps or unlink from all maps from the Edit Layer screen
Better quality map previews in Map Store
More granular control of map features’ visibility
Manage, import or export your data independently of maps using the new Layers tab on Android
You would be hard-pressed to find a person living in a developed country who has never used Google Maps, let alone heard of it. In May 2017, Google announced there were over two billion active Android devices and that the Google Maps app had over one billion downloads. Take into account the fact that Google is the runaway leader among search engines, it’s not a stretch to think that Google Maps is one of the most widely utilized desktop and mobile applications in the world.
While Google Maps has been in use since its debut in 2005, few have taken the time to consider the technical cartographic elements under the hood. For most everyday users, they don’t need or care to understand the cartography—it’s a tool to get directions, view their neighbourhood, or scope out a destination for their upcoming trip. However, cartographers and GIS software developers alike have been reluctant to praise Google. This is because Google Maps uses a variant of the well-known Mercator projection known as Web Mercator (also often referred to as Pseudo Mercator or Google Web Mercator).
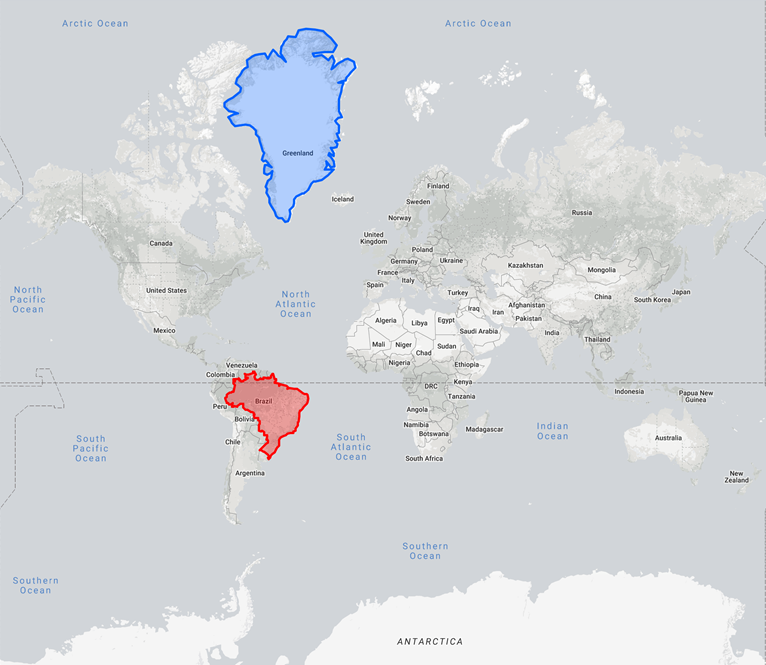
While there are several pros and cons of the Web Mercator projection, it comes under fire mainly due to the fact that locations away from the equator undergo severe stretching and distortion. This can be easily visualized using thetruesizeof.com, which is a tool that allows users to compare the size of countries if they were located at the same latitude. Let’s use Brazil and Greenland as an example. In their normal locations, Greenland appears to be almost four times the size of Brazil.
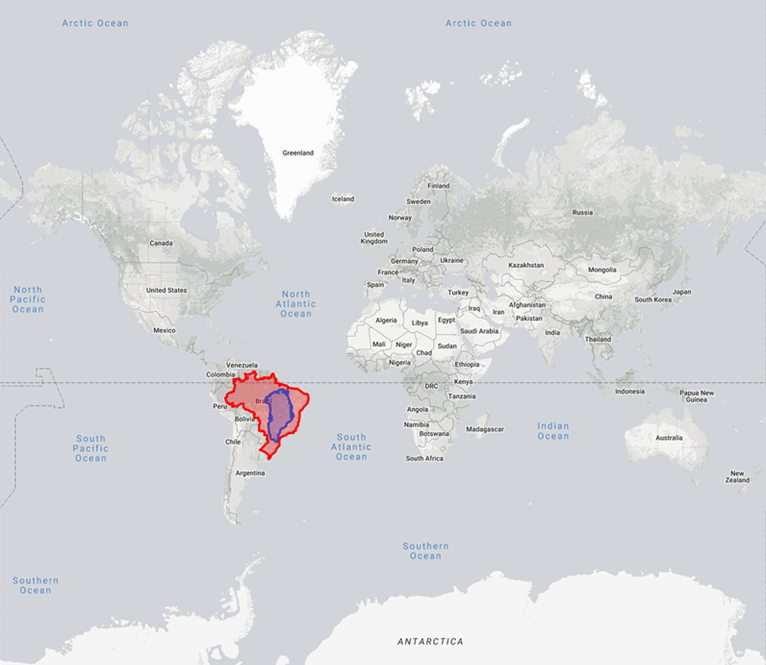
However if we move Greenland down to the equator, it shrinks to nearly a quarter of the size of Brazil, which in reality it is.
A number of publications, presentations and GIS blogs have warned about the “dangers” of mapping using Web Mercator. A lack of understanding between the standard Mercator and Web Mercator projections and the resulting inaccuracies forced the National Geospatial-Intelligence Agency (NGA) to issue an advisory to all internal departments prohibiting the use of Web Mercator. But the popularity of Google Maps has prevented Web Mercator from going away, thus GIS software and third-party mapping applications continue to support it.
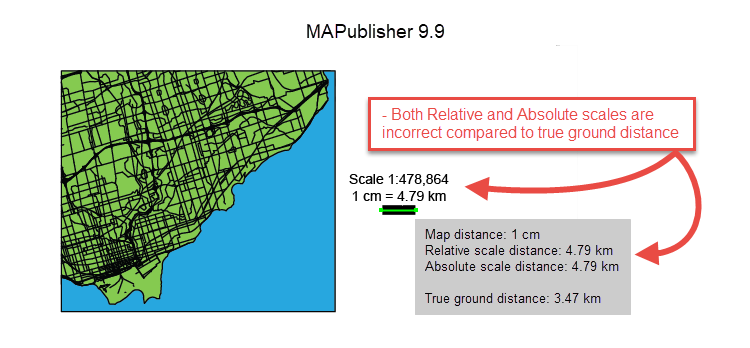
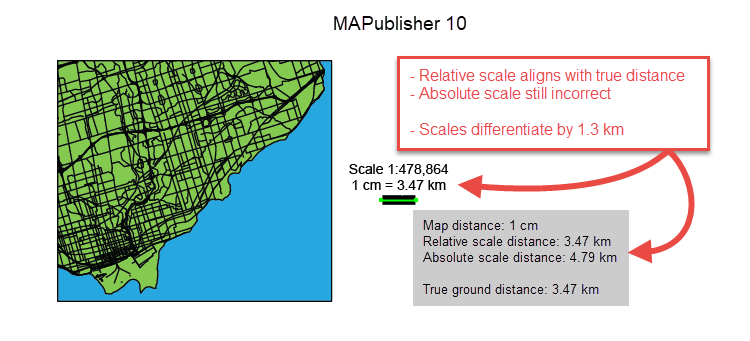
In previous versions of MAPublisher (9.9 and earlier), the absolute scale (e.g. 1:500,000), relative scale (i.e. 1 in = 1 mi), and scale bar length were all calculated based on the projection’s point of true scale. Because Web Mercator’s point of true scale is always along the equator, the scale bar tool did not account for the stretching a map experiences as latitude changes. The scale values conflicted with the actual distance on the Earth.
We received numerous feature requests to have the scale bar length calculated based on the latitude at the centre of the MAP View. For MAPublisher 10.0, we made adjustments to our scale calculations to do just that. However, we quickly realized we were still reporting the equatorial absolute scale value.
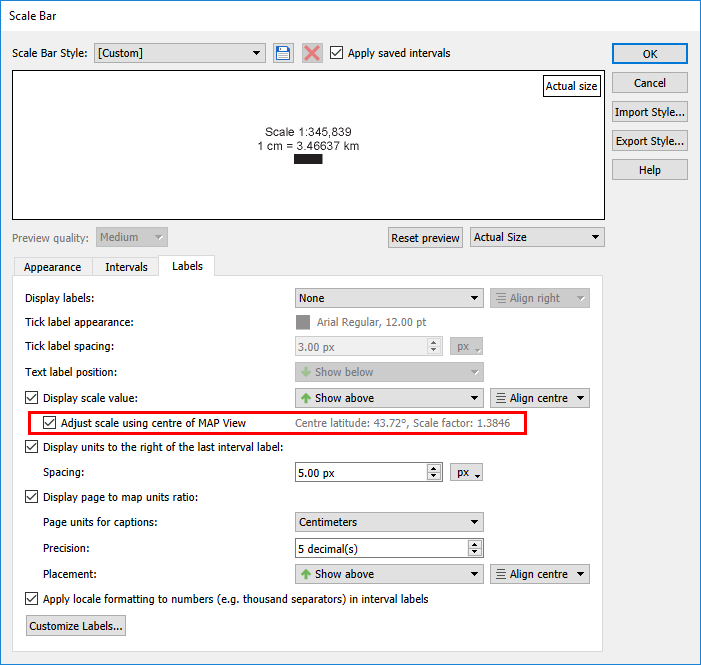
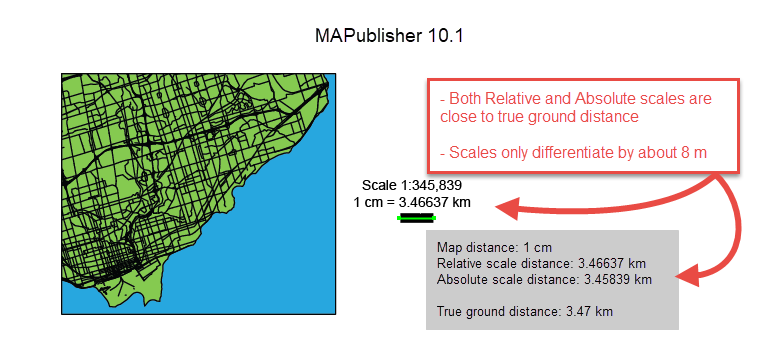
To fix the discrepancy between the two values, MAPublisher 10.1 introduced an option to adjust the absolute scale value by the scale factor, which is calculated based on the MAP View’s centre latitude. This ensures all three scales are in agreement. It should be noted that this feature is best suited for medium to large scale maps. Small scale maps cover too great a distance for the scale to be consistent across all areas.
So let’s recap. Google Maps is great for the beginner and amateur cartographers, providing an easy to use tool for spatial data visualization. However, the Web Mercator projection should be avoided, especially if performing data analysis or if mapping for military, surveying, or geodesy purposes. But what happens when you absolutely need a Google-friendly web map? Do not include the absolute or relative scale values because as the zoom level or location changes, the scale value is no longer correct (in some cases a scale bar is okay). Additionally, Google and Bing web tiles display dynamic scale bars that update based on map location and zoom level. However if you really want to include a scale graphic to give the reader some perspective, MAPublisher provides the tools necessary to ensure your map is as accurate as possible.
Whether you’re an experienced atlas maker or embarking on your first project, we all know producing an atlas is no small task. In short, an atlas consists of a series of maps and an associated index. Seeing that cartographic content often takes centre-stage, when planning your project it is easy to assume that the map-making process will be the most demanding. However, the proper indexing of map features is often by far the largest individual task when it comes to producing an atlas and can be quite burdensome.
You will be happy to know that MAPublisher 10.1 makes indexing that much easier with the addition of the Include Page Numbers option to the Make Index tool. This advanced option completely automates the indexing of page numbers while also enabling the indexing of two page maps on a single artboard.
For atlas makers, this new addition will streamline and improve the indexing process making it a key enhancement considering the primary function of an atlas index is to help the user locate features and points of interest on map pages.
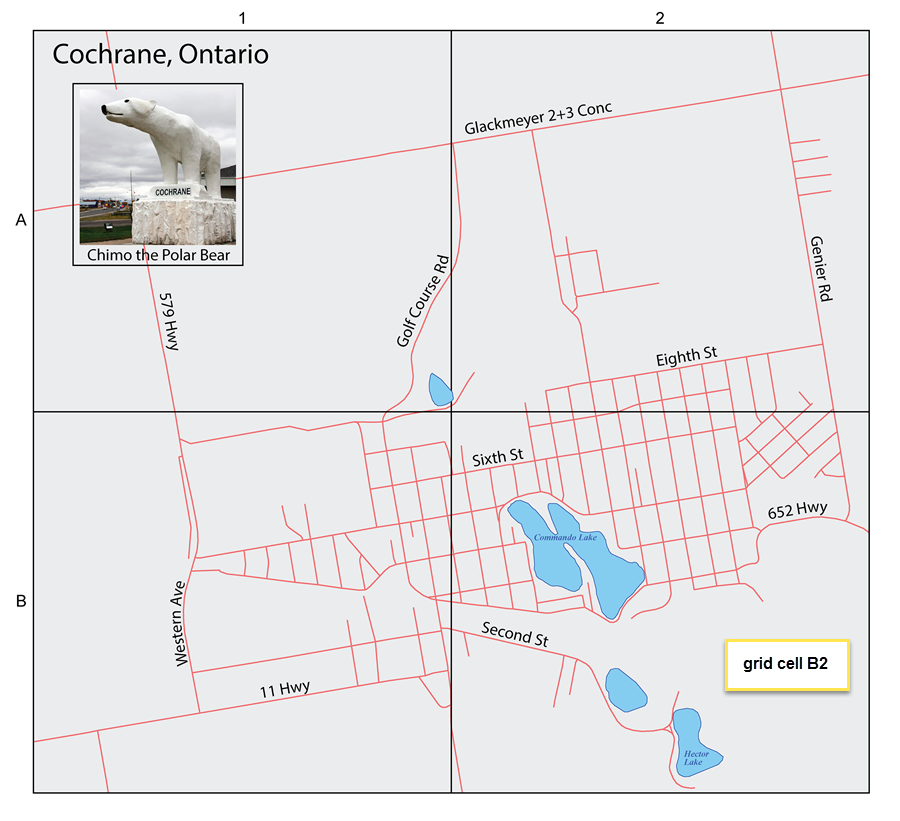
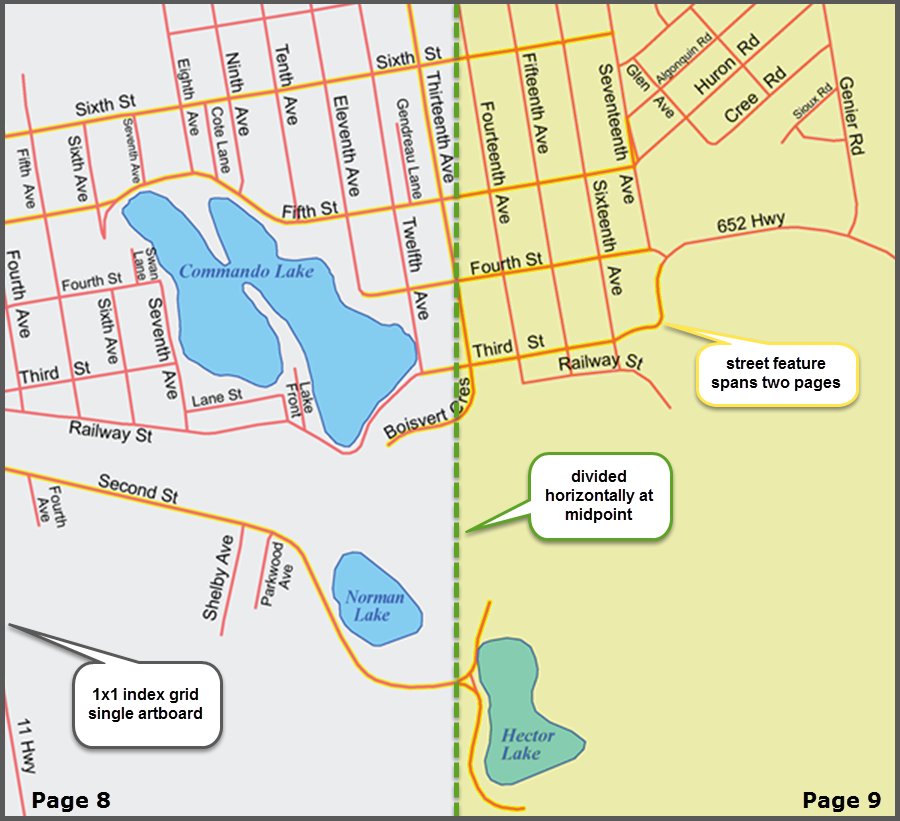
Let’s take a look at a basic street atlas of Cochrane that was created using MAPublisher 10.1. Cochrane is a town located in Northern Ontario which is not only famous for its mascot Chimo but also for being the hometown of Tim Horton, founder of Canada’s largest coffee chain.
The atlas is divided into four sections: grid cells A1, A2, B1, and B2. Each cell contains two separate map pages numbered two through nine.
The following is a simple example which demonstrates the page indexing for atlas pages eight and nine found in grid cell B2.
Atlas makers can now index their page numbers as easy as one-two-three!
Step 1
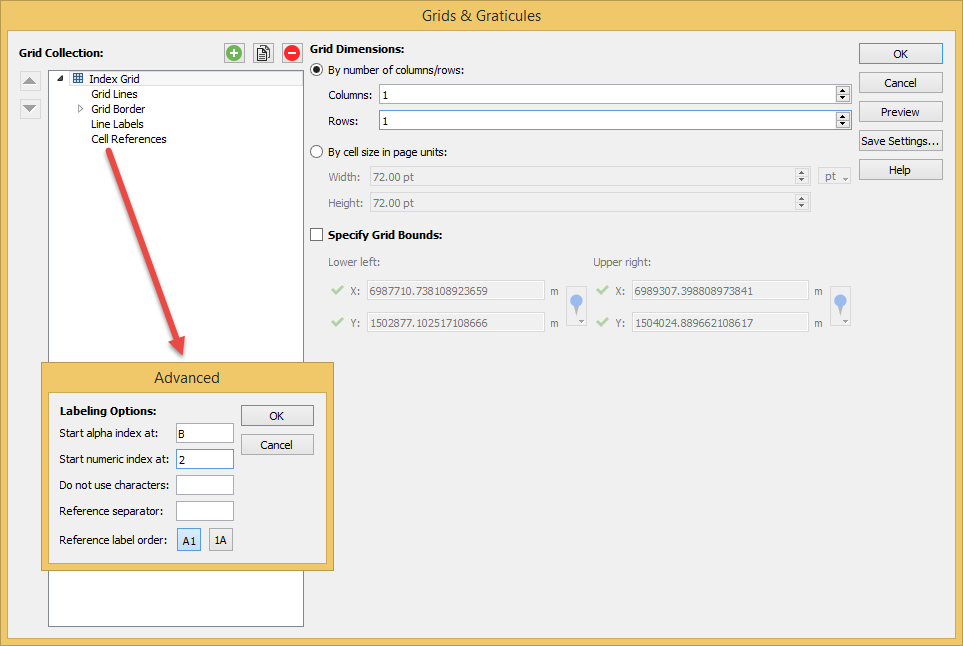
To start, using the MAPublisher Grids & Graticules tool, generate an Index Grid with one column and one row (1×1). Although the Index Grid option was selected, the Graticules or Measured Grid options can also be used if it better suits your atlas design needs. Additionally, Cell Reference Labelling was enabled and the advanced labelling options were set as displayed.
Step 2
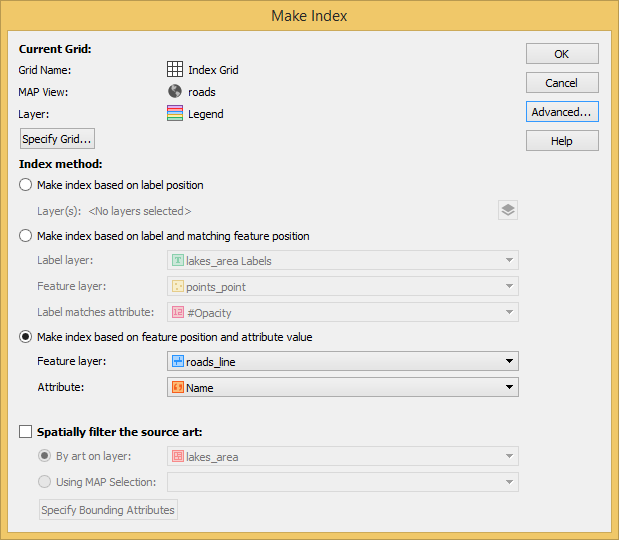
With your Index Grid created, access the Make Index tool which will initiate the map indexing process. Since we’re indexing streets in this example, we’ll go with the Make index based on feature position and attribute value. The feature position will be relative to which page or pages the street falls on while the attribute value will reflect the street’s name. In this example, streets which span two atlas pages have been highlighted with a yellow background on the map.
Step 3
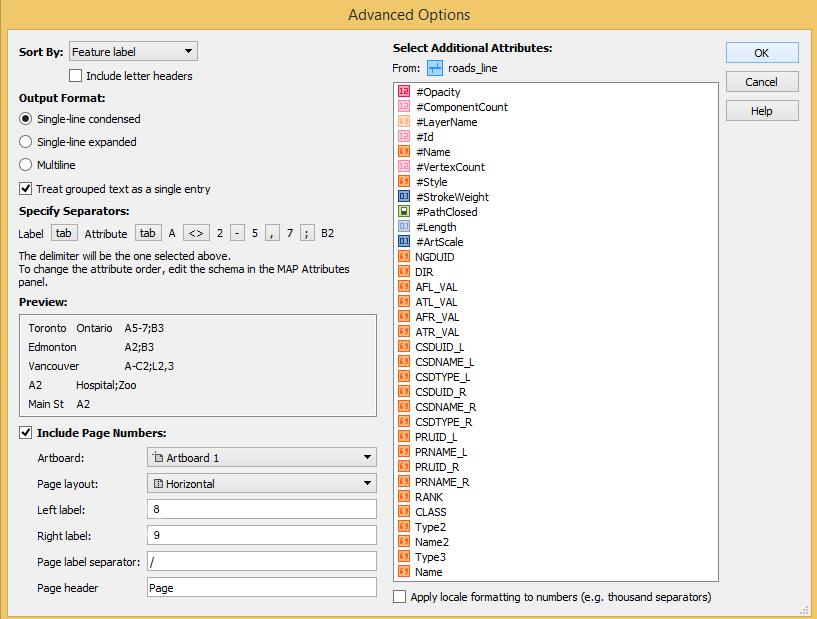
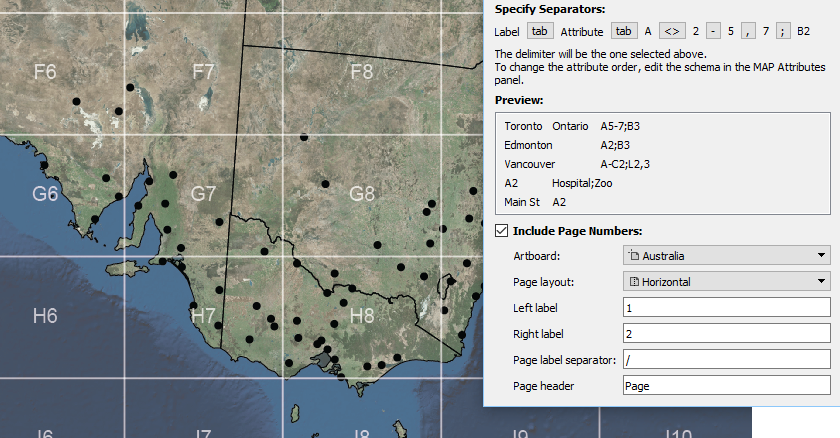
Since a single artboard is being used to map features which span two atlas pages, the Advanced option Include Page Numbers will be enabled with a horizontal page layout dividing the artboard into page 8 and page 9.
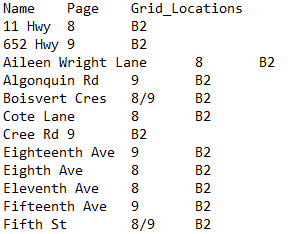
Simply click OK twice and your atlas pages will be indexed with the results written to a delimited text file as displayed below. From here, this file can be formatted and refined within a software like Microsoft Excel, Google Sheets, Quark Xpress, etc.
Portion of the delimited text file output:
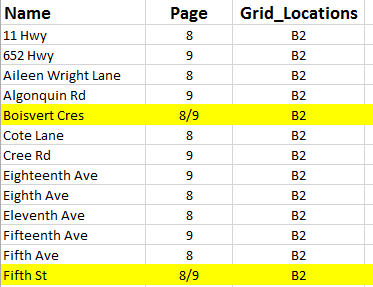
Same portion imported into Microsoft Excel:
Note: streets which span two pages have been highlighted to correspond to the map example.
By necessity, indexes are created towards the end of each project when atlas delivery deadlines are looming. It is therefore very important that the technology and methods used be robust and efficient. The introduction of the Include Page Numbers option has enhanced and simplified the map indexing process while meeting the specialized needs of atlas cartographers.
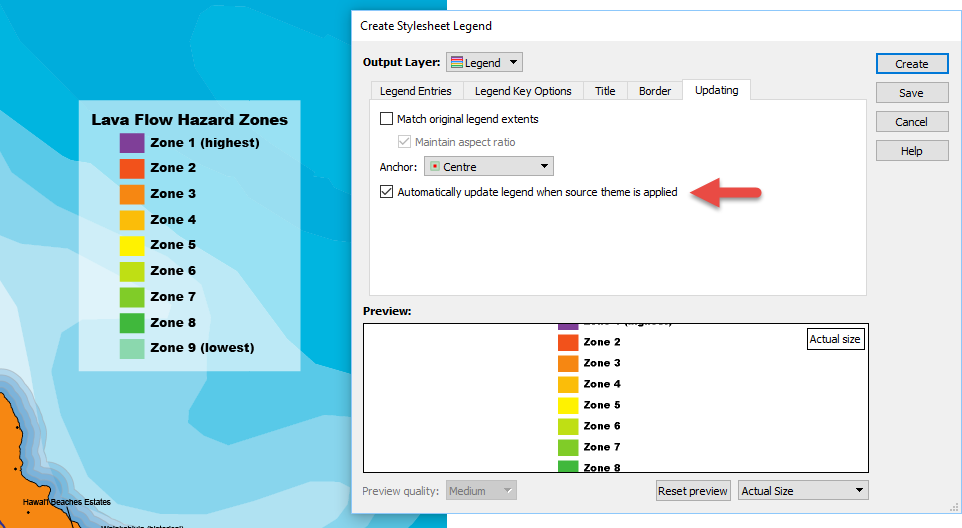
With the release of MAPublisher 10.1, you no longer have to worry about recreating map legends every time you update them. Automatic Legend Update, available in the latest release, now allows for simple updating of an existing legend. Automatic Legend Update lets you update attribute data, or change the symbology/classification method/attribute field that is linked to a legend, and automatically have the legend update to reflect these changes – no more having to recreate the legend each time you want to change something! This is possible even with MAP Themes and Legends created in older MAPublisher versions once they are brought into the 10.1 environment.
In this blog, we’ll discuss how to open MAP Themes and Legends created in older versions of MAPublisher in the 10.1 environment in order to transform them into Automatic Legend Update. This example classifies populated places in Hawaii based on elevation. We will use the ‘Create MAP Theme Legend’ tool to create a copy of the legend, which by default will be set to automatically update. Any future changes applied to the associated MAP Theme will automatically be applied to the new legend.
Step 1
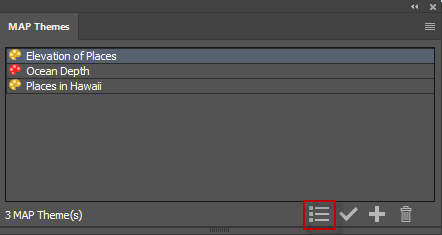
Open the MAP Themes panel from the MAPublisher toolbar. With the ‘Elevations of Places’ MAP Theme selected, click the ‘Create MAP Theme Legend’ button to create an Automatic Legend Update.
Step 2
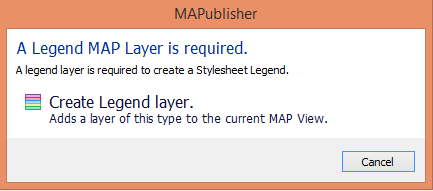
You’ll be prompted to create a Legend layer if you don’t already have one. Click ‘Create Legend Layer’ to continue.
Step 3
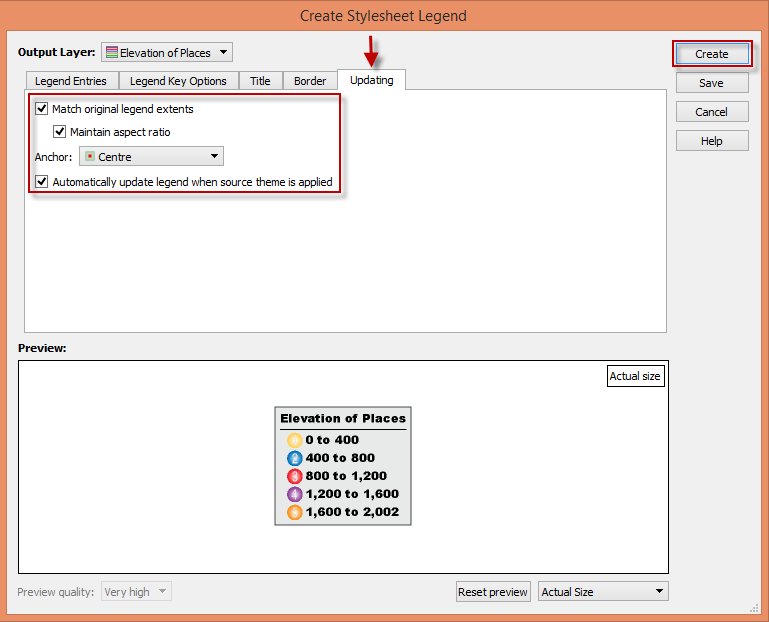
Note the legend in the ‘Preview’ section and how the legend styling and symbology are preserved, thus saving time. Click the ‘Updating’ tab to see or change your Automatic Legend Update settings. The “Automatically update legend when source theme is applied” checkbox is checked by default. In this blog, we’re also going to check the option to “Match original legend extents” to maintain the size and extents of the legend so as to not change the map layout when items are added to the legend. Instead, the legend elements will change size in order to fit within the existing legend extents. “Maintain aspect ratio” is checked to make sure that the legend elements resize proportionally and a ‘Centre’ anchor allows the resizing to start from the centre of the elements. Once you’re satisfied with your settings, click ‘Create’.
This will create a new legend with Automatic Legend Update that can be moved to any location on the map.
Now that you have created a copy of the legend with Automatic Legend Update, your legend will update when changes are applied to the associated MAP Theme.
A legend characterises a map and MAPublisher 10.1 helps to keep it up to date.
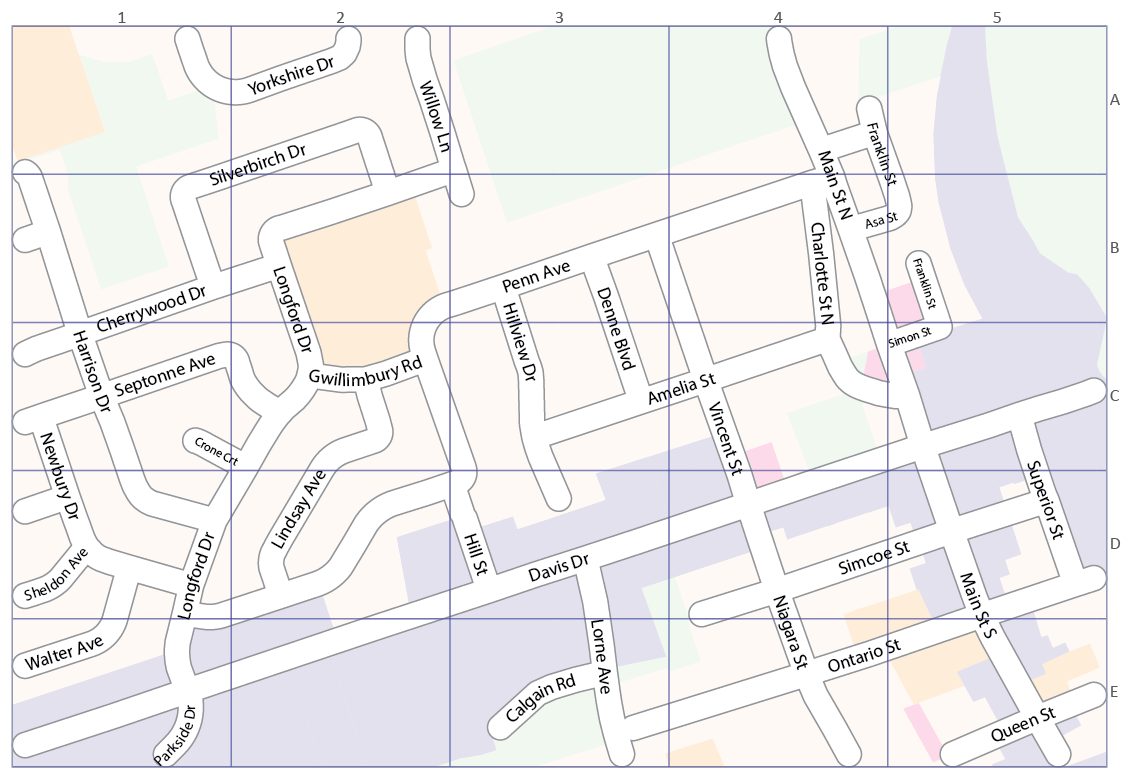
Do you have a street map that you’ve labeled by hand using ‘Type on a path’ that you want to index? Or have you used ‘Type on a path’ only to realize later that you still need those lines the text is now on? Without the original lines that the labels are on, it is not possible to make an index highlighting which grid cells are covered by which streets.
The new Text Utilities feature in MAPublisher 10.1, ‘Create line from text on a path’, allows you to recreate the lines that were originally used to create labels with ‘Type on a path’.
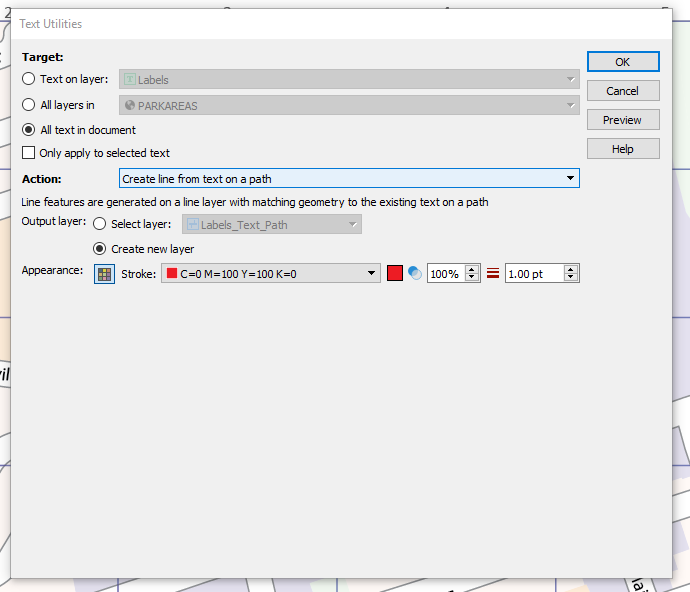
To use this tool to create indexes for maps you’ve labeled manually using ‘Type on a path’, navigate to Text Utilities on the MAPublisher Toolbar. Choose ‘Create line from text on a path’ as the Action item, and style the lines as you see fit.
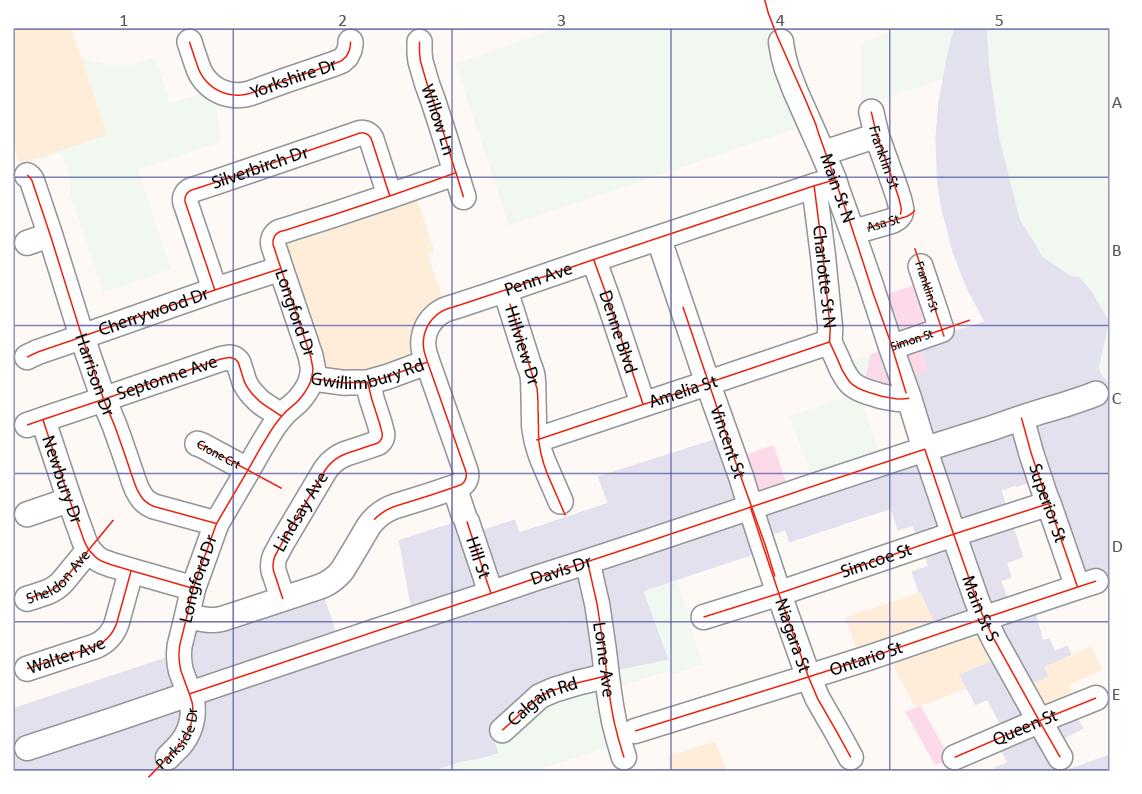
After you run the tool, you will see your newly created lines on the map
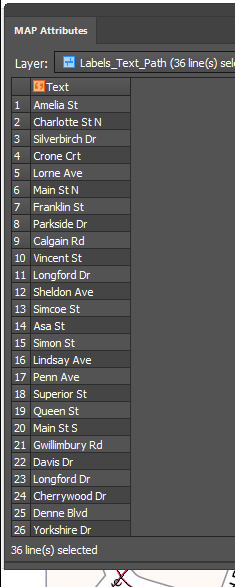
The ‘Create line from text on path’ also creates an attribute in the line layer it creates, called ‘Text’. You can see the new attribute by highlighting the newly created line layer, and opening the attribute table.
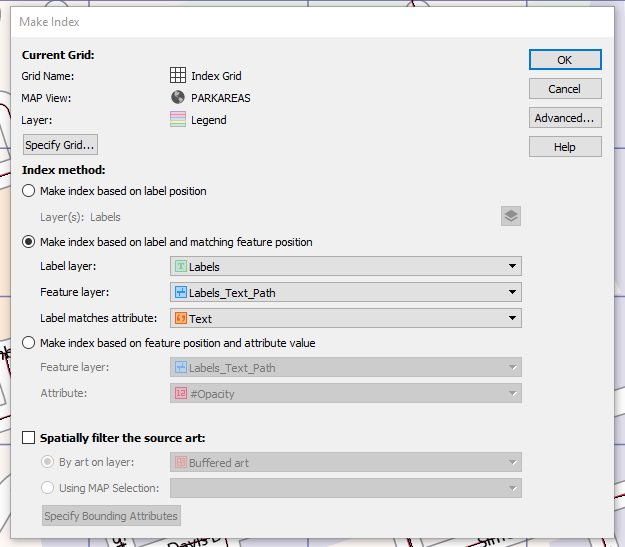
The ‘Text’ attribute is what allows the street names to be shown in the index. Once you’ve created the lines (on an existing layer, or on a new layer), you can then create an index (Index tool on the MAPublisher toolbar). For your index, choose either ‘Make index based on label and matching feature position’ or, ‘Make index based on feature position and attribute value’. Be sure to choose ‘Text’ as the ‘Label matches attribute’ or ‘Attribute’, to get the right values for your index.
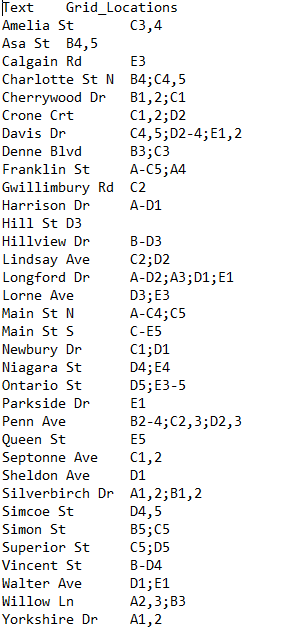
Once you have chosen your specific index requirements and settings, your index will be created with the street names (Text attribute) and the grid locations.
We’re excited to announce that we’ve released MAPublisher 10.1 for Adobe Illustrator. The MAPublisher product team has been working closely with our customers to build these features to improve map design productivity.
MAPublisher 10.1
This update contains new features and performance improvements as well as fixes for reported bugs. Some highlights are mentioned below, for the full release notes see below.
Automatically update existing legends when MAP Themes are modified. It’s here! MAP Theme legends are can now be automatically updated when legend items are updated in a theme. This is great time saver when you’re in the fine-tuning phase of selecting the right colour palette for your map and there is no need to manually update your legend.
New ability to create lines from text on a path. Creates a line based on a text on a path source. It’s useful for creating map features and to assist in indexing for manually created maps (i.e. scenarios where text was created manually instead of being created from attribute values). The text utility can be applied to text on a specific layer, on a specific MAP View, on the entire document or only selected text.
New ability to include page numbers when creating indexes. In the Make Index tool, a new Include Page Numbers option provides the ability to split a single artboard (horizontally or vertically) at the middle point to make indexes that include a reference to a page (left or right, top or bottom). This feature is useful when a map spreads over a single artboard that is intended to be split into two pages in a final output (e.g. a spread in an atlas). Text and features that span both “pages” can be listed in the index as appearing on both pages (i.e. indexing the extents of the text or feature).
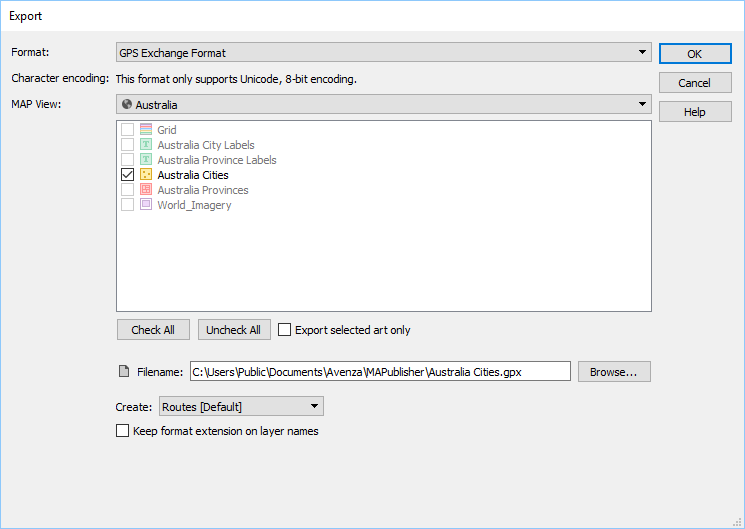
Export to GPS Exchange format (GPX) now supported. MAPublisher has long supported GPX import and now supports GPX export. It’s a format that contains contain tracks, routes and points and used to exchange data between GPS units and mapping software. It is compatible with the Avenza Maps app and many other third-party applications.
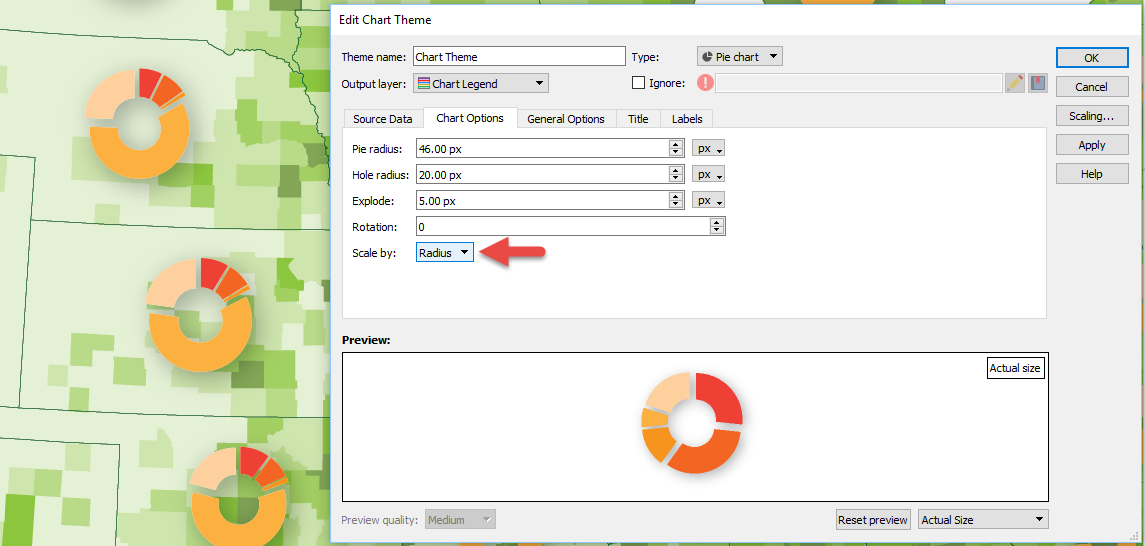
New ability to scale charts by radius. You now have the ability to scale MAP Chart Theme pie charts by radius, in addition to the existing method of using area. This provides another level of fine-tuning while adjusting charts to get proportional scaling correct. Remember that there are advanced scaling features available in the Scaling dialog box (just click the Scaling button). Learn more about chart scaling here.
MAPublisher 10.1 Release Notes
Automatically update existing legends when MAP Themes are modified
New ability to create lines from text on a path
New ability to include page numbers when creating indexes
Export to GPS Exchange format (GPX) now supported
New ability to scale charts by radius
A number of user interface and usability enhancements.
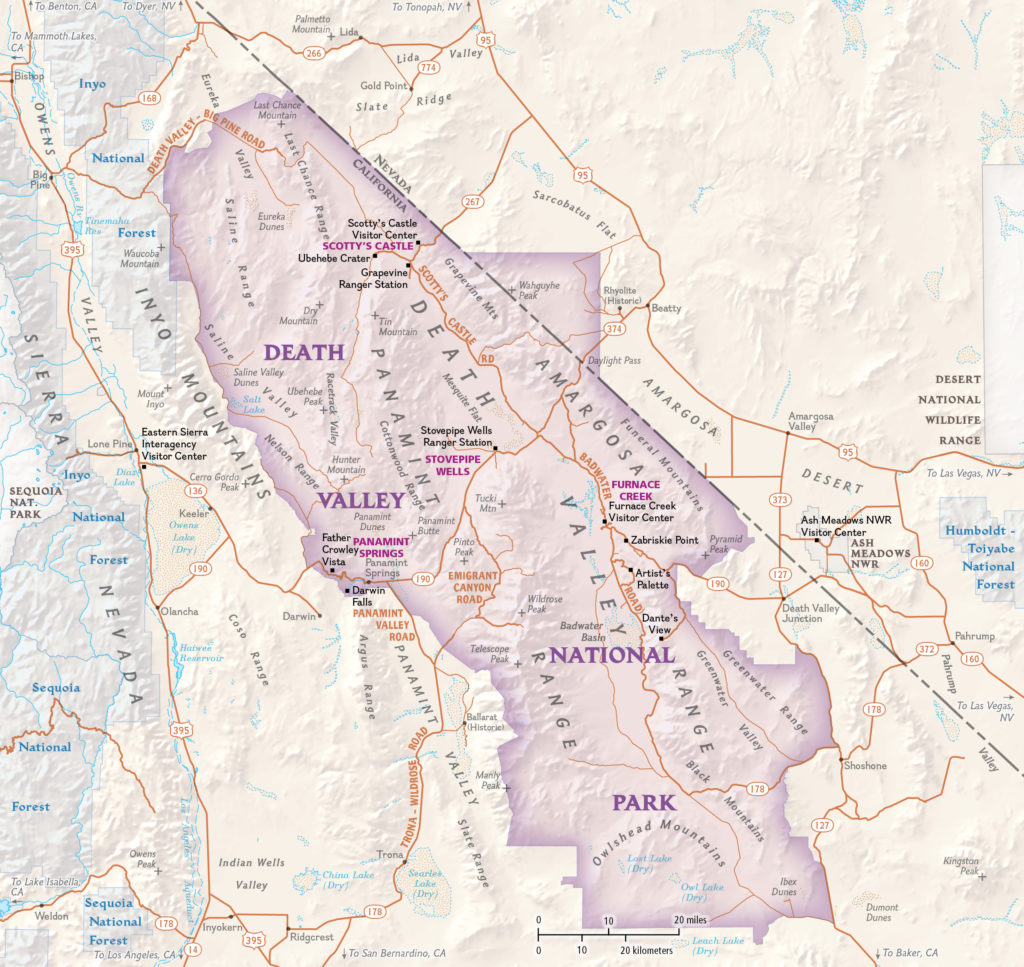
Colorado-based cartographer Mike Boruta knows a thing or two about making maps. In fact, this award-winning cartographer has been designing spectacular maps and trail guides for more than a decade. His work can be seen in the National Geographic Trails Illustrated series, in mountain biking guides released by Fixed Pin Publishing, fly-fishing reference maps curated by Stonefly Press, or most recently in the hiking trails guide for the mountainous town of Ouray, Colorado, where he currently lives. Always fascinated with viewing the world from above, Boruta has dedicated his career to capturing the beauty of mountain landscapes through well-designed maps, and captivating cartographic styles.
Following several years of post-university travel, Boruta found himself living in the tiny tourist-driven town of Ouray. Seeking more opportunities for career advancement, he moved to Arcata, located on the north-western coast of California. He considered returning to school to pursue a computer science degree but realized the subject matter did not entirely excite him. That was when a coworker of his first told him about the excellent Geography and Cartography programs at Humboldt State University nearby. He learned about a subject-stream called Geographic Information Systems (GIS), and although having never heard of GIS before, the concept immediately interested him. His years of travel had given him quite an appreciation for maps, and the GIS and Cartography programs at HSU would allow him to combine this appreciation with an interest in computer technology.
He quickly developed a passion for cartography and decided to pursue graduate schooling in Athens (OH), where he studied under established cartographer Dr. Margaret Pearce. Forever drawn back to the rugged mountain landscapes where he had lived in the past, Boruta found a particular interest in studying relief representation in cartography, the technique used to create the illusion of 3D-terrain on a 2D map. He fell in love with the work of renowned Austrian cartographer Heinrich Berann, whose painterly style “birdseye” mountain maps continue to inspire him today.
“Anytime I had to choose a place to use for projects in my cartography or GIS classes I found myself pulled back West, usually to Ouray, Colorado. I grew increasingly interested in mapping mountainous places”
In 2009, Mike Boruta first began using Avenza MAPublisher in his work. He had recently won the Arthur Robinson Award for Best Printed Map, part of the CaGIS Map Design Competition, for his entry “The Million Dollar Highway”, which explored a scenic stretch of road connecting Ouray to Silverton, Colorado. The award included a student license for Avenza MAPublisher software and allowed him to seamlessly integrate its suite of cartography tools into his already Adobe Illustrator-heavy mapping workflows. Shortly after, he began working with the publishing company Fixed Pin to create a mountain-biking guidebook for the entire state of Colorado. The project was extensive and would require the creation of several complete and detailed map sets, each describing a unique part of the state. Recognizing the vast scale of work ahead of him, Boruta sought out mapping solutions that would help him enhance the efficiency of his cartographic workflow.
“This was the first time I really got to work with MAPublisher, and it was a joy to learn and to use. I immediately found out how useful it was to set up all my graphic styles and character styles since I was having to create 118 maps with the same look and feel.”
As Boruta found himself less and less dependent on dedicated GIS software, he opted to focus on completing his projects from start to finish directly in Adobe Illustrator using the many data import and manipulation tools of MAPublisher. This environment, he felt, “lent itself to so much more creativity”. Integrating these mapping tools into his workflow also meant he did not have to continuously replicate shared design features between each map, instead organizing and stylizing his data into a series of 15 “master maps” and using the MAPublisher Vector Crop tool to create separate individual maps for specific regions.
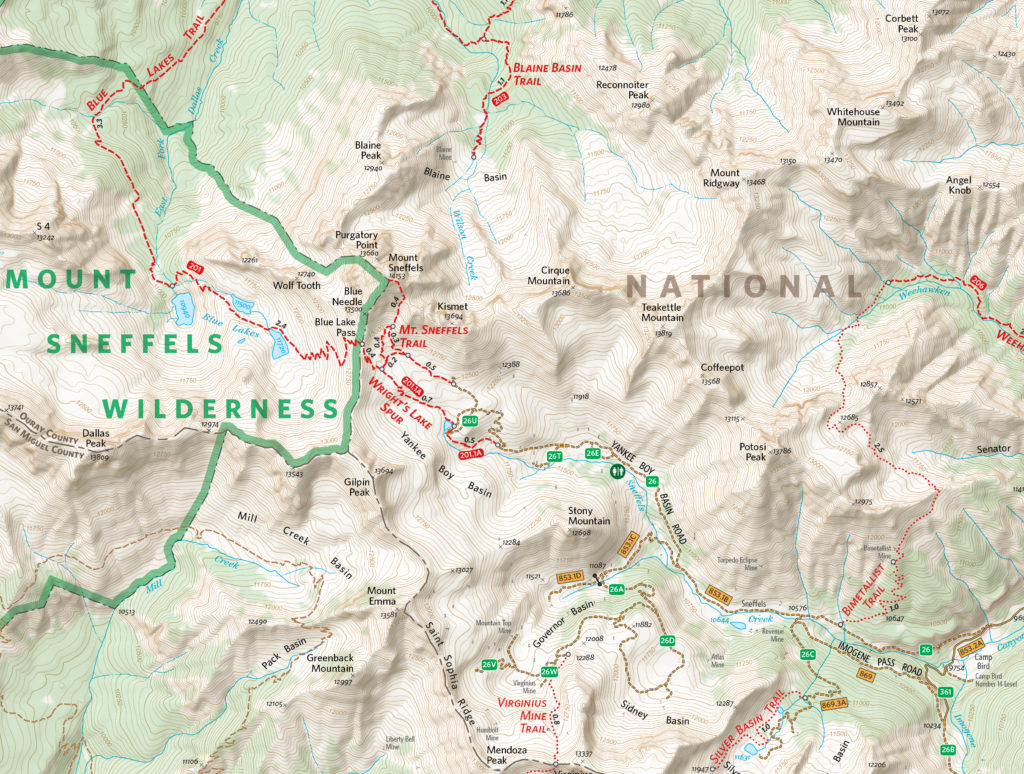
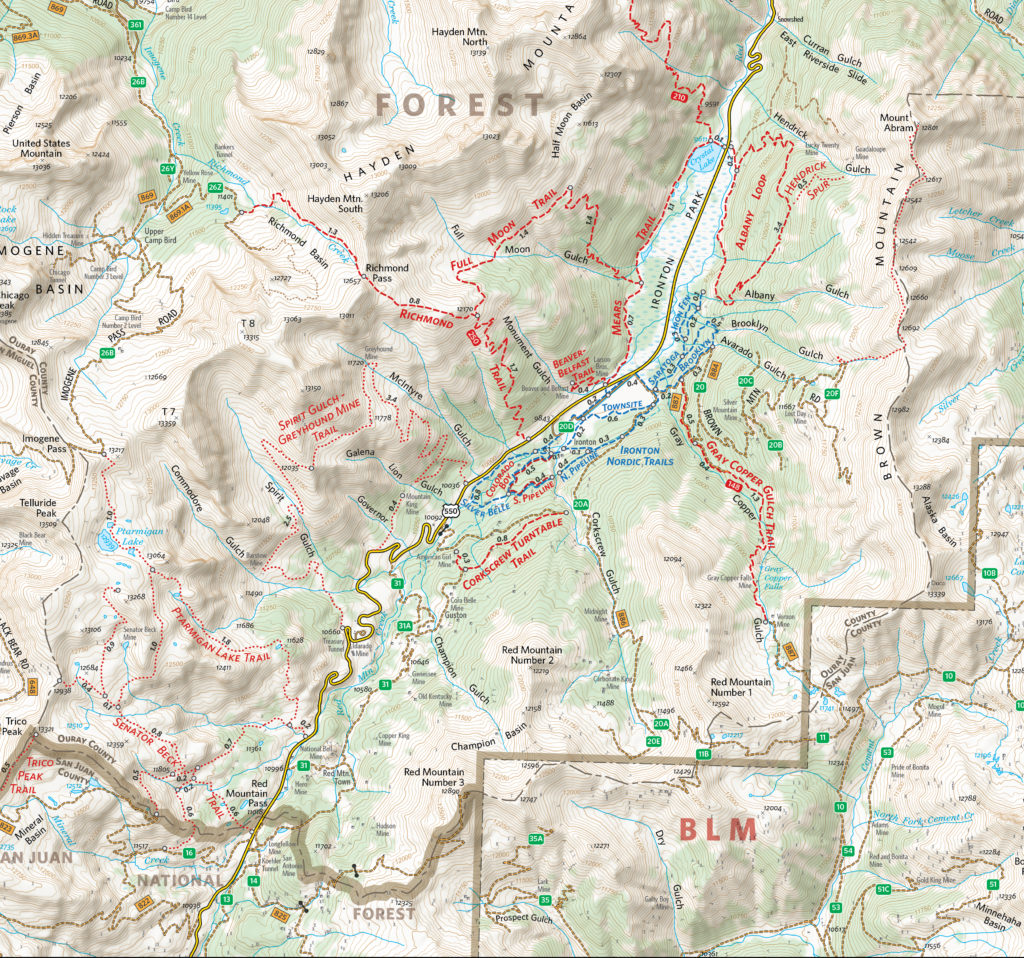
By 2011, Boruta had begun contract work with National Geographic to help produce maps for the Trails Illustrated line of topographic map products. Incredibly, in 2013 things aligned in such a way that he was able to once again move back to Ouray, the mountain-town he had fallen in love with many years earlier. There, he began meeting with the volunteer-run Ouray Trail Group (OTG) to discuss how he could help them improve their existing trail map, which is a major source of funding for the non-profit group. The first project was getting their map into the Avenza Map Store so that hikers could use the map on their phones and tablets. After that, it was clear that the newly created and extremely popular hiking route called the “Ouray Perimeter Trail” needed its own high-quality map.
Finding some free time in the summer of 2020, Boruta dedicated himself to fully revising the Ouray Trail Group’s main trail map and also creating an all-new map for the Ouray Perimeter Trail. His vision included a highly-detailed, topographic map showing the entirety of the county’s vast trail system. He set to work collecting datasets and planning the map production, first using dedicated GIS software, before reverting to a more design-focused workflow in Illustrator.
“I quickly moved things into Illustrator and MAPublisher and never looked back. There are certain tasks I’ve grown used to doing in MAPublisher that I just find so much faster and simpler to do than if I were in ArcGIS or QGIS”.
As is common with many mapping workflows, working from mixed data sources can be a constant challenge for many cartographers, especially when data from different public agencies do not share the same projection and coordinate systems. Boruta found this to be a common occurrence while working on his OTG trail maps and highlighted his fondness for being able to drag and drop data into different Map Views directly within Illustrator. In this way, he allowed the software to automatically reproject datasets to a shared projection without having to open up any sort of tool or repeatedly configure data parameters.
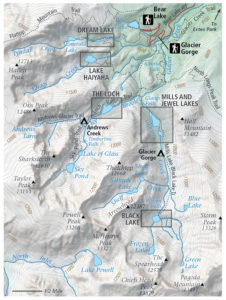
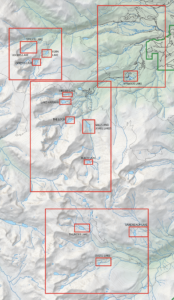
Boruta also emphasized how powerful the Vector Crop tools and “spatial filter on import” capabilities were, allowing him to quickly specify or delineate a region of interest and immediately crop all data layers to that area, retaining topology and attribute integrity, all within the Illustrator environment. When handling the reference maps used to guide the creation of the OTG trail maps, he implemented the Georeferencing tools in the Avenza Geographic Imager plug-in for Adobe Photoshop to efficiently georeference and georectify unprojected reference map images before integrating them back into his Illustrator project. After a large chunk of the summer working on the map, he delivered the finished trail map. On completing the project, he noted “It was one of the most satisfying projects I’ve ever worked on since I was literally mapping my own beloved backyard.”
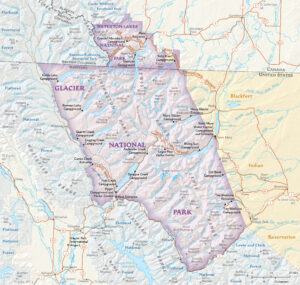
The completed Hiking Trails of Ouray County and the Uncompahgre Wilderness map is available in printed form, and users can also purchase digital forms of that map and the new Ouray Perimeter Trail Map in the Avenza Map Store. The digital maps are fully geo-enabled and support offline use for navigation and GPS-location on mobile devices using the Avenza Maps app.
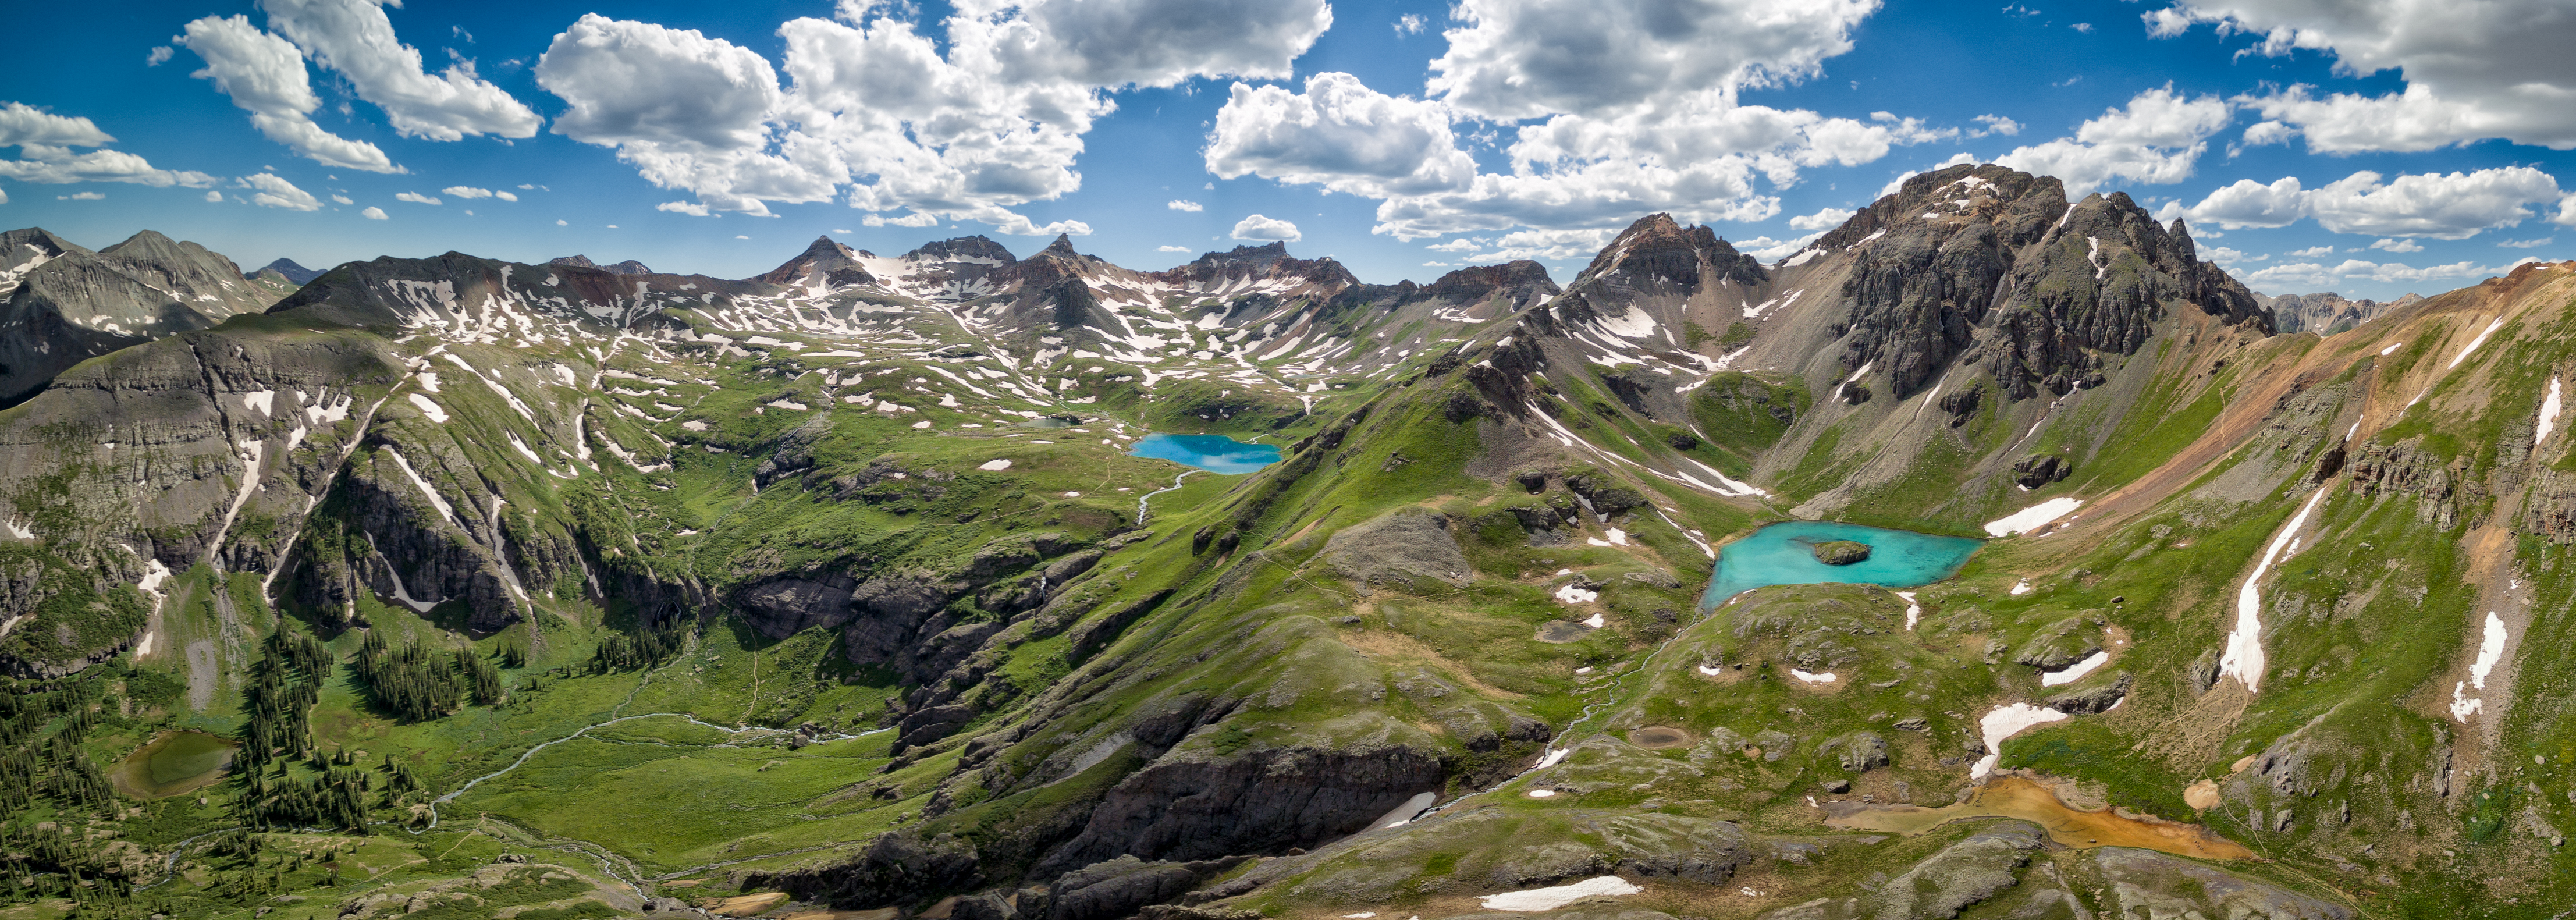
Mike Boruta still lives in his beloved town of Ouray. He spends his free time enjoying the trails and mountains which he has helped to map. He continues his work for National Geographic and has branched out his interests to include drone photography and videography. He operates the website OuraybyFlight.com, which showcases some of his spectacular drone photography work. His dream is to combine these dramatic landscape panoramas with overlaid symbols and text to create those iconic “birdseye” mountain maps that inspired him years ago.
“I envision something that would hopefully be more aesthetically pleasing, something that aims to capture the soul of these San Juan Mountains while also illustrating the geography. And just maybe it might also be something pretty enough to hang on the wall.”
As a company that makes software to create digital maps, that has a mission to create the largest repository of digital maps in the world, and has built amobile app to consume them, we believe firmly that digital maps are the way of the future. Like it or not, digital maps will eventually (if not already) reduce the need for traditional paper maps. It’s a debate that many people are as passionate about as they are about the digitization of books and music.
Take Dave McIlhagga, Founder and CEO of MapSherpa, a company which has spent years at the forefront of developing new ways for map publishers to deliver maps and for people to consume them. MapSherpa offers on-demand printing of maps so you’d think he would be on the side of the paper maps. “In fact, I see digital maps as more of a way to promote maps and map use rather than a replacement for paper,” says Dave.
A pioneer in the digital mapping space (read aninterview with Dave on our Facebook page), Dave sees paper versus digital not as a competition for supremacy but as viable options that complement each other. “Digital maps offer new ways of interaction and help us visualize the world differently by viewing data in ways that may not have been feasible in the past. However, paper maps are simple, informative, and accessible by everyone. They aren’t being replaced. Offering both are important and will ultimately drive demand for map publishers.”
When we look at recent history, streaming services like Spotify and iTunes all but replaced physical forms of music, and Netflix and similar video streaming services are doing the same to DVD sales, not to mention delivering the knockout punch to companies like Blockbuster. However, while streaming is the heavy favourite of Netflix users, they still have subscribers hanging onto its DVD service. Isn’t the same scenario playing out here for maps? Let’s look at some pros and cons.
Distinct Advantages of Digital Maps
More accessible (download from anywhere, instantly)
Easily edited, augmented, personalized, and updated
More useful – more map data in one package, multiple layers
Flexibility to zoom in and out change perspectives with a digital map (replacing the need for multiple paper maps)
Navigation and routing capabilities
Paper Maps Will Never Die
Digital maps are the future, but paper will be around forever
Publisher and retailers still have a strong demand for paper map sales
Maps for recreation
Maps for visualization on a large scale
Maps as paper art
Neither Format is Perfect
Paper maps can become outdated quickly, are more costly to update
Paper maps can wear out, tear, and become unusable
Digital maps have a learning curve on how to properly use them
Digital maps have screen size limitations
Mobile devices run out of power, break, and become unusable
Best of Both Worlds
We recently partnered with MapSherpa on a project that will allow map consumers to easily get maps in both digital and printed formats. Now, when you view aMapSherpa map in the Avenza Map Store you’ll have the option to also purchase a paper copy in a variety of sizes, and printed on a variety of different materials from MapSherpa’s map store,MapTrove. Find a map on the MapSherpa site, in paper format, and get the digital version for use on your mobile device in the Avenza Maps app. “It’s the best of both worlds for consumers and for publishers,” says Dave.
Honestly, corporate vision aside, we have to agree.
See MapSherpa’s collection of Winter Games themedmaps of South Korea, featuring Pyeongchang Seoul and Gangneung regions.