A scale bar is an important map element. Learn how easy it is to create a scale bar and customize it using MAPublisher. Scale bars can be edited easily after creation if updates or changes are necessary.
Check out this short video that demonstrates how to create and edit scale bars!
For more How It’s Done in MAPublisher videos, check out our YouTube channel!
Does your map have data that updates periodically? Maybe your river data gets updated each year, or the lake boundaries change. Typically, this means importing all the data into your map again as things change. To make your life easier, MAPublisher has the option to Manage Data Links, which allows you to check for updates to linked data and to automatically apply the updates to the map! You can even set your MAP Theme Stylesheets to apply to the new data so you don’t have to re-style it manually.
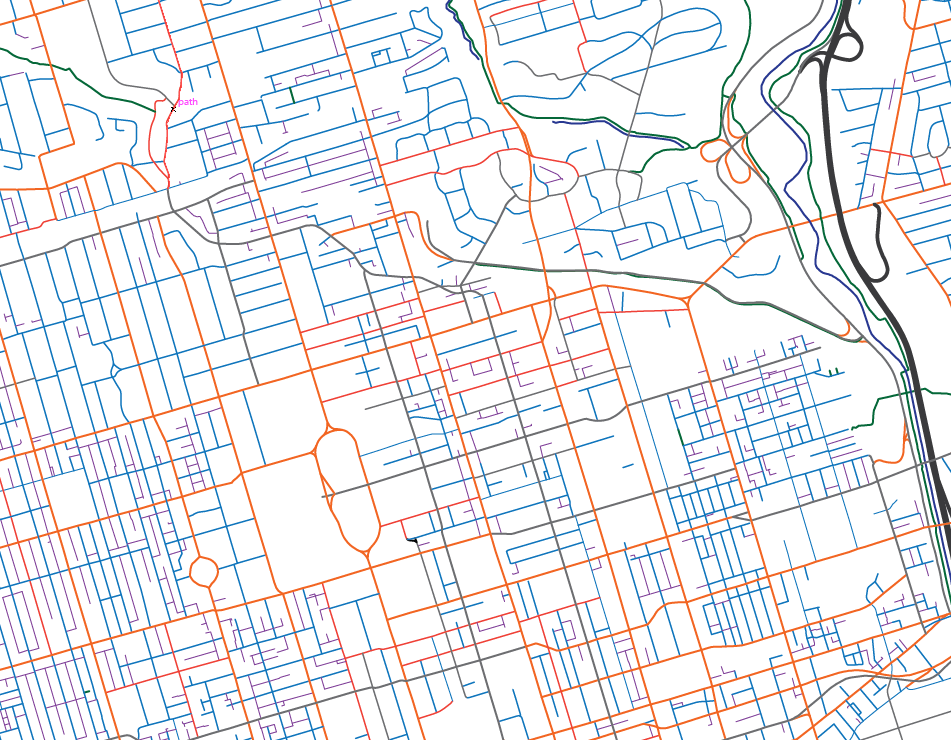
Say you’ve got a street map that you created last year. But, the city has updated the status of some of the streets. Some of the lanes have changed to local roads, and some of the minor arterial roads have been updated to major arterial. Instead of importing all of your data again, let’s create some data links (with linked MAP Theme Stylesheets) to update the map with ease.
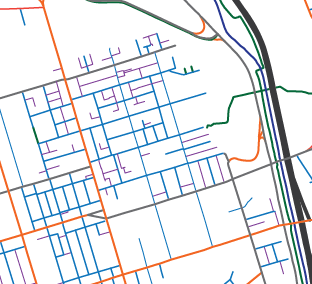
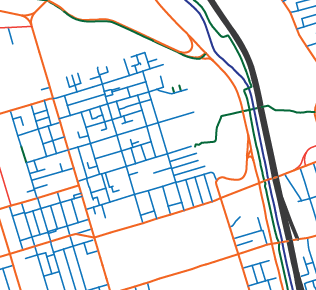
Let’s focus on a small inset of this map so we can better see the changes that will happen. In this example, we’ll focus on an area where we know the ‘laneways’ have changed to ‘local’ roads. Our laneways are purple, and our local roads are in blue.
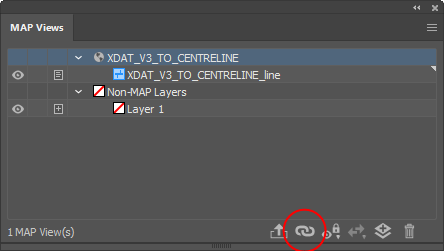
Now that we know what we’re looking for, let’s check out the data link itself. Your data link was automatically created when you imported your data. To access the data link, simply open the Manage Data Links in the MAP Views panel.
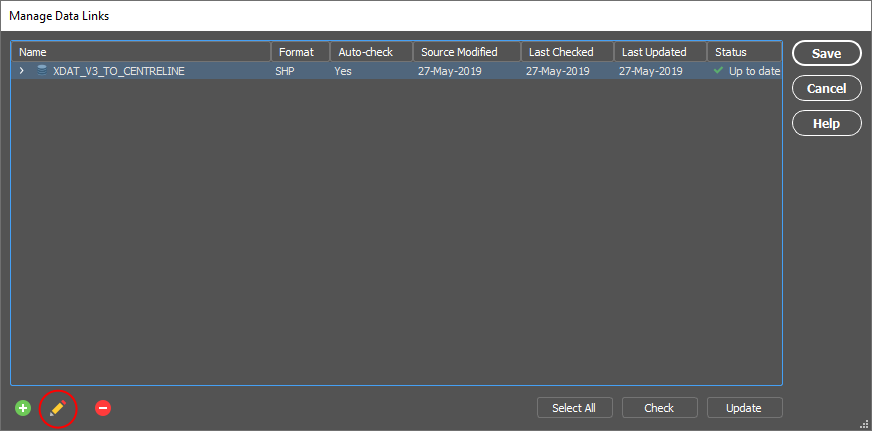
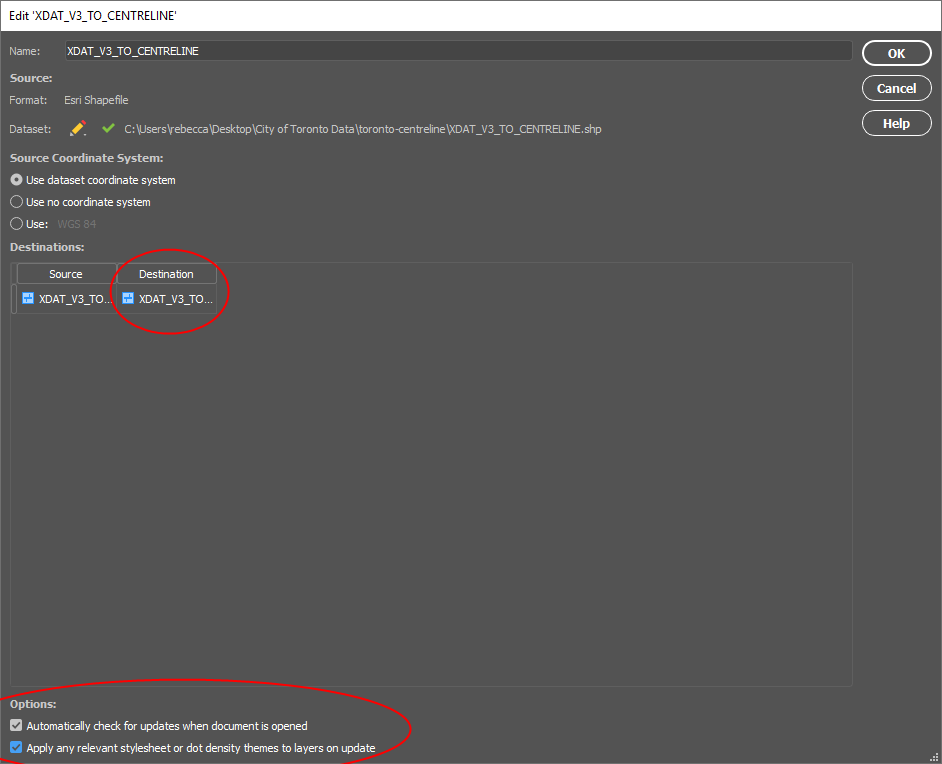
You’ll see that there is one data link, and that’s for the streets file we imported to make the map last year. To view the settings of the data link, click Edit (pencil icon) at the bottom-left of the dialog box.
Now you have the option to turn on the ‘Automatically check for updates when the document is opened’ setting, and (or) turn on ‘Apply any relevant stylesheet or dot density themes to layers on update’. In order for the stylesheet option to work, be sure to set the appropriate destination layer.
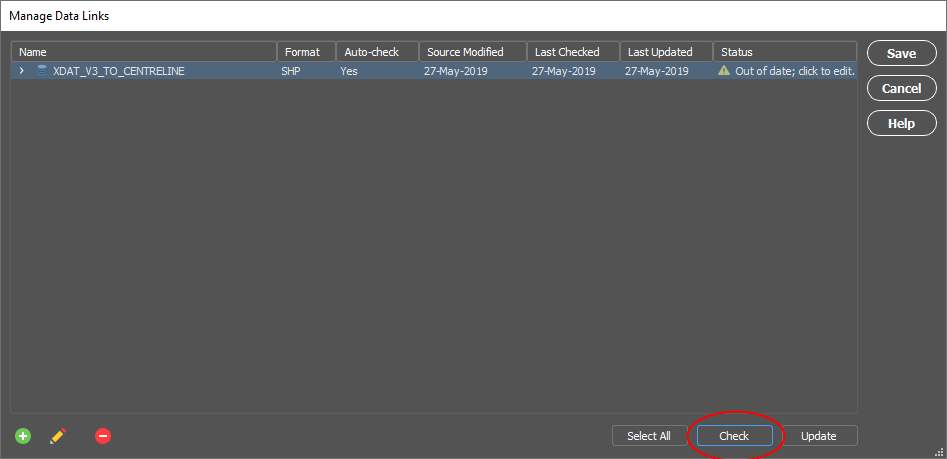
Once all the settings are set, check if there are any data updates by clicking the Check button in the Manage Data Link window.
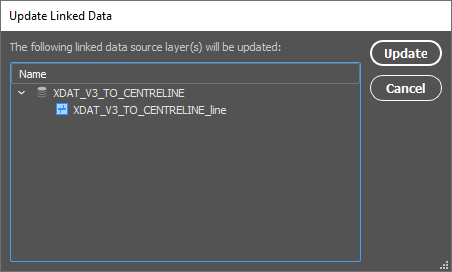
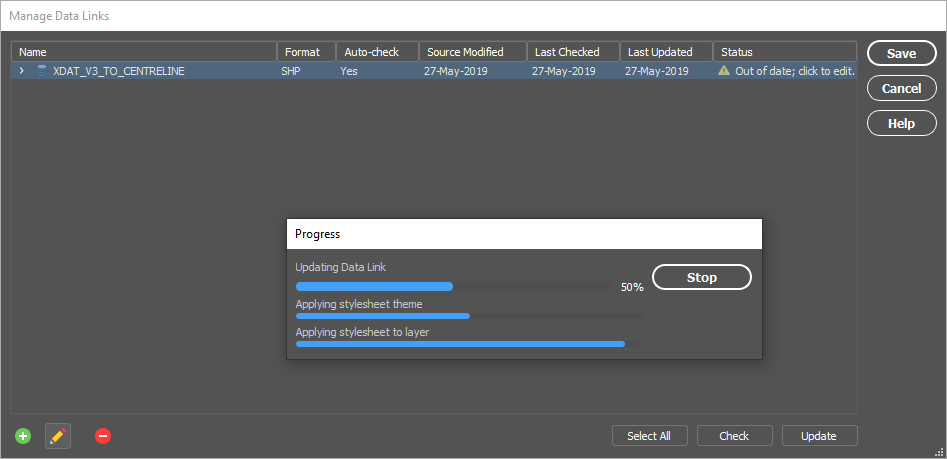
After checking we can see that the Status has updated to say that our data is out of date. Click the Update button to update the data. A dialog box will pop up to confirm that this is indeed the data you’d like to update. Click Update to start the update. I know that some of the ‘laneways’ have been changed to ‘local’ roads, and so the attribute has been updated. Since I created the MAP Theme using those, we should see the changes.
Once the update is finished, we can see on our map that all of our ‘laneways’ have changed to ‘local’ roads, and they have updated with the MAP Theme Stylesheet as well.
Using the Manage Data Links option is an easy way to update your data when updates become available! Save yourself the time and hassle of importing data over and over again and use the data links to your advantage. If you’re looking for more documentation, be sure to check out our help pages.
Sometimes when you’re on the hunt for geospatial data, all the data you need isn’t available in common file formats. Luckily for us, lots of data is available on Web Map Services (WMS), Web Feature Services (WFS), ArcGIS Online, ArcGIS Web Services, and PostGIS.
Data can be imported into MAPublisher from all of these services. Importing from a server connection always retains the attributes and referencing that exists in the original data. In order to import from a server, an internet connection is required.
WMS and WFS services can be part of open data portals, or for private use. Both services allow you to add layers of data to your map in MAPublisher, but have different functionalities. WMS allows you to import raster data in a variety of formats, while WFS allows you to import vector data.
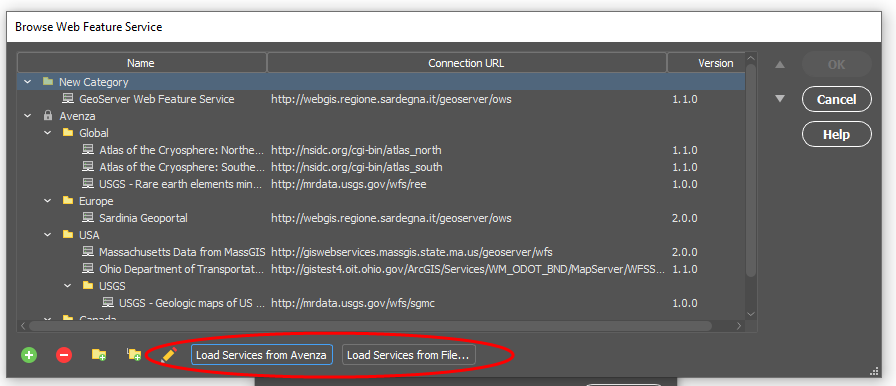
To import from WMS or WFS, go to Import or Multi Data Import, and choose Web Map Service, or Web Feature Service from the Format listbox. Once you’ve selected the source you’d like to use, load services from Avenza (pre-loaded services) or, import your own from a file.
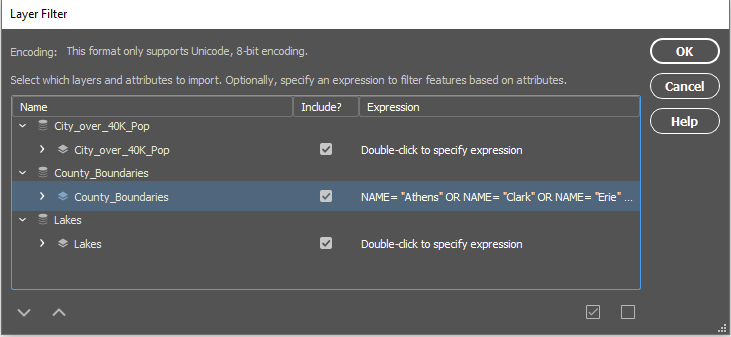
Once you’ve selected your specific service, you can select the layers you’d like to import. Information such as layer name and description is included. There is also the option to use the spatial filter directly in the layer selection box, to use the extents of another layer to specify, or specify exact coordinates to limit the area being imported.
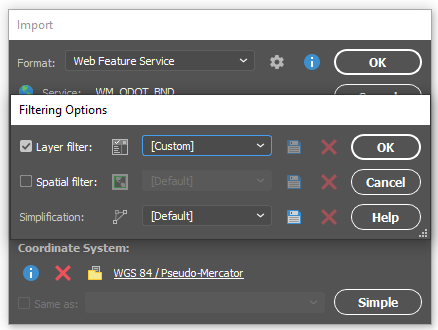
When importing data from WMS or WFS, you have the option to use the spatial filters, layer filters (attribute expressions included!) and simplification. These options allow you to filter the data to better suit your needs.
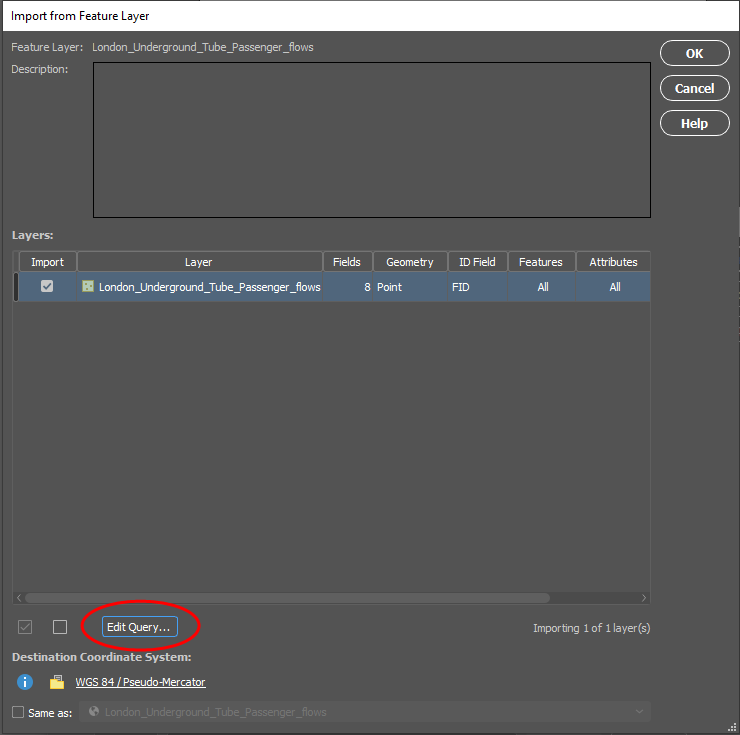
If you’re importing from ArcGIS Online, you’ll need an ArcGIS Online account, and an internet connection. Once you’re logged in, you’ll be able to select data to import. When importing data, you can choose Feature Layers, Map Image Layers, and Tile Layers to import.
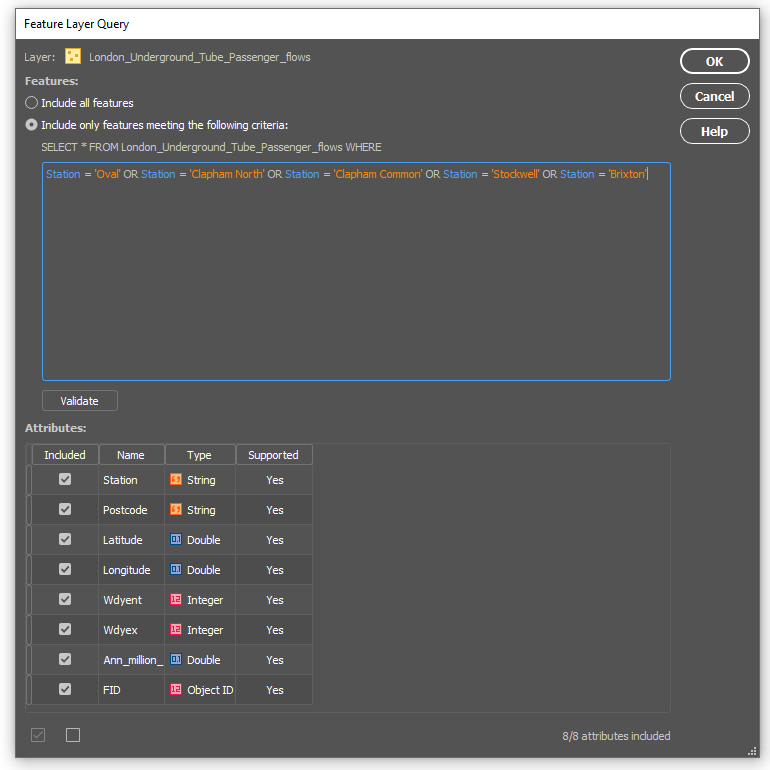
When importing Feature Layers, you’re able to filter the data as well. Once you select the Feature Layer that you’d like to import, you can choose to ‘Edit Query’ and write a SQL statement to narrow down the features or attributes you’d like to import.
Once your query is made, your data can be imported.
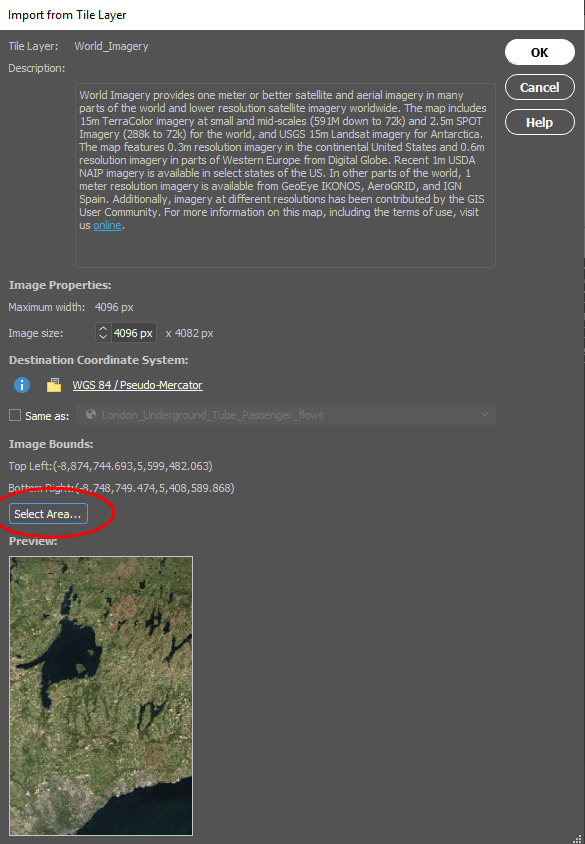
If you want to import Map Image Layers or Tile layers, you’re able to choose a specific area to import, very similar to the Spatial filters available when importing other files. Using the ‘Select Area’ option can help reduce the size of the image you’re importing and helps crop data before you import it, so you’re not importing large amounts of data you’re not going to use.
In order to import from ArcGIS Web Service, you’ll need an ArcGIS Web Service URL. Previously imported services are saved in the Service URL drop-down list.
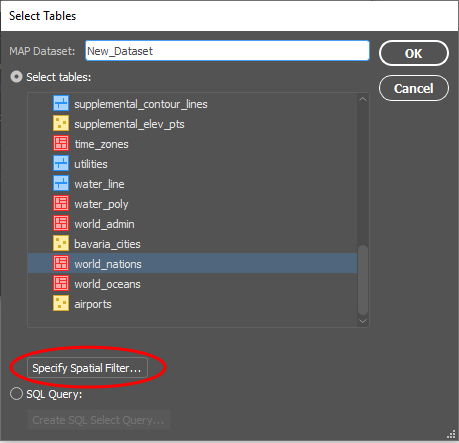
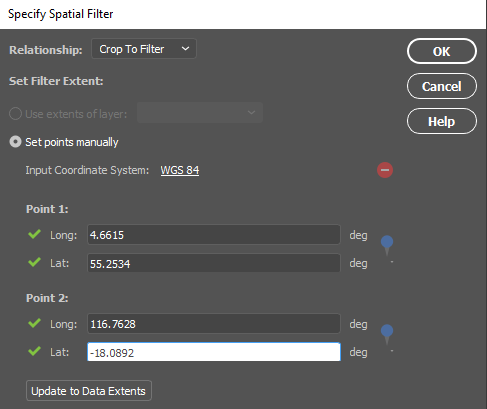
Lastly, if you’re importing data using the PostGIS option, you also have the ability to filter your data. You can specify a Spatial Filter, and manually set the coordinates for points 1 and 2.
This will allow you to import only the data you need! You can also filter your data using a SQL query, which will help reduce the number of features or attributes you need to import.
Importing from different servers can be a great way to get different data. The best part about importing from servers is that MAPublisher allows you to filter as you import, just as you can when importing other file types. Crop or query the data as you see fit, regardless of where the data came from!
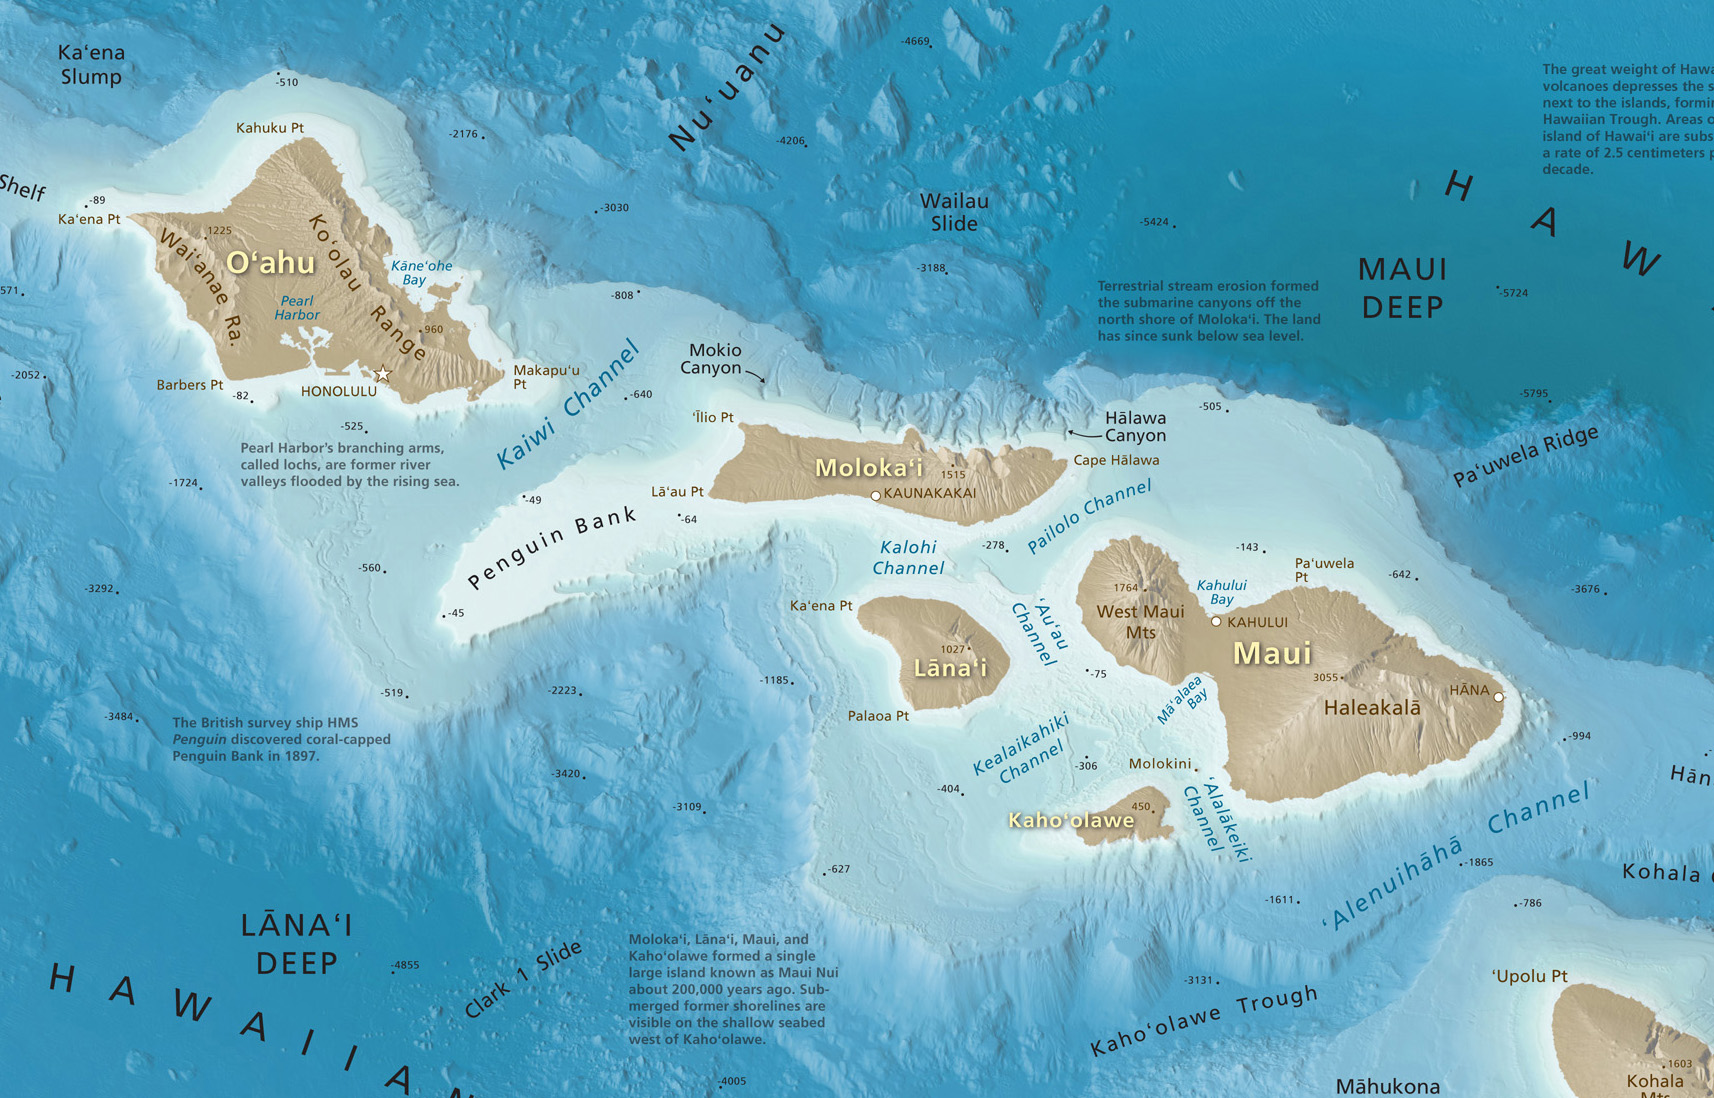
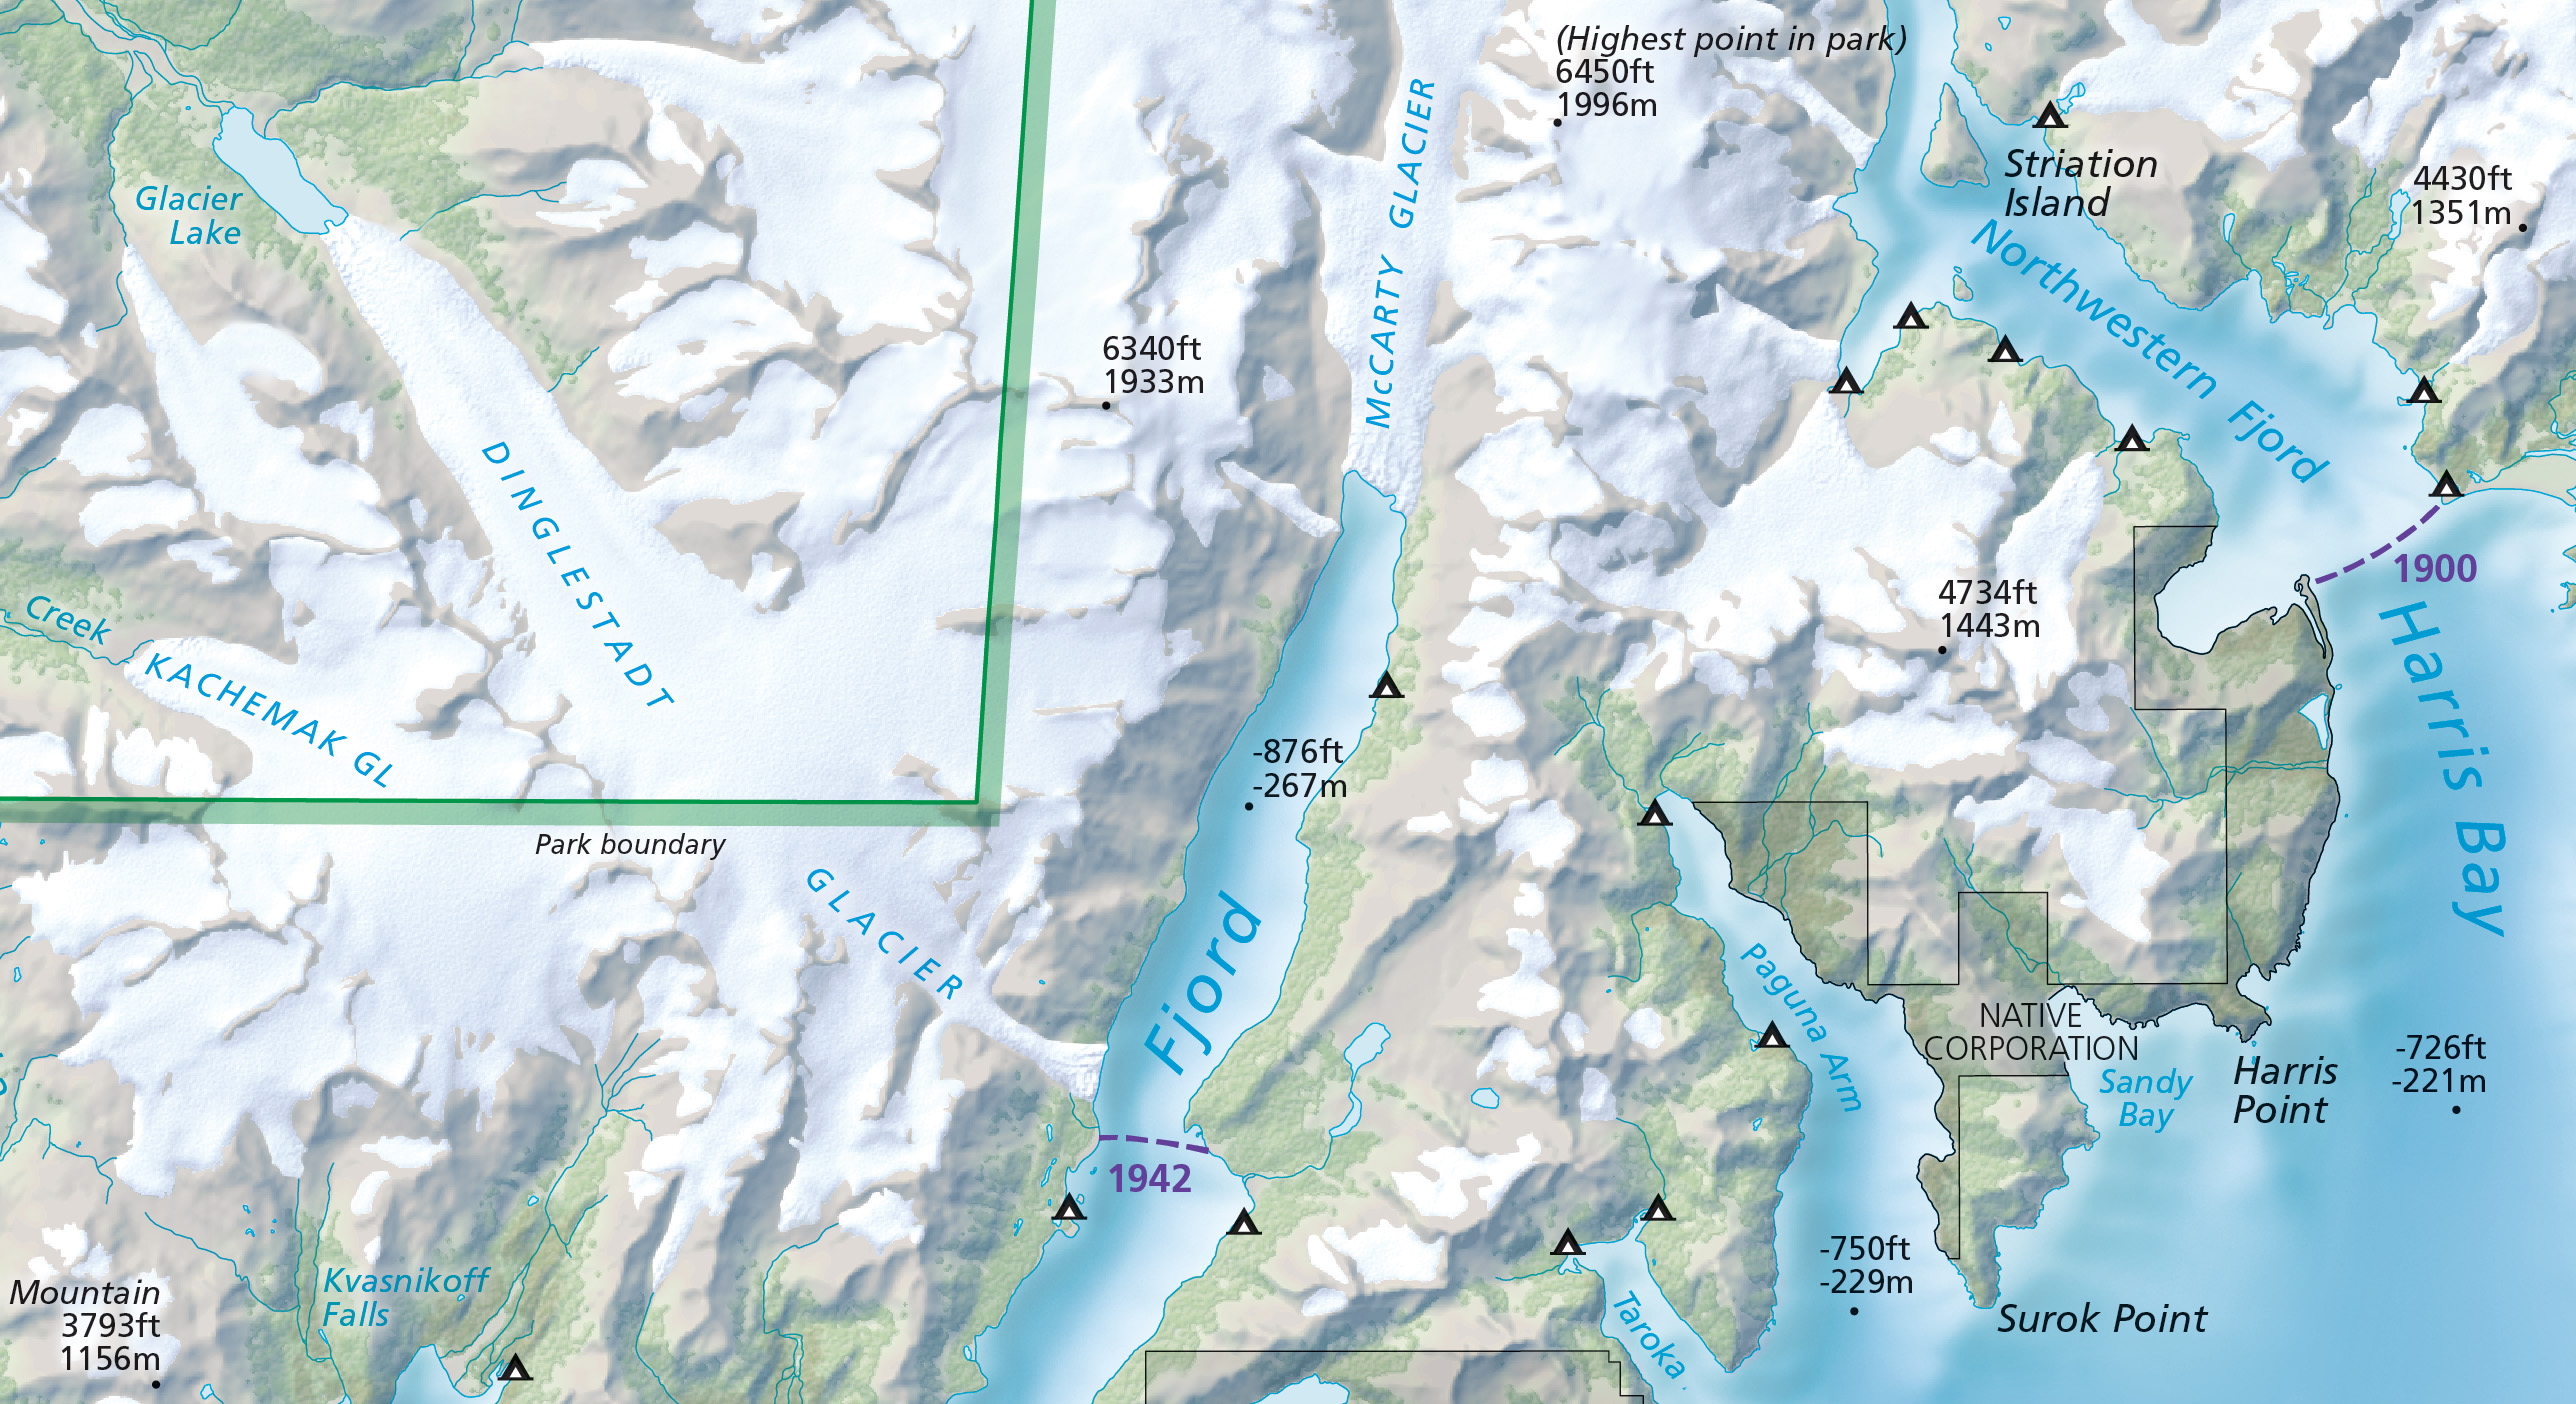
The process of making maps can vary greatly depending on the cartographer and the purpose of the map. Tom Patterson, one of the cartographers behind the public domain data set Natural Earth and the popular website Shaded Relief, regards cartography as a creative process. He sees geospatial data as an artist would see paint on their palette. “They are raw materials from which the map is made,” says Patterson. “For me, the map making process starts with an online scavenger hunt for geospatial data, and ends with a visual depiction of the results of that scavenger hunt, a map.”
Patterson recently retired after 26 years with the U.S. National Park Service at the Harpers Ferry Center, located in West Virginia. Harpers Ferry Center is the media hub for the U.S. National Park Service, where most of the maps, exhibits, and publications for public consumption are produced.
Patterson is well-known for making maps with beautiful shaded relief effects, a technique that he has focused on for his entire career. It’s something he has a passion for and is a feature that he believes makes his maps unique. “When making a shaded relief, I go to great pains to portray the natural world in a beautiful and idealized manner, by combining shaded relief with land cover data, drop shadows, gradients and vignettes, with control and restraint,” says Patterson. “I ultimately want to create a shaded relief that readers will find attractive and which will blend harmoniously with the vector elements above.” Patterson prefers light, luminous colours for depicting terrain, and also tell a story. “A map is more than just a combination of points, lines, polygons, type and pixels. To me, a really good map is one that becomes much more than the sum of these parts,” he says. “Maps are an important form of communication, and they should effectively share the ideas of the cartographer to the map reader.”
When making graphically creative maps, you want to use tools that provide you with the most control. With MAPublisher, you can easily access and manipulate geospatial data using Adobe software. “MAPublisher and Geographic Imager bridge the gulf between graphical and GIS worlds.”
Patterson was an early-adopter of MAPublisher, a plug-in for Adobe Illustrator after learning about it in 1996 at the annual North American Cartographic Information Society (NACIS) conference. If you’ve ever used the Natural Earth data, you might be interested to know that most of the vector elements were created with MAPublisher and Adobe Illustrator.
He was also integral in the development of Geographic Imager when during a presentation about manipulating Digital Raster Elevation Model (DEM) data he commented that having a MAPublisher-like software for Adobe Photoshop would be useful. “My suggestion was heard by the President of Avenza, Ted Florence, who was in the audience. He put me in touch with the software development team at Avenza to brainstorm ideas about a GIS plug-in for Adobe Photoshop. Geographic Imager was the eventual result of our discussions.”
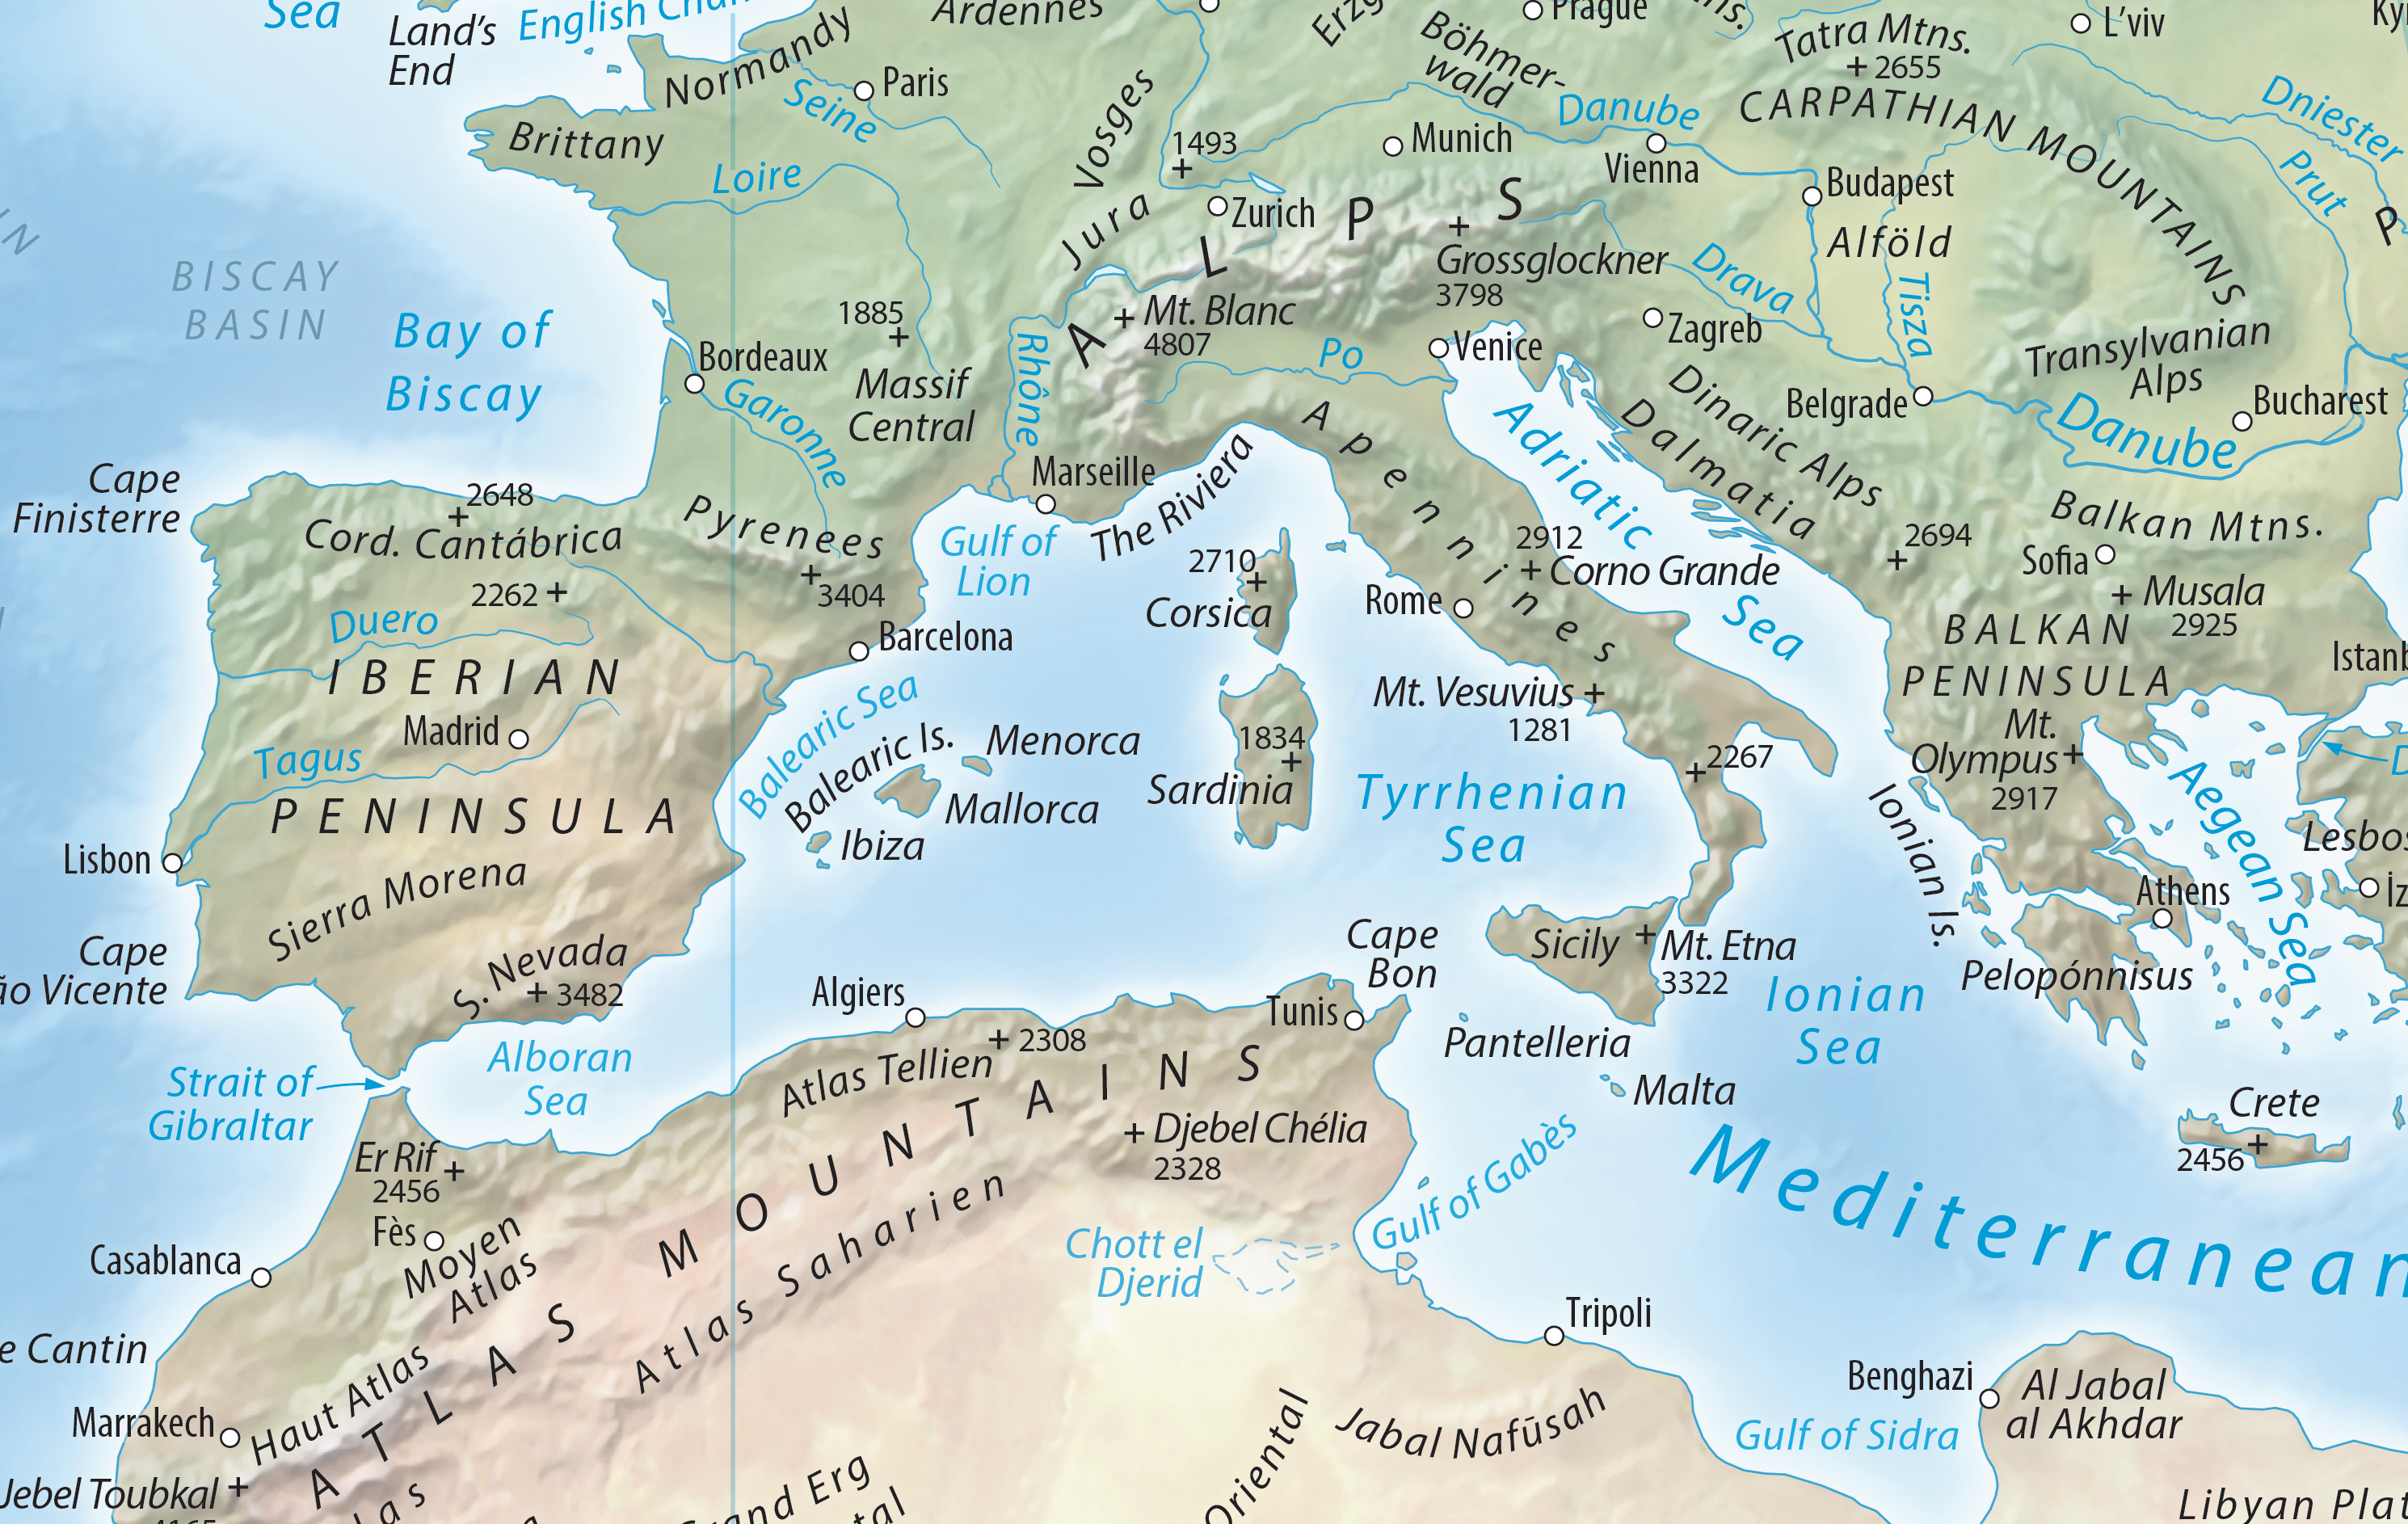
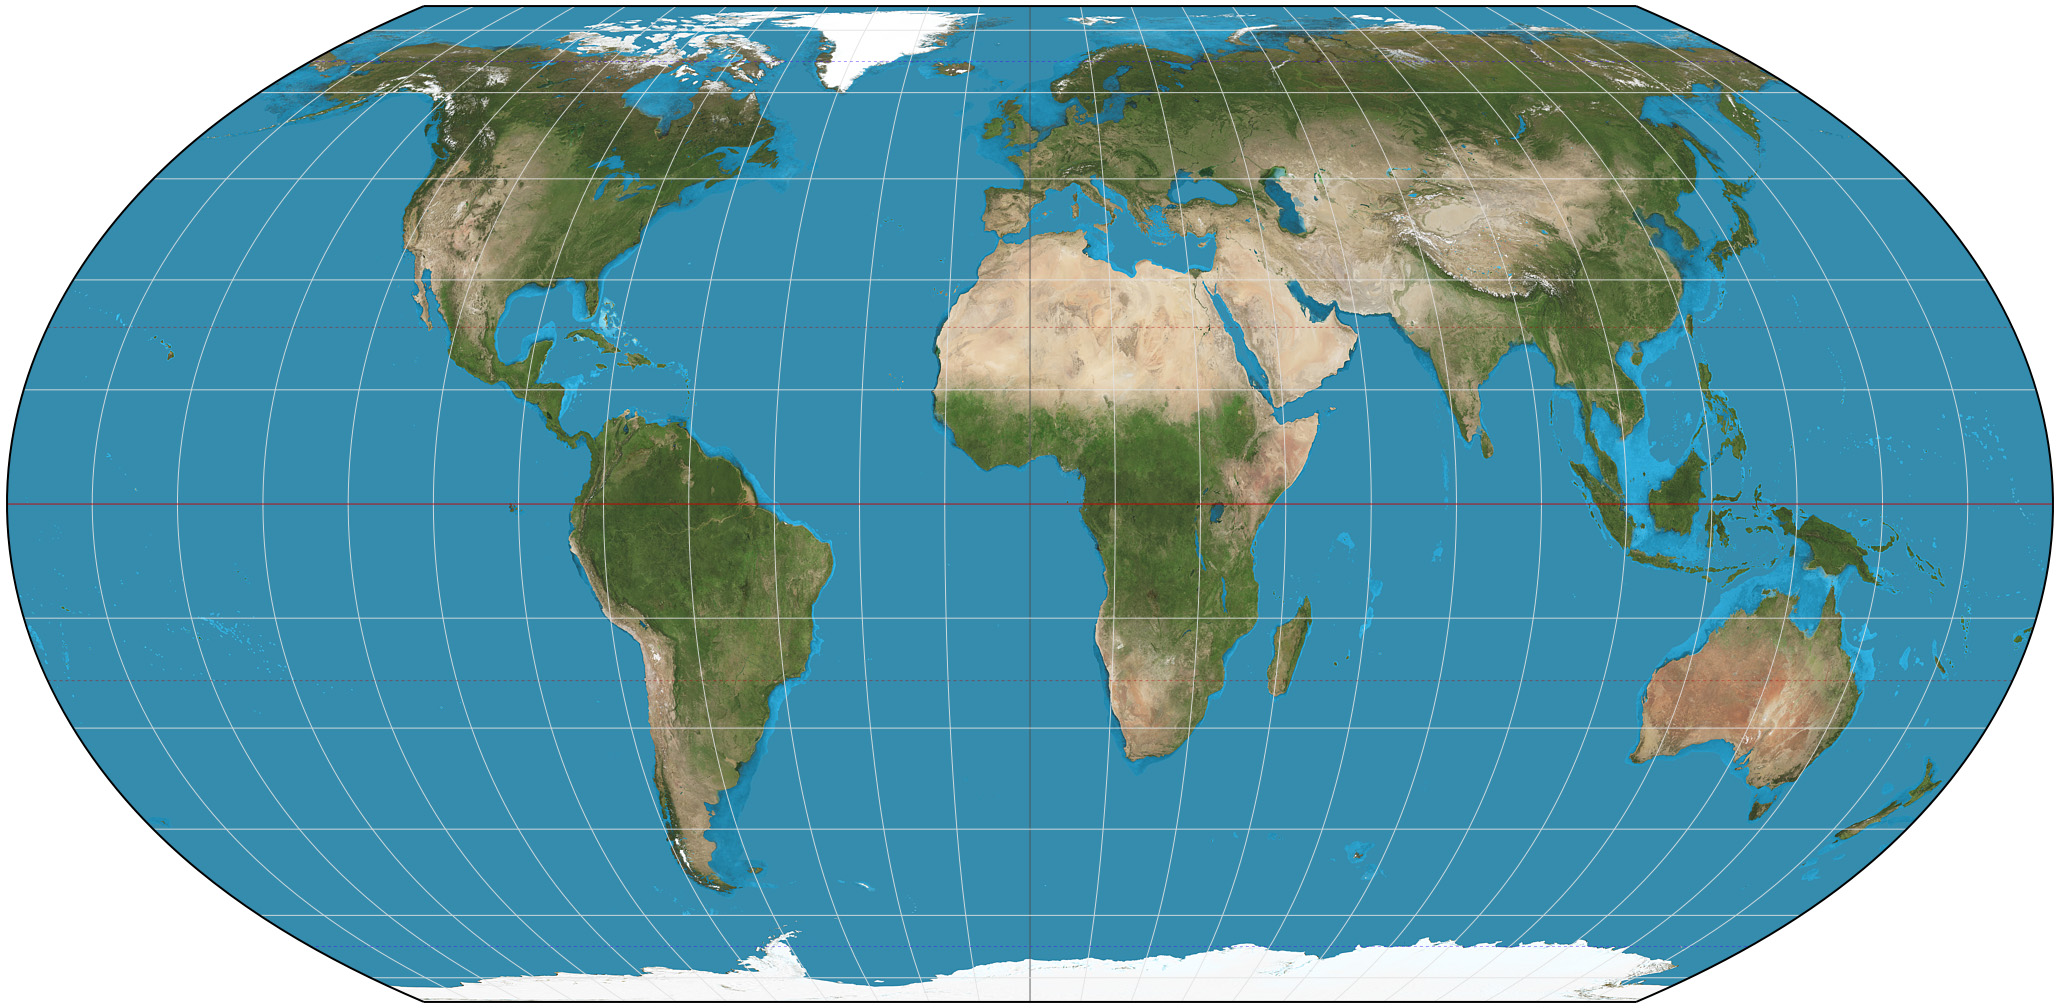
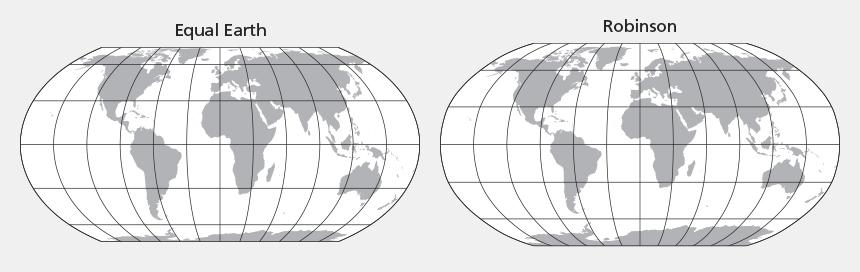
Along with his many contributions to the cartographic community, Patterson has held some important positions as the former president and current Executive Director of NACIS. Patterson has created accessible, open source data for global use (Natural Earth), he recently contributed to a new map projection that is taking the cartography and GIS world by storm; Equal Earth. “This equal-area pseudo-cylindrical projection has gained traction rapidly—it seems that cartographers and map users alike have had an unfilled need for world maps depicting countries at true size and presented in a pleasing manner,” he quips.
As an accomplished and respected veteran of the field, we asked that what advice Patterson would give to new cartographers, finding their way? “Seek out advice,” he states. “Map design and production is mostly a solitary task, and any map you create will seem easy-to-understand and logical to you since you are the one who made it. But, your readers may not see it that way,” says Patterson. “The easiest way to avoid these potential ‘failures to communicate’ is by showing drafts of your maps to people that are not family and close friends.”
Another tip that Patterson has for fledgeling cartographers, is to give readers a reason to slow down and read your map. “The trick in today’s media-saturated environment is to design a map that will catch your reader’s eye, ignite their curiosity, and draw them in. Give the most emphasis to the information you want them to remember long after they put down your map.”
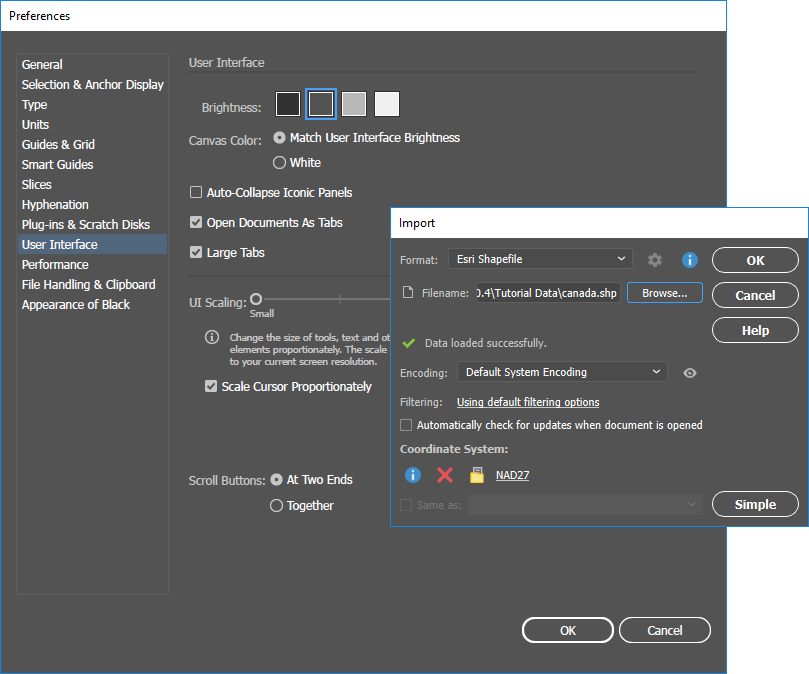
We released an update today, to MAPublisher, our well-known cartography plug-in for Adobe Illustrator. This version features support for the Equal Earth projection, has a new look and feel that more closely matches Adobe Illustrator’s interface and includes new options for importing geospatial data into Illustrator.
Equal Earth Projection
Our partners, Blue Marble Geographics, have added the Equal Earth Projection to their GeoCalc library, the system that we use for data reprojection and coordinate transformations. This projection is now available in MAPublisher 10.4.
Want an Equal Earth map to experiment with? You can download MAPublisher-enabled Adobe Illustrator files at equal-earth.com
Crop to Artboard
In MAPublisher 10.4, when a matching MAP View is found while using the Import or Copy MAP Objects From tools, you can now choose to crop the added data to an artboard’s extents. This same functionality is available when specifying the destination MAP View in Multiple Data Import. Furthermore, if you don’t want to add data to the existing MAP View, you now have the option to specify which artboard the incoming data will be added to.
New Look
We’ve changed the look of the MAPublisher tools and dialogs to match the colours, fonts, and styles of the Adobe Illustrator interface. So as you use the MAPublisher tools, it feels more like you are still using Illustrator – which of course, you are! The MAPublisher tool and dialog styles will also change to match any changes in the Illustrator interface preferences. Note that the interface changes only apply to Adobe Creative Cloud versions of Illustrator, not CS6.
MAPublisher 10.4 Release Notes
Support for Equal Earth projection
New options available to auto-crop data when importing or copying MAP objects
Enhanced user interface matching Adobe Illustrator interface preferences
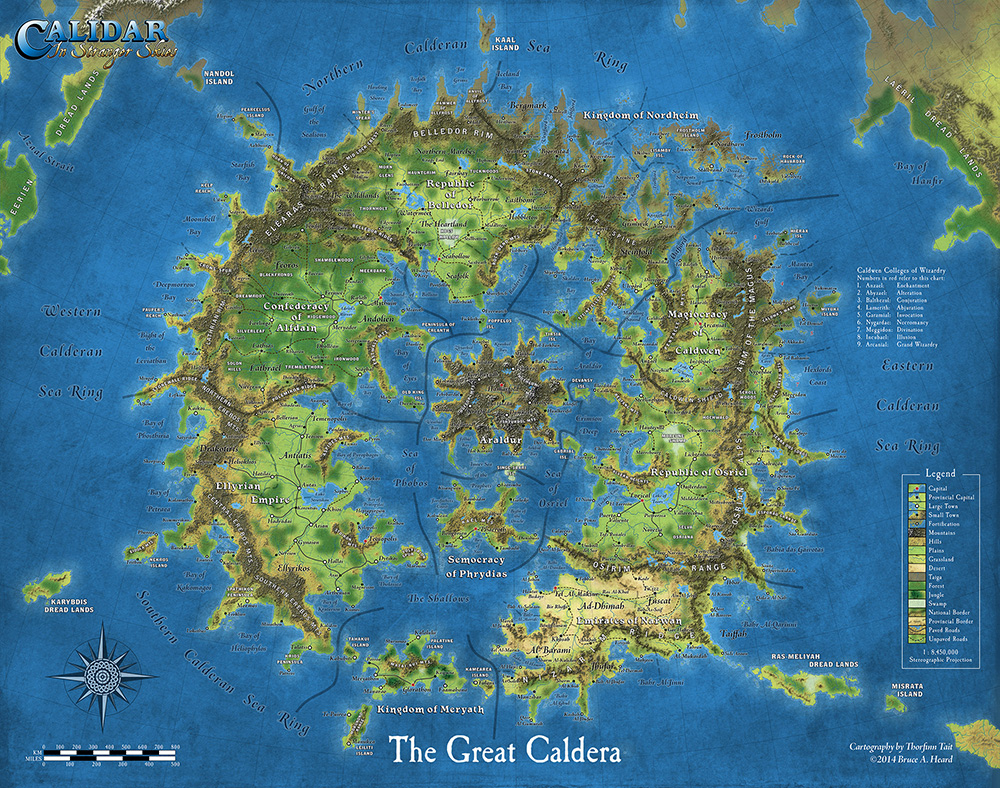
A teacher by day and a cartographer by night, Thorfinn Tait (a native of Scotland) has been teaching high school in Japan for almost 20 years while making maps of fantasy lands in his spare time.
Mapping is a hobby for Tait, and his deep love of atlases, along with fantasy role-playing games (known as RPGs), helped drive him towards creating his own maps of fantasy worlds. He started in 2005, making maps in Adobe Illustrator. His goal was to create an atlas of a fantasy world, that included the same variety of maps that you’d find in any traditional world atlas — topographical, political, thematic — along with all the tables of data typically found in an atlas. He chose to map the world of Mystara, a popular Dungeons & Dragons (D&D) campaign setting from the 80s and 90s.
Tait set out to compile all of the original maps of Mystara (more than 250 of them) into a cohesive whole. “One of my biggest struggles was trying to work out what projection Mystara’s maps used. But there was a fundamental disconnect for me in that Illustrator alone did not have the functions I needed,” says Tait. “For example, to change the projection of a map, I tried to use it in tandem with other GIS software, but it was very troublesome having to constantly import and export elements between programs.”
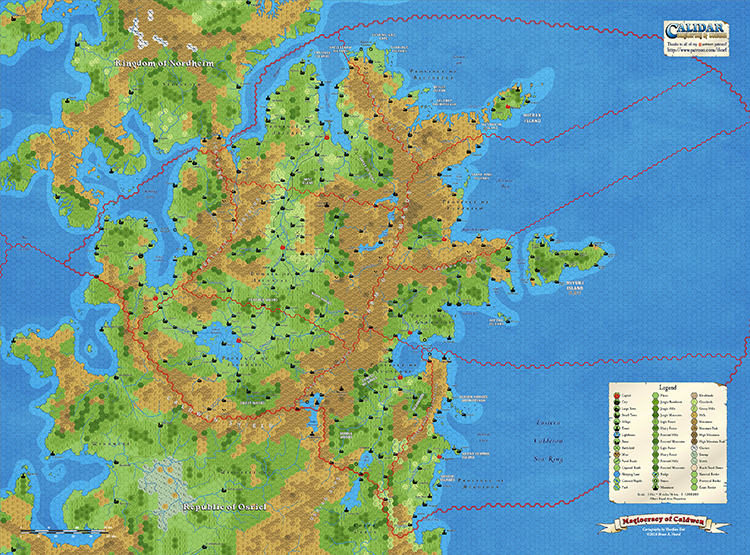
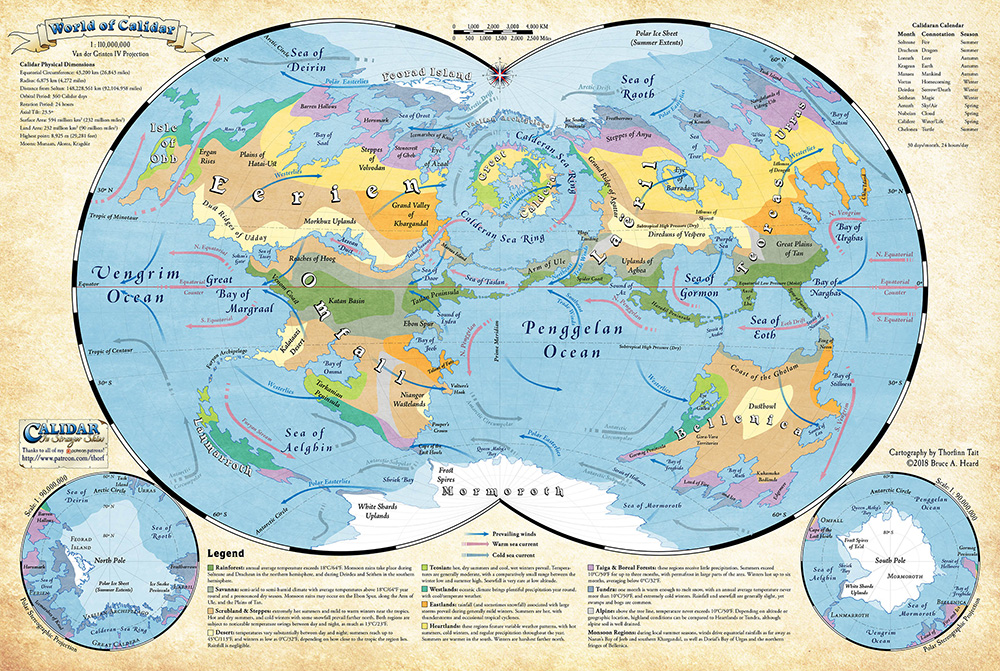
While working on the Atlas of Mystara project, an original Mystara author made a return to the industry, and Tait volunteered to remake his maps in Illustrator. The year after, that same author commissioned Tait to map a new RPG world, the World of Calidar. Determined to avoid the same problems he’d encountered with Mystara, he began establishing dimensions of the new world and creating custom projections based on them. But, working between Adobe Illustrator, Adobe Photoshop and GIS software was still very complicated.
“I managed to complete the first assignment with just those tools, but as soon as I got my first commission, I invested it right back into my maps by purchasing MAPublisher and Geographic Imager.” With MAPublisher, a plug-in for Adobe Illustrator and Geographic Imager, a plug-in for Adobe Photoshop, Tait could work natively in both Illustrator and Photoshop.
“My favourite aspect of MAPublisher is without a doubt the custom coordinate system. It allows me to create resources for fantasy worlds just like they already exist for the real world, and then repurpose them across all of my maps,” says Tait. He also uses MAP Attributes and adds data to the world’s geography. “For example, it’s easy for me to track things like road and river lengths, land areas, dimensions of coastlines and political borders, and so on — MAPublisher calculates all of these things for me automatically.”
MAPublisher has allowed Tait to take his previous work and convert it to the newly established custom coordinate systems, without losing any of the GIS attributes he’d created over previous years. Tait also uses Geographic Imager to create Digital Elevation Models (DEMs) for the World of Calidar. DEMs can help bring maps to life, adding an intricate level of detail and depth.
Tait’s tagline for his freelance business is “Mapping fantastic worlds with real-world accuracy”. “I couldn’t do this without MAPublisher and Geographic Imager,” he says. “The software allows me to create and work with data for a fantasy world just like other people map the real world, the only difference is that I am creating all the data myself!”
“MAPublisher has truly expanded my horizons as a cartographer and has also changed the course of my projects. Without it, my current work would simply not be practical — in fact, probably not possible at all.”
Tait is currently working on georeferencing existing Mystara maps and tagging elements with their original sources. Check out more of his mapping projects on his website!
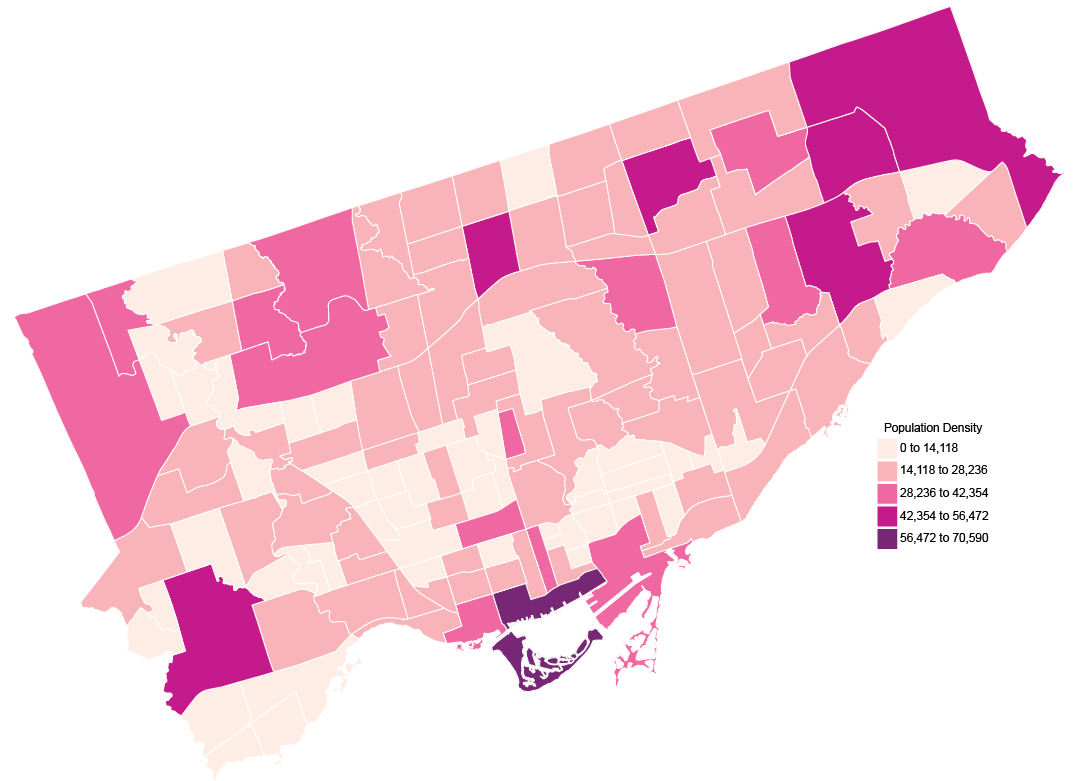
We all love a good choropleth map, but sometimes we need our map to display more than just different shades of colour to communicate more detailed information. MAP Chart Themes are the perfect way to distribute that extra bit of information that you want your readers to know. You can display the data in a bar chart format, or pie chart format. There’s even the option to have the charts change scale according to the data.
Say you have a map showing the population density of Toronto, like this map below.
But, while this shows just the density of the population, you want to go more in-depth. For example, you want to look at all the ethnic origins of the residents of each neighbourhood. This is the perfect opportunity to use MAP Chart Themes.
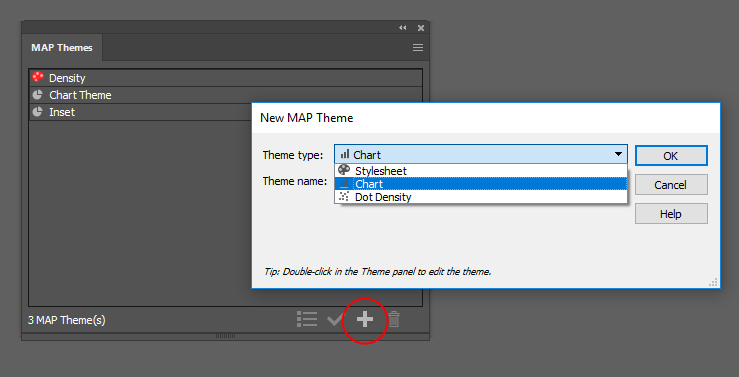
To create a MAP Chart Theme, open the MAP Themes panel (Window > MAPublisher > MAPThemes) and click the + button to create a new Theme. Then choose Chart as the Theme type.
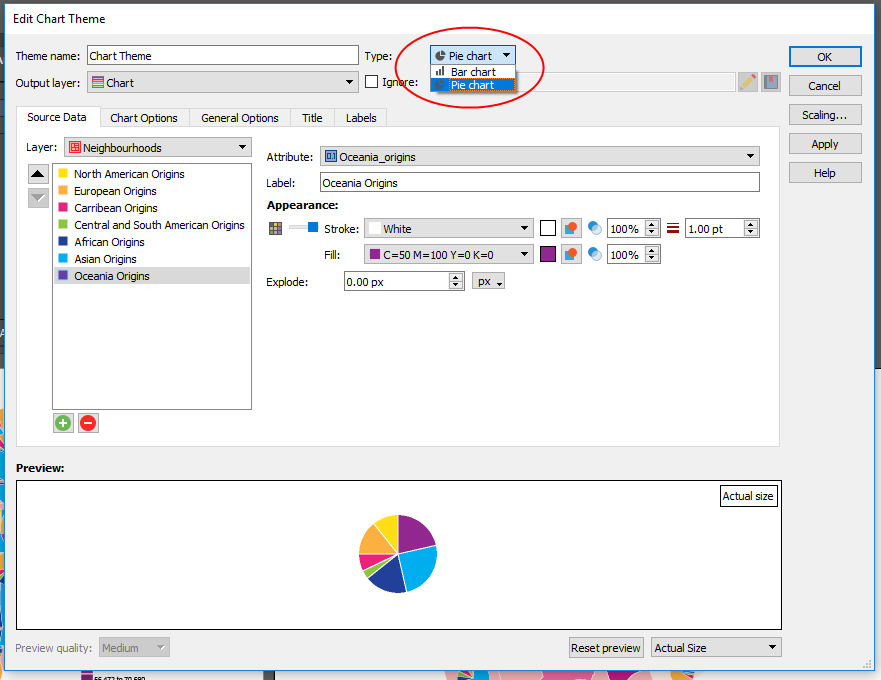
Once you’ve created your theme, now you can get to making your charts! You can use either bar charts or pie charts, choose whichever will show your data best. To show the variety of ethnic origins for the neighbourhoods in Toronto, I chose a pie chart.
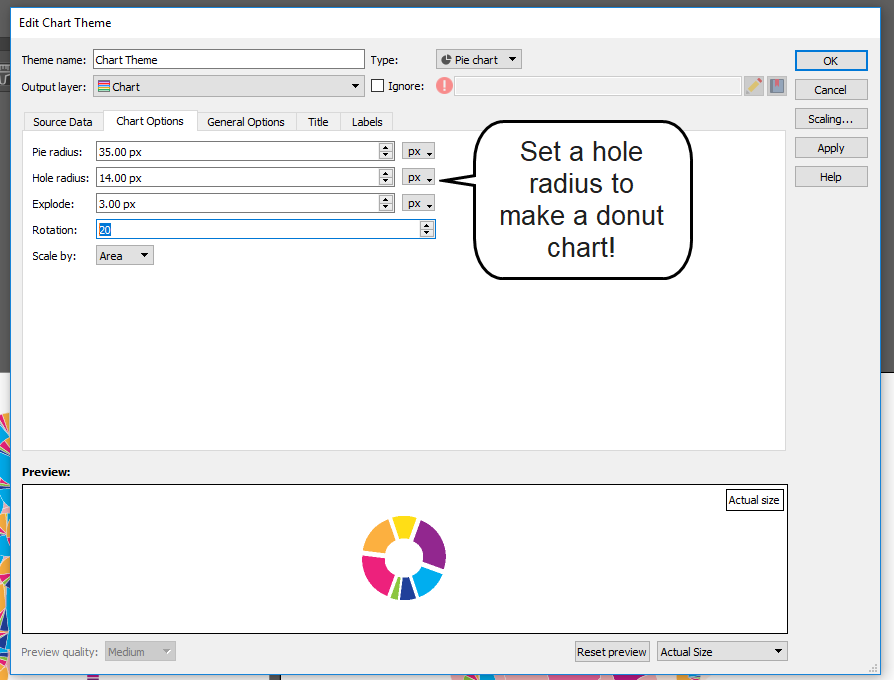
Select a layer, then click the Add Attribute button (the green plus icon) to add your attributes. Select the attribute you want to include in the chart, and style it as you see fit. The preview at the bottom will update as you make changes to the components of your chart. There are options to change the size of the chart, and even turn it into a donut chart!
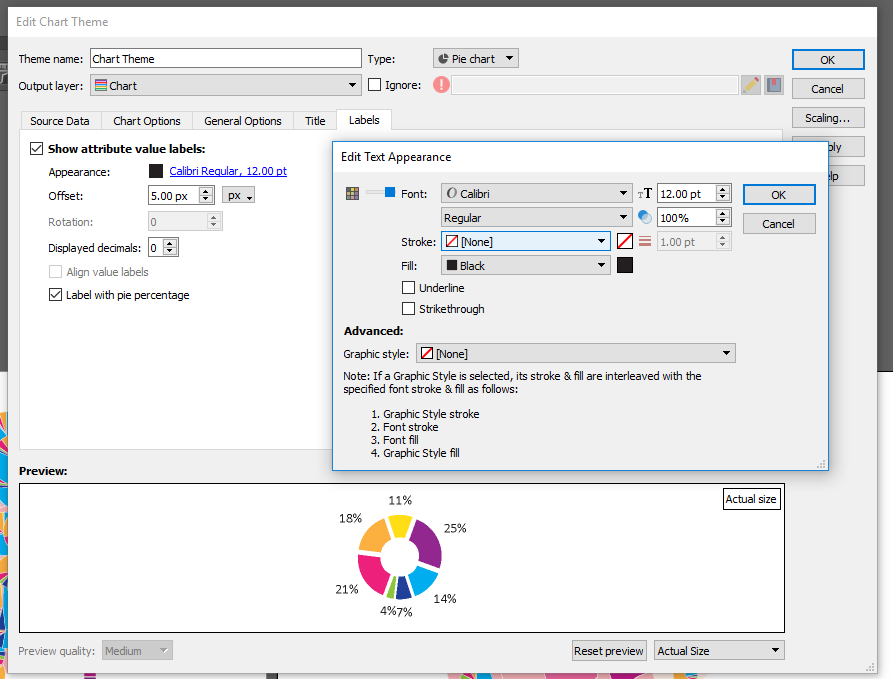
If you want to include a title for your charts you can, but because my map contains so many charts in a relatively small area, I chose not too. Labels for the sections of the charts can also be added as well. Edit the test if necessary, and even label your pie charts with percentages if that helps to better communicate your data.
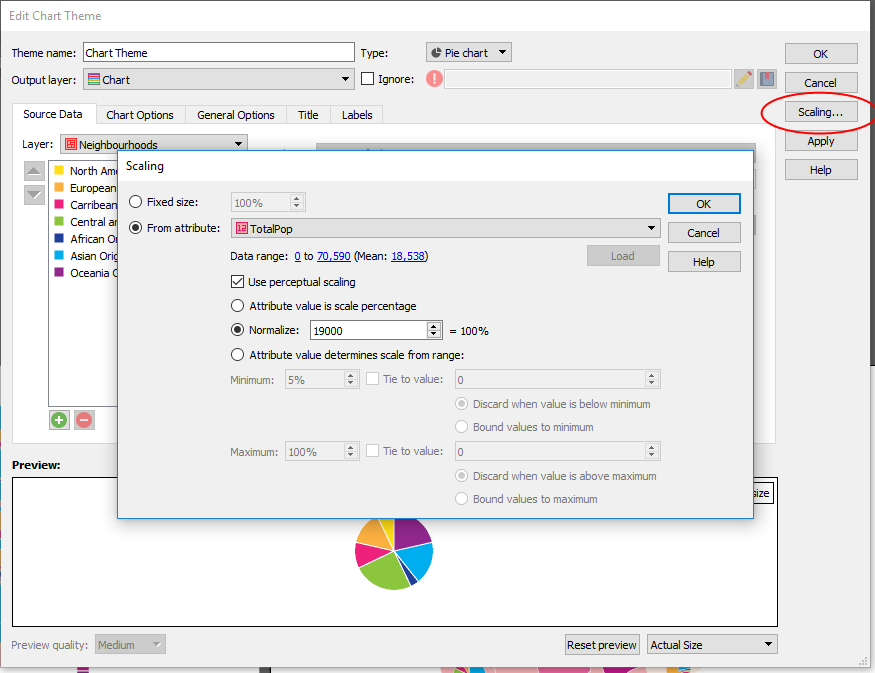
My favourite feature is the Scaling option (button is on the right). This allows you to automatically scale the size of your charts based on attributes. You can set the scale by defining the value that represents 100%, then select an attribute, click Load and watch the magic happen. This feature is super handy especially if you’re creating a map with tight boundaries or not a lot of extra space because you can easily adjust the size of all charts at the same time.
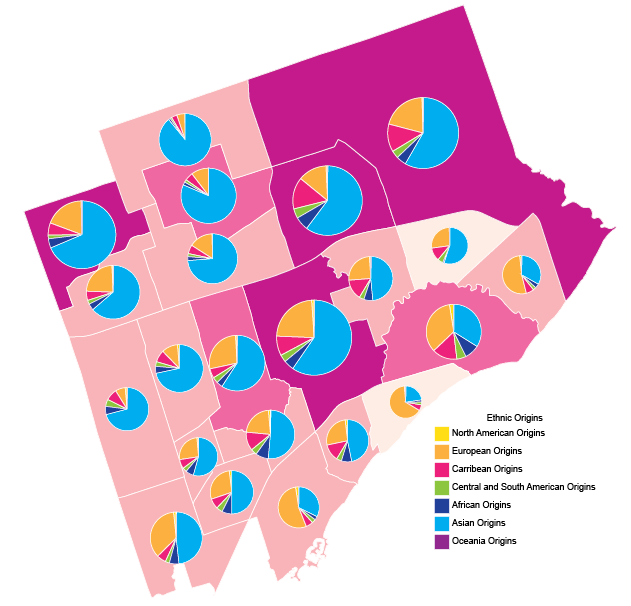
Back to my example map, I set the scaling and applied the MAP Chart Theme. Since there are 140 neighbourhoods in Toronto, I chose an inset of the larger map to show how the scaling appears. You’ll see neighbourhoods with a higher population have a larger pie chart, while neighbourhoods with a lower population have a smaller chart.
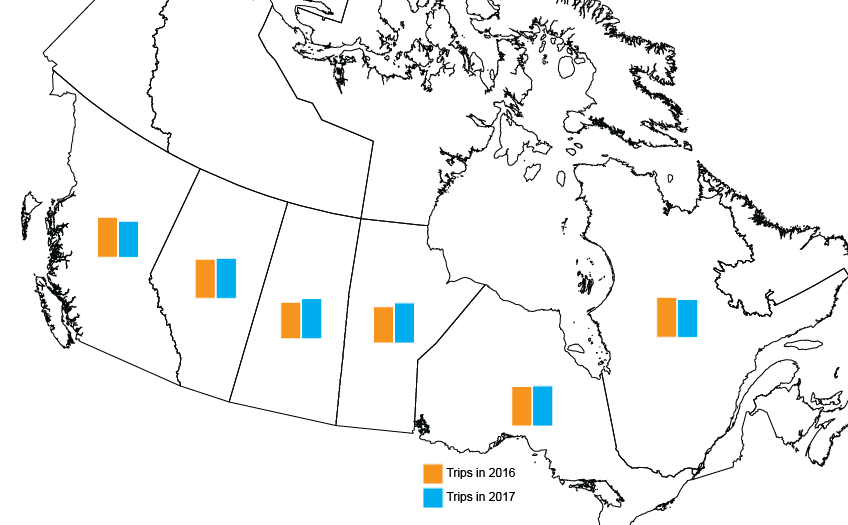
The scaling feature works for bar charts as well. I created another map with data showing the total number of inter-province visits for each Canadian province in 2016 vs 2017. In this case, I chose not to change the scale of the charts (by total number of visits per province) so it’s easier to see the comparison.
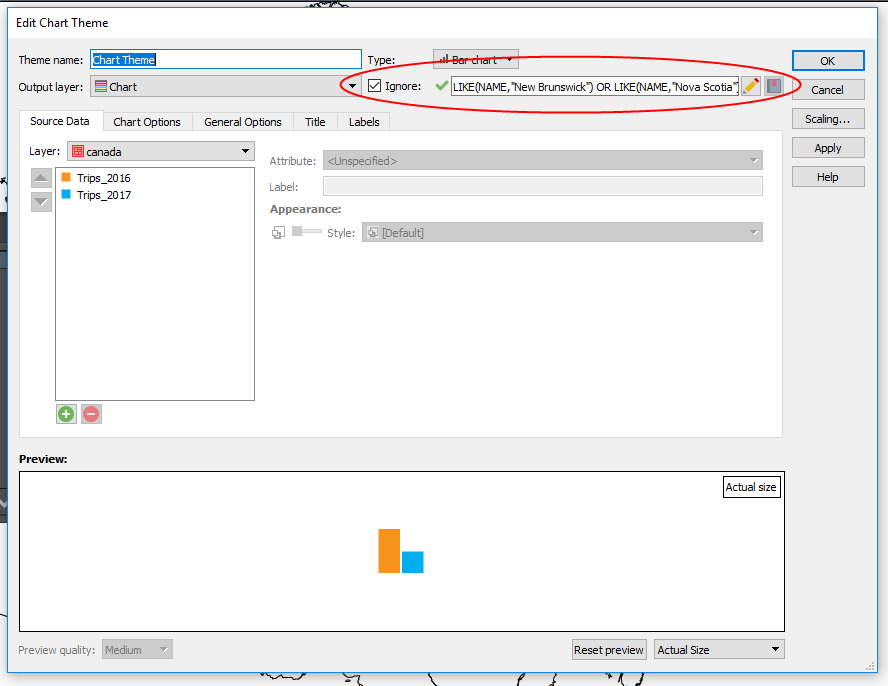
If you’ve made it this far in the post, and have eagle-eyes you’ll notice that there are no charts for the Territories or the Maritime provinces. Since I only wanted to visualize the data for some of the provinces, I used the Ignore option in the MAP Chart Themes box. It’s handy when you want to exclude certain data, for any reason.
There you have it! An easy way to visualize that extra data that your readers want to know, and you want to share without making your map overly complicated. Looking for more details on Chart Themes? Find it in the MAPublisher Documentation available on our website.
We are always looking for shortcuts to make work easier for our MAPublisher users. One way to simplify your workflow is by automating some of the routine tasks that are required to make maps using MAPublisher in Adobe Illustrator. Not everyone is familiar with software automation, or even knows that it’s available in MAPublisher but if you are curious to learn more, then keep reading!
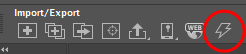
Automation tools in MAPublisher help to make simple or repetitive tasks easier and faster. Automation can be run independently or in conjunction with the FME Auto MAPublisher Plug-in which allows more advanced automation. The Automation tool can be accessed from the automation button (lightning bolt) on the MAPublisher toolbar, or by clicking in the menu Object > MAPublisher > Automation.
There are several automation options available in MAPublisher. You can use automation to create MAP Grids, apply labels, apply applicable MAP Stylesheets, and even export to geospatial PDFs. An important point to note, to use automation on a MAPublisher document, the document must be active in Illustrator.
Automating Map Views
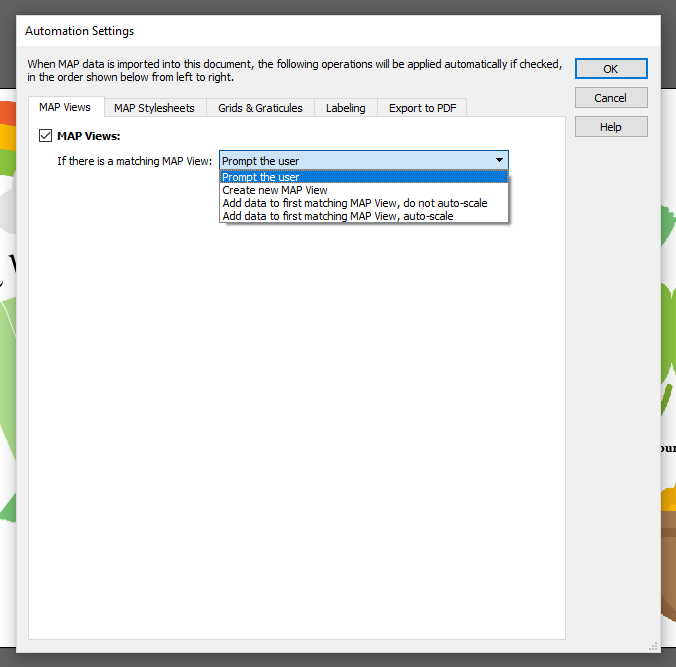
If you’re planning to use automation, you’ll have to enable the specific options you would like to automate. For example, to import data to a matching MAP View, simply enable the MAP Views option, and select from the dropdown list the tasks that you want MAPublisher to complete. Make sure that the coordinate system of data being imported matches a coordinate system of the existing MAP View, then select one of the four actions for your data.
Automating MAP Themes
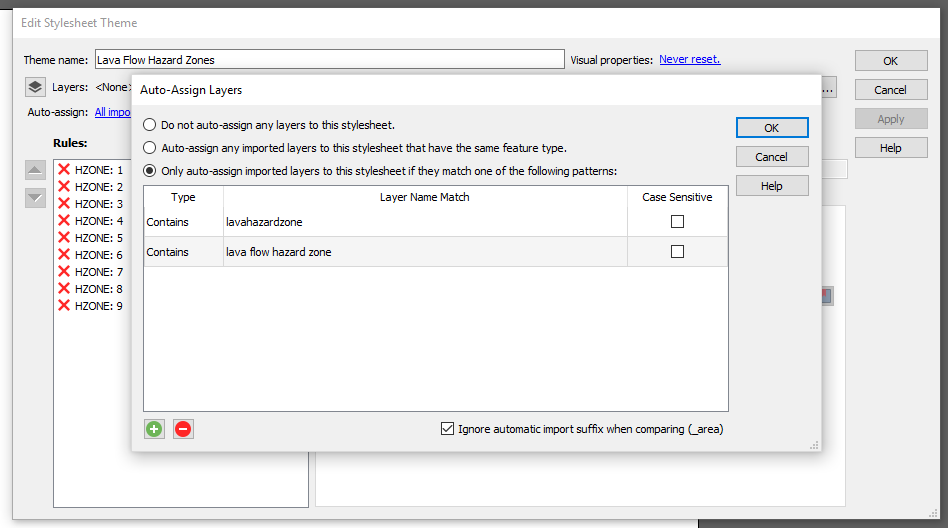
If you’re a fan of MAP Stylesheets (we all know they make our lives easier) then you can have MAPublisher apply them using automation. Enable the option and MAPublisher will apply any MAP Themes that meet the criteria to the imported data. Don’t forget to set the ‘Auto-assign’ in the specific MAP Stylesheets themselves as well since you can’t link layers that haven’t been imported yet. If the ‘Auto-assign’ properties aren’t set correctly, your data will import but the stylesheet will not be applied.
Automating Grids & Graticules
For Grids & Graticules, you can set the extents for the grid bounds with either the MAP View or a layer that you’re going to import. If you’ve already created configuration files for your grid, then select either ‘All configuration files in this folder’ or ‘Only these configuration files’ if there is a need to use only certain configuration files.
Automating Labeling
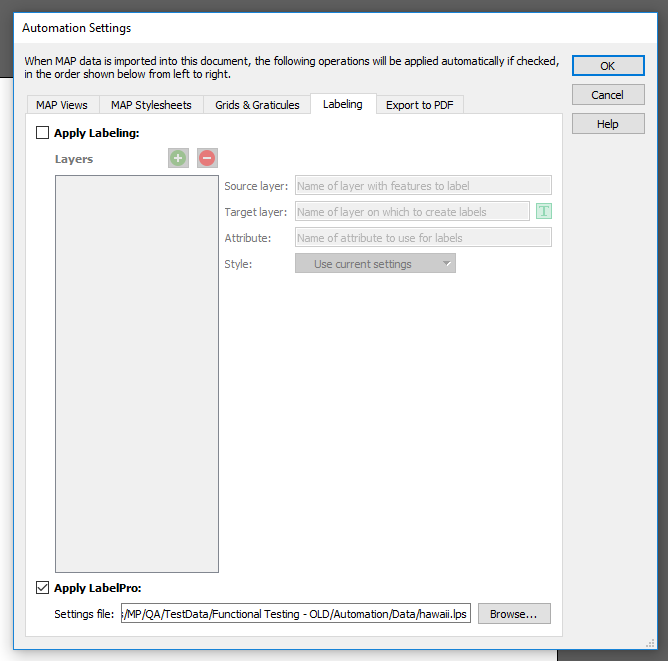
When you enable labeling, choose either MAPublisher labeling or LabelPro. You’ll also have to choose a specific setting in the MAPublisher Preferences (Edit > MAPublisher Preferences > Import MAP Data). Uncheck ‘Append feature type as the suffix on imported layer names’ to be sure that your labels import properly.
To use the regular Label Features option, set the details such as the source layer, target layer, attribute, and the style. You can add as many layers as you need with the Add Layers button on the left, and remove as necessary. If you’re using LabelPro, simply load the .lps file.
Automating Export to Geospatial PDF
Last but not least, if need your document to be exported to a geospatial PDF as the last step of the automation process, enable the option and specify the location you’d like it saved in. Once you’ve selected all of your automation settings, import your data to watch your automation work!
Enabling automation in MAPublisher can speed up your map making process, and make your workflow easier. Save yourself extra steps when working with stylesheets and grids you’ve already created, and let automation do the work for you. Simple MAPublisher magic!
Last year we wrote a blog post about some of our team’s favourite MAPublisher features. Not surprisingly for software that has been around for over 20 years, everyone had a different favourite and we had to be selective for the blog post. This year, with new team members coming on board and new MAPublisher releases it’s a good time for a new list of favourites. Check out some of these features that you might not know about, and find out how they can make your workflow easier!
Create Elevation Plot
Jeff C. – Quality Assurance
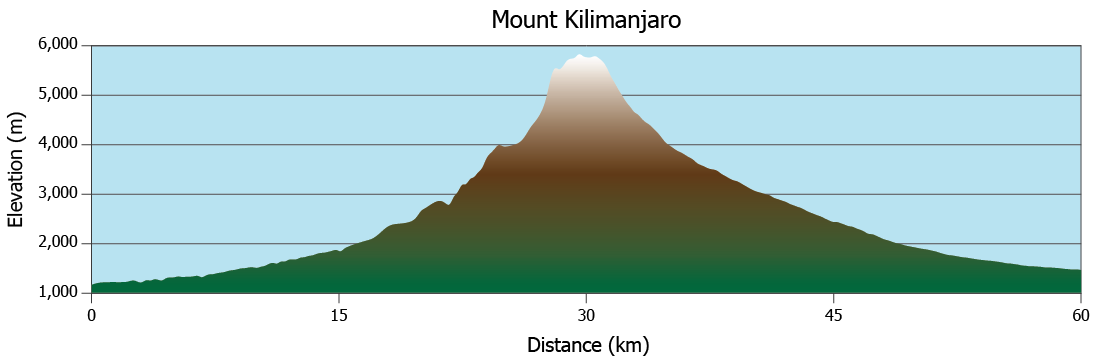
Prior to MAPublisher 10.3, “Create Elevation Plot” was a feature of Path Utilities I seldom used because, to be honest, it had a few limitations. MAPublisher 10.3 introduced a completely new way of creating elevation profiles, and the difference is astounding. The available customization options are endless – not only can you select whether your axes will use metric or imperial units, but you can also set the Line Colour, Line Width, Fill Colour, Background Colour, Axis Intervals, Axis Labels, Graph Size and much more. Another aspect of this updated tool that I love is the ability to save and re-use ‘styles’. These styles remember specific elements of an elevation profile (e.g. appearance, units, size, etc.) and can be applied to other profiles made in the future, saving the user a lot of time.
Text Utilities
Keith S.- Quality Assurance
In my opinion, the Text Utilities tool is one that is underutilized in MAPublisher. The tool allows you to perform actions on text within a document, including Curve Text to Latitude, Draw Shape Around Text, Merge Text, Create Line From Text on a Path, and many more. The actions can be performed on selected text only, text on specific layers, or all text in the document. The tool even allows the user to preview most actions before committing the changes.
If you have ever seen text along a path with a red plus symbol at the end of it after performing a transformation or manual adjustment it is an indication that the text path is not long enough to contain all of the text. No problem for my favourite action in the Text Utilities tool—Extend Overflowing Text. This utility solves the issue by extending the text path to a length which will accommodate the full length of the text.
Join Lines
Oliver N. – Customer Support
One of my favourite tools to use in MAPublisher is the Join Lines tool. If you are working with a road or rail network and sections of the same track or street connect to each other but are broken into different line features, you can easily join them into single features with a common attribute like Street Name or Track Number. You can target a line layer and then in the Destination options, choose either to perform the join on the original target layer or specify a name for a new line layer that will contain the joined lines. You can also use a proximity value to determine how close the lines must be in order to be joined. I find that this tool allows subsequent styling to be done easily and saves a lot of time in arranging the data to your needs. It also reduces the size of your file by compiling data into fewer features.
Copy MAP Objects From
Keith S. – Quality Assurance
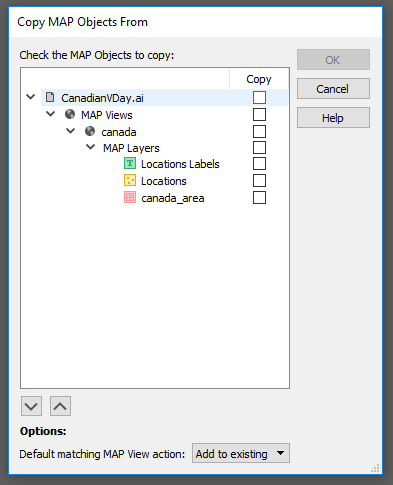
This feature allows users to copy MAP objects (including MAP Views, MAP Layers, MAP Themes, MAP Selections, and MAP Locations) from one open document to another. MAP Views can be copied by themselves or with their associated MAP Layers. The best part is, that any artwork which is copied to the destination document will retain its styling provided that the custom colour swatches used in copied artwork are set as “Global” in the Adobe Swatch Options dialog. It works like this: With the destination document open, launch the Copy MAP Object From tool. Select the object(s) you want to copy to the destination document by checking the checkbox beside each object, then click “OK” to perform the copy. Copy MAP Objects From is one of my favourite features because it saves so much time when styling maps!
MAP Themes Scaling Charts
Bob P. – Business Development Associate
My favourite way of making infographic maps is using our MAP Chart themes. Within Chart Themes, you can add a bar or pie chart to any point layer, based on any set of attributes from the point layer. For an added level of information, each of the charts can be scaled based on the value from another attribute. This helps when you want to show the proportion of values, but also give an indication of the total population size for each point too. The best part is MAPublisher allows you to pick between Area and Radial scaling for pie charts. If the population of one point is twice the size of the smallest point, it can either have twice the area, or twice the radius length. This is my favourite tool in MAPublisher, because it shows that our team thinks of everything to make sure cartographers can make the exact map they want, right down to the smallest details.
About the Authors
Jeff, Keith, Bob and Oliver are all members of the Avenza Systems Team and their passion for maps shows through in the work that they do with our clients and in developing MAPublisher.
Happy Valentine’s Day! What better way to celebrate than with new maps (and creating infographics) about love? This year we’ve hunted for romantic data for Canada and the United States and visualized it all for you using MAPublisher 10.3 and Adobe Illustrator.
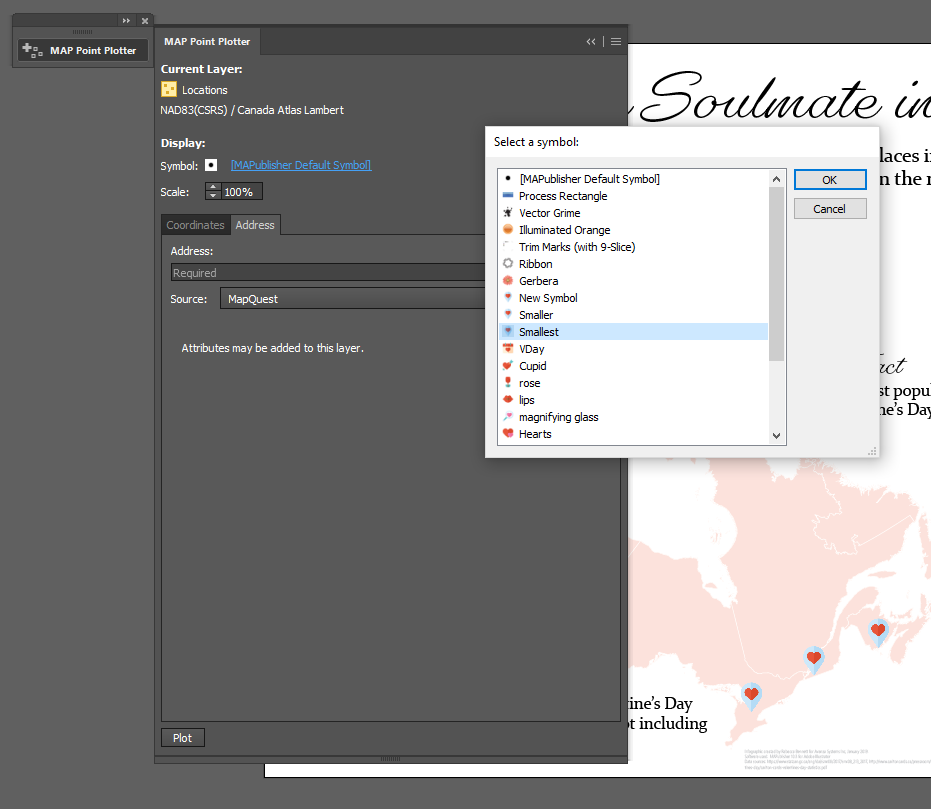
The first map shows all the most romantic locations (at least as their names suggest) in Canada. This information was provided by Stats Canada. Using the MAPublisher Point Plotter, it was easy to plot all of the locations!
The best part about using the Point Plotter is you can choose any symbol available in your symbol library to mark the points. I chose the symbol that I wanted (a Valentine’s map marker–how adorable!) and then plotted each location simply by using the town’s name and province.
After adding some text and symbols in keeping with the theme, the map was ready to go! You can check out the PDF below, or, you can download the georeferenced version from the Avenza Map Store, for use in the Avenza Maps app.
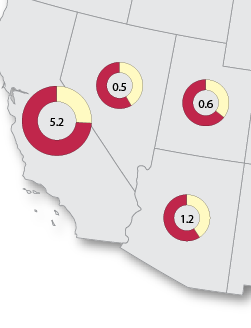
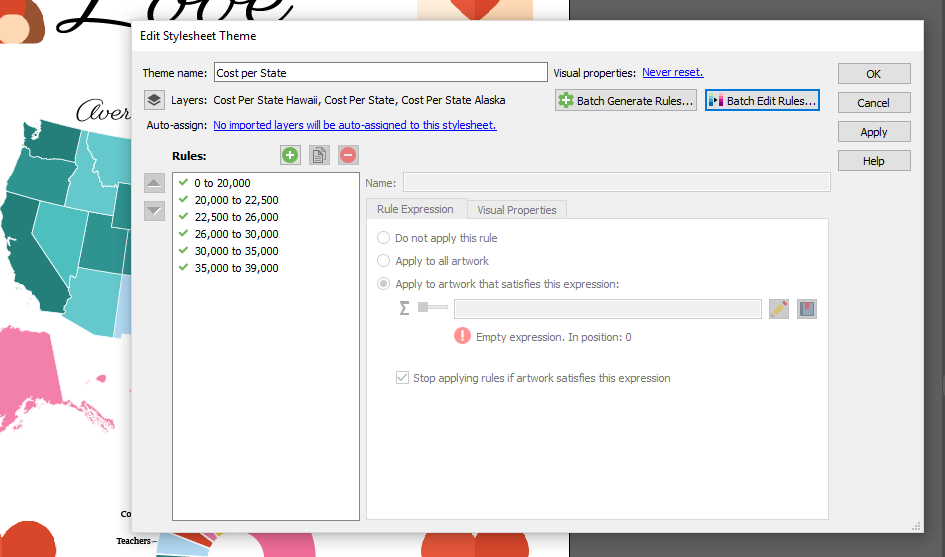
Moving on to my infographic – which is a popular and engaging way to illustrate statistics and small amounts of data that might otherwise be overlooked. I found data from the United States covering a variety of Valentine’s Day topics. The plan is for my infographic to include two maps and two additional charts. The first map illustrates the average wedding cost by state, and the second map shows popular proposal locations.
For the average wedding cost per state map, I used a MAP Theme to colour all the states appropriately (and quickly!). The benefit of using a MAP Theme is that you can apply a theme to multiple layers at once. Since Hawaii and Alaska were projected separately from the mainland of the United States, they exist in different layers on the artboard. Using a MAP Theme made it easy to include them in the colour scheme of the map.
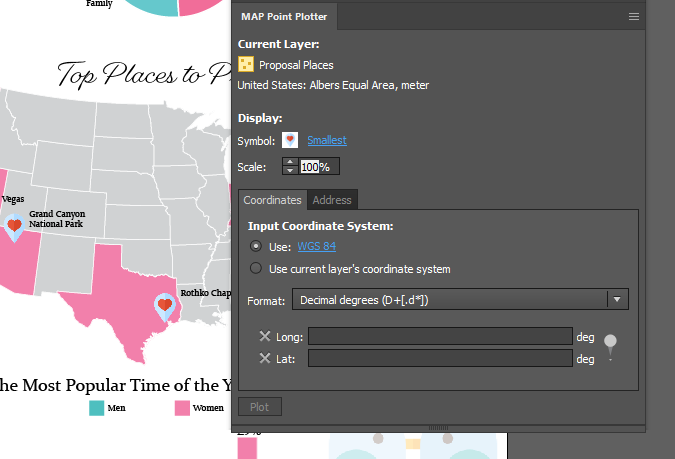
On the second map, I want to map the most popular proposal locations in the country. I used the MAP Point Plotter tool again, but, this time, I used the latitude and longitude to plot the points because some of the locations could not be plotted by name alone. It’s very beneficial to be able to swap between the two options!
My maps are complete, and after adding two graphs (made using the graphing tools in Illustrator) containing even more fun Valentine’s day data, and some love-ly symbols, the entire infographic was finished. You can check out the completed infographic below!
About the Author
Rebecca Bennett is a member of the Marketing Team at Avenza Systems and loves making creative and visually appealing maps.