My Account     Contact Us     Cart

Articles

Cartographer Chronicles: Steve Spindler

Cartographer Chronicles Steve Spindler Banner

Steve Spindler has cultivated a passion for cartography that has continued for more than 25 years. He operates Steve Spindler Cartography, which develops custom-designed cartographic pieces that can be seen in map products utilized by governments, city planning organizations, and nonprofits from across the country. He also manages wikimapping.com, a public engagement tool that allows city planners to connect and receive input from their community using digital maps. A passionate cartographer at heart, Steve considers map-making both a hobby and career. He strives to share his ideas, techniques, and truly captivating cartographic style with others, either through his previous teaching at Temple University or through his tutorials hosted on his personal website cartographyclass.com

Steve first began designing maps in the early 1990’s while at Temple University for graduate school. Pursuing a Master’s degree in Urban Studies, Steve found that the cartography lab at Temple was his favourite place to be. Before the widespread accessibility of digital maps, Steve recalls spending time at the Philadelphia Library, exploring map catalogues and manually tracing topographic maps before faxing them to his own computer. Later into his graduate studies, Steve joined a mailing list for digital cartography enthusiasts, and this is where he first learned about Avenza and MAPublisher for Adobe Illustrator. He quickly adopted the software into his map-making process, leveraging its suite of cartography tools to easily create maps within a design-focused environment. He continues to use MAPublisher for much of his work, and some examples, such as the Northeastern Pennsylvania trail system map shown below, are even available digitally on the Avenza Map Store for use in the Avenza Maps app.
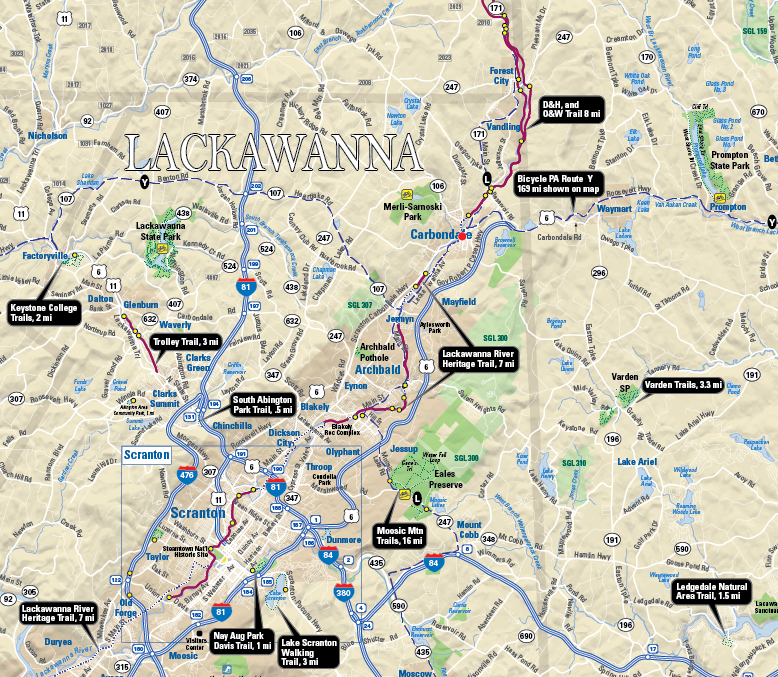
Steves Spindlers map of NEPA trails

After graduating, Steve combined his passion for cycling with his love of map-making. He started designing maps that promoted bicycle transportation. His list of clients grew, and so too did his reputation in the cartography community. Soon his maps were published and shared over a wide range of platforms across the country.

“It was nice to see my maps posted in public places – in office cubicles, in a Congressional office, being waved around by a US Secretary of Transportation, in a Mac OS X keynote, in the subway, on TV shows, in newspapers – I was using MAPublisher to help create them all.”

After several years of high-paced freelance cartography work, Steve chose to revise his business approach to allow him to be more selective in how he engaged with potential projects. “I created an archetype that I wanted to serve, and put energy into solutions that would help this archetype”. Steve mentioned how he prefers to let a client place a value on what they want, first spending time with the client to conceptualize a problem and then delivering a proposed solution, only sending an invoice once it is appropriate. In his words, this requires a knowledgeable client that really understands what they need.
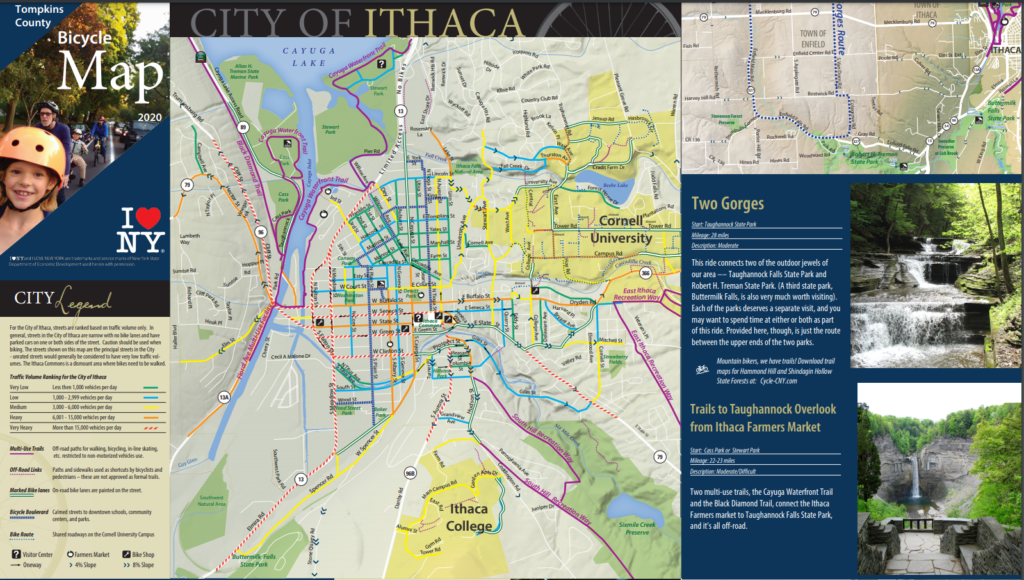
Steve Spindler's City of Ithaca bike map

Some years later, he returned to Temple University, this time as an instructor. He taught cartography to students within Temple’s Professional Masters of GIS program and stressed the importance of creating a balance between teaching concepts and teaching software. 

“Cartography is really about communicating with an audience, it’s not just about specific software. I think that teaching cartography using a single program (Illustrator with MAPublisher) would allow me to focus more on design concepts and communication. MAPublisher can still access large data sets, and the data is ultimately contained within the Illustrator file.”

His passion for teaching has continued beyond the classroom as well. In the last year, he has taken up a mentorship role for an up-and-coming cartographer. He provides direction and feedback on real-world map projects in what he describes as “learning with purpose”.
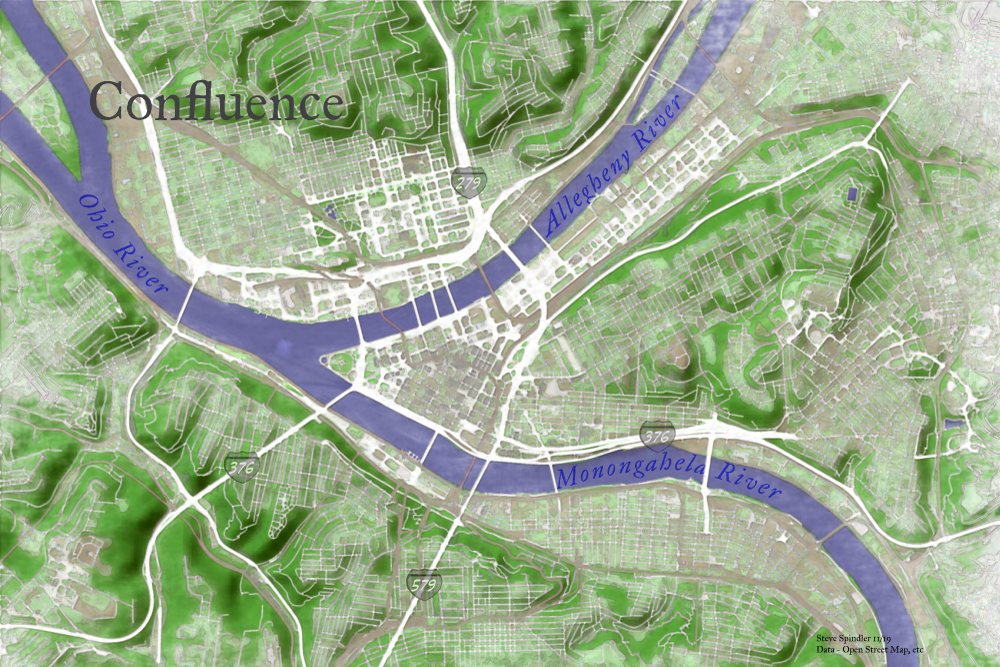
Steve Spindlers watercolour style map of rivers

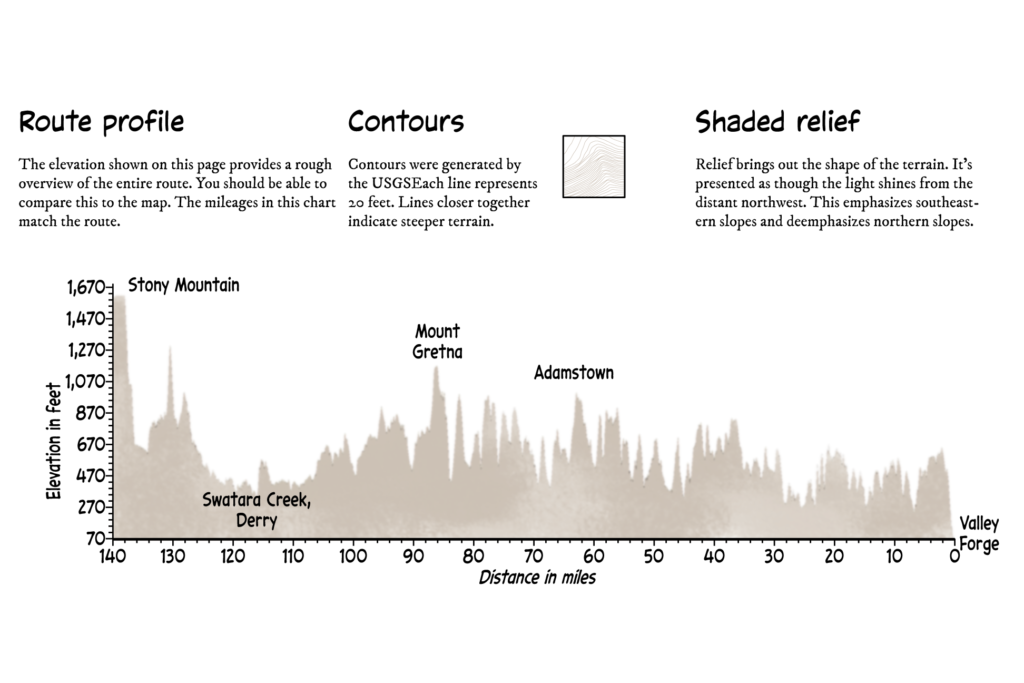
Steve also believes it is important to take learning into one’s own hands. To help him evaluate and improve his mapping processes, he often records his work sessions, carefully documenting and annotating many hours of recorded work such that he can revisit and recall specific mapping steps later on. Many of these sessions are edited down into videos that Steve posts on cartographyclass.com, a personal website for sharing his thoughts, ideas, and techniques on creating maps. He regularly shares maps that he creates for fun in his spare time, drawing inspiration from nature, photography, and artwork to create elegant visually engaging map pieces that exemplify the balance of art and science that is cartography. His recent work has explored the use of graphic styles and MAP Themes to create artistic map pieces that mimic the effect of watercolour paintings. Other posts show his use of the elevation profile tool to create unique maps of recent cycling trips.
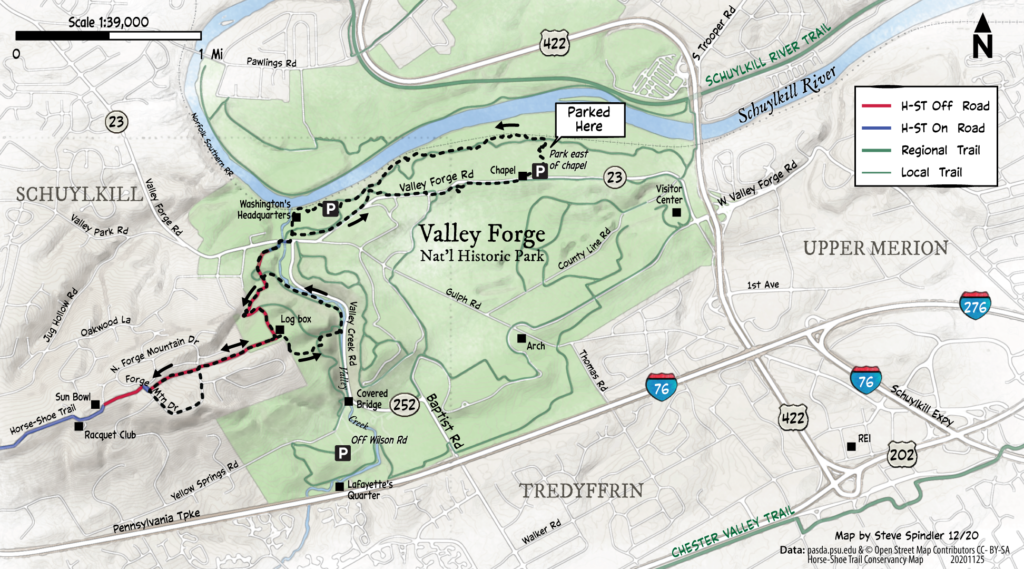
Steve Spindler's trail map of Valley forge

Steve Spindler's Valley forge elevation profile

In addition to the many MAPublisher focused tutorials hosted on his personal website, Steve is also an active contributor to the Mapping Class tutorial video series hosted on the Avenza Resource Blog. His contributions demonstrate unique and innovative workflows that leverage a wide range of MAPublisher tools. 

These days Steve continues to take on map-related projects. His approach has allowed him to develop a career that leverages a personal passion and directs it into a successful business. He continues to learn and explore new techniques in cartography in his free time, sharing his thoughts and processes with readers of his blog. After more than 25 years of freelance cartography work, Steve feels his perspective on mapping and business has changed, “Cartography and business are not the same things for me. I want to make maps and don’t need a contract to do this.  It’s just a matter of practicing daily. When the right client comes along, I can help out. I like to be helpful.” 
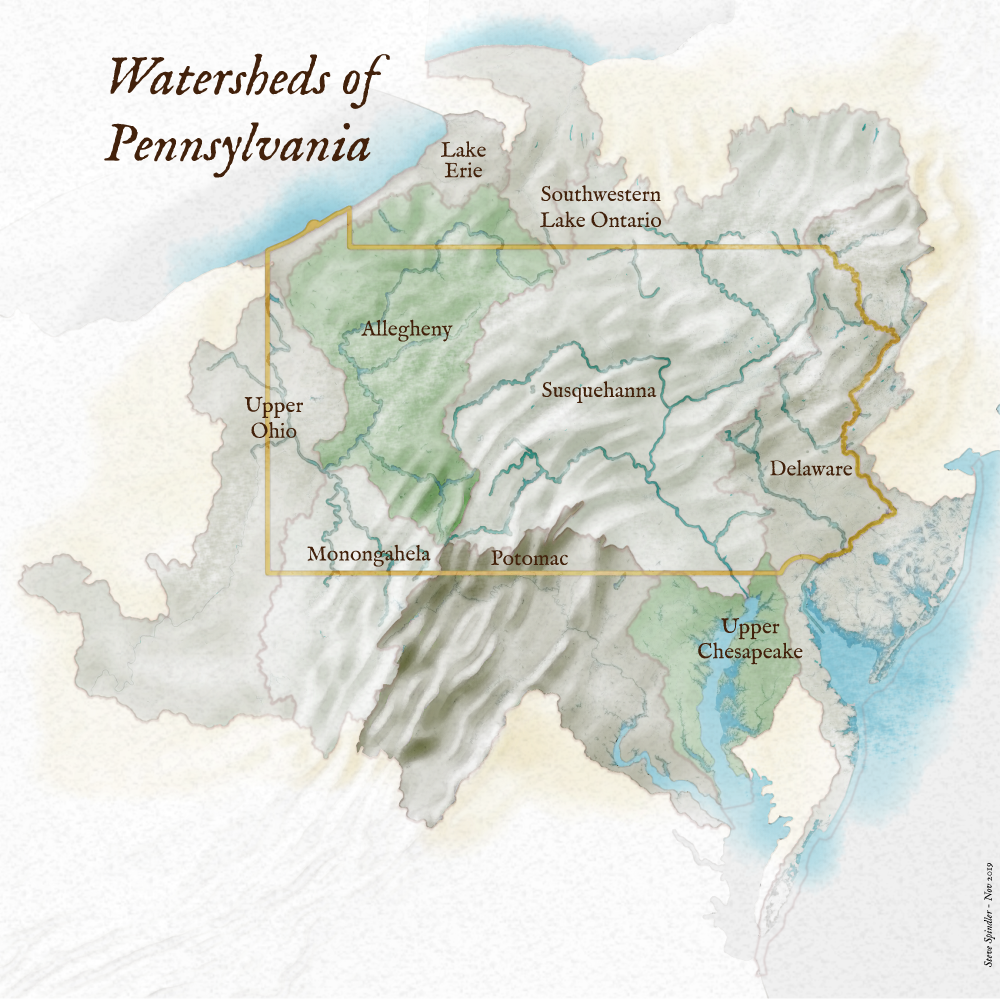
Steve Spindler's watercolour map of Pennsylvania watershed

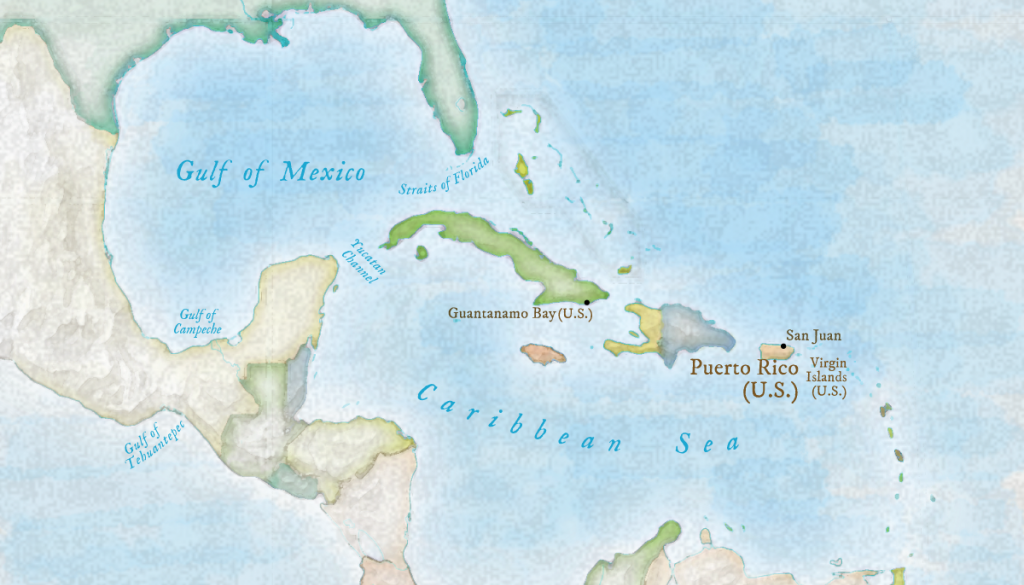
Steve Spindler's map of U.S. territories in the Caribbean

Mapping Class: Importing OpenStreetMap data using Overpass Turbo with Steve Spindler

We are back with another exciting addition to our Mapping Class tutorial series. The Mapping Class tutorial series curates demonstrations and workflows created by cartographers and Avenza software users. For this article, we are welcoming back Steve Spindler, a longtime MAPublisher user, and expert cartographer. He has shared with us an excellent tutorial on creating a map from scratch using openly available geographic data from OpenStreetMap, and accessed through Overpass turbo. Steve shows how you can create query statements to filter and export the data, and demonstrates how you can import the data into MAPublisher before using a selection of cartographic styling tools to create a visually appealing map.

Steve has produced a short video walkthrough detailing his map-making process. The Avenza team has produced video notes (below) to help you follow along.

***

Importing OpenStreetMap data using Overpass Turbo
by Steve Spindler (video notes by the Avenza team)

Finding and accessing good quality data is often the first challenge for any cartography project. OpenStreetMap (OSM) can be an excellent source of open vector data describing land cover features (roads, parks, rivers, buildings, trails, infrastructure, boundaries). Once collected, cartographers can use OSM data to create highly detailed maps using the MAPublisher plug-in for Adobe Illustrator. Steve will demonstrate his process of collecting raw data from OSM and using it to craft a beautiful map of the Niagara Falls Area. The following video notes summarize Steve’s approach. 

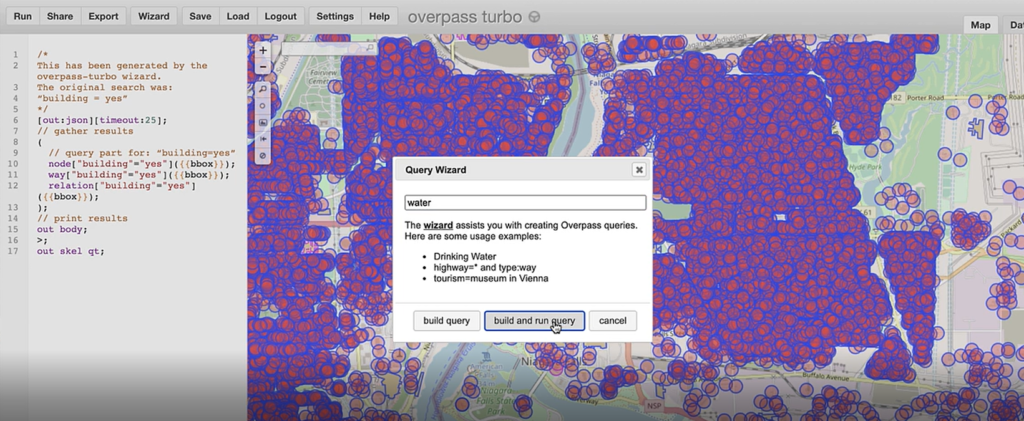
First, you will need to extract some data from the OSM database. Since OSM is a massive repository of geographic data, you’ll need a way to filter through and extract only the data needed for your specific map project. Overpass turbo is a web-based data mining tool that can make querying and exporting OpenStreetMap datasets easy. The tool allows users to apply query statements that filter the OSM database based on attribute and location information. Using the Overpass turbo “Wizard”, a user can enter simple queries (i.e. “water”) and automatically filter and select all features that match the query statement, making it easy to export specific data for your map.

Steve uses a simple query to obtain all map features that are considered “water”. This includes both natural and man-made features

The tool allows the user to export the filtered datasets into geoJSON format, an open standard format for storing and representing geographic data and attributes.

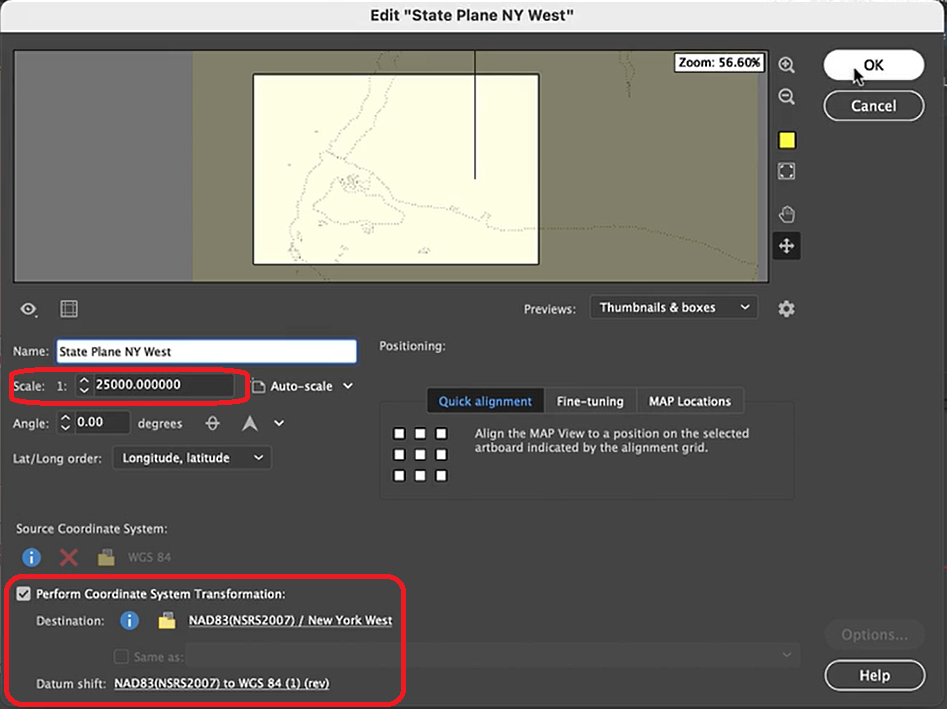
The geoJSON datasets collected from Overpass turbo can then be imported directly into MAPublisher for styling into a finished map. Use the Import tool to load the data onto an Adobe Illustrator artboard. From here, you can open the MAP View editor to adjust the scale and projection information for each map data layer. For this map, reproject the data into State Plane NAD 83 to preserve an accurate spatial scale. Set the scale option to 25,000 and customize the position of the map data on the artboard.

If needed, use the Vector Crop tool to trim the map data down to a specific area of interest, and simplify the layer to create smoother lines by removing excess vertices.

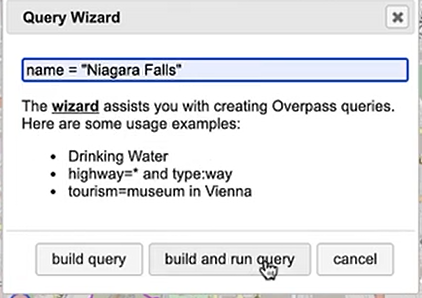
Back in Overpass turbo, you can build more specific query statements to extract individual features from larger data categories. Use the statement: name = “Niagara Falls”, to select polygon features specific to the waterfalls in that area.

Import this new data into MAPublisher, and drag and drop it into the same MAP View as the water layer. The data will be automatically scaled and projected to align with the water layer. Apply a graphic style fill for the water bodies and waterfall area.

Next, we can go back to Overpass Turbo and extract road and highway data. You can build out more complex query statements using basic database operators (i.e. and/or). For longer, complex query statements it helps to create saved queries that you can re-use. This map uses a saved query statement called “selected roads with residential” to extract line features covering most road types:

(highway=primary or highway=secondary or highway=cycleway or highway=path or
 highway=motorway or highway=trunk or highway=tertiary or
 highway=neighborhood or highway=footway or highway=service)


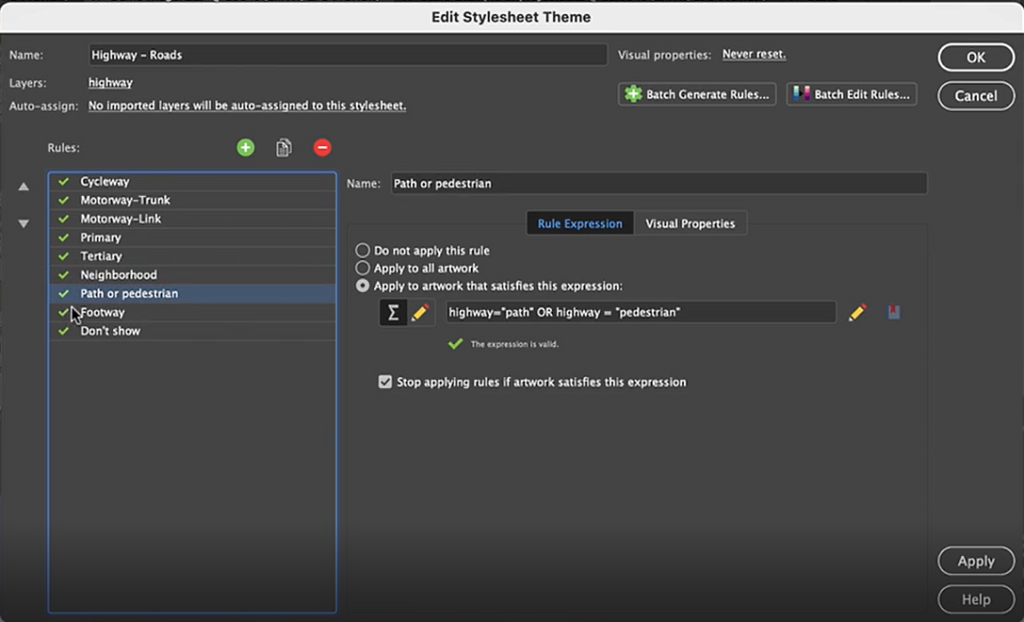
Import the roads data into the same MAP View as the other datasets. If you look at the MAP attributes you can see the road data is split into several different types. Steve use’s MAP Themes to create rules-based stylesheets to visualize the different road lines based on their road-type attributes. Steve designed a rule-set that made minor roads more subtle in appearance, while major roads and highways became more prominent. He also used colour to distinguish between pedestrian and vehicle network links.

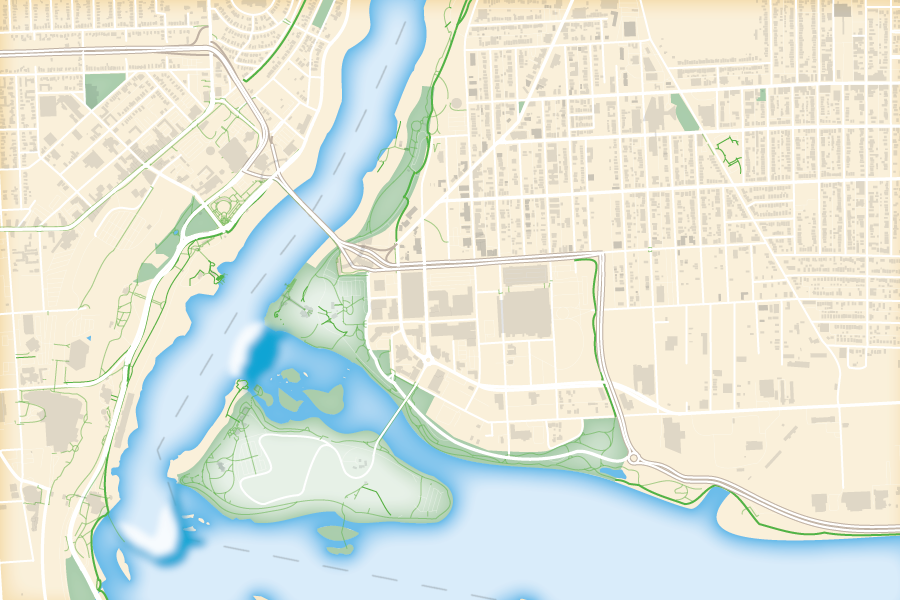
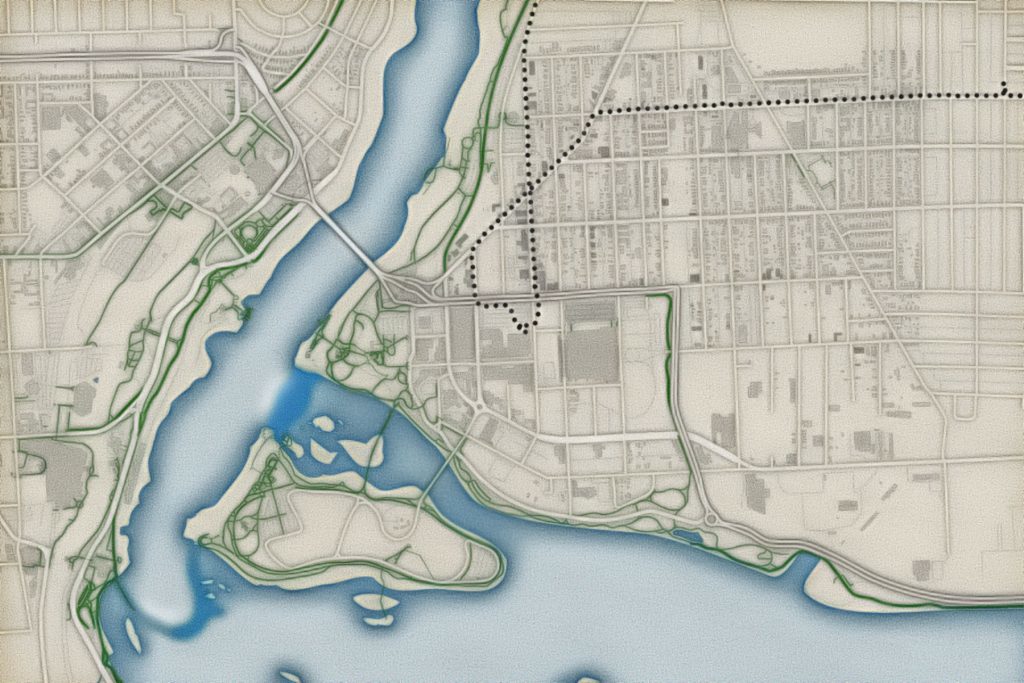
Repeat this process with a building footprint layer and crop all layers in the final map to the artboard extent. The finished product is shown below (top). Some final touch-ups in photo editing software can be used to create a more stylized appearance (bottom).

Exported map from Illustrator

Stylized version modified with Photo editing software

***

About the Author

Steve Spindler has been designing compelling cartographic pieces for over 20 years. His company, Steve Spindler Cartography, has developed map products for governments, city planning organizations, and non-profits from across the country. He also manages wikimapping.com, a public engagement tool that allows city planners to connect and receive input from their community using maps. To learn more about Steve Spindler’s spectacular cartography work, visit his personal website. To view Steve’s other mapping demonstrations, visit cartographyclass.com

What’s New in MAPublisher 10.8

What’s New? MAPublisher 10.8

We are happy to announce that MAPublisher 10.8, the latest update to the MAPublisher plug-in for Adobe Illustrator, is now available. With this release, we are excited to bring forward new usability enhancements for several MAPublisher tools. We are also thrilled to confirm that MAPublisher now supports raster files in the enhanced compression wavelet (ECW) format. Alongside these enhancements, we have also implemented improvements and added expanded support to our coordinate system library.

Here is what you can expect with the latest MAPublisher 10.8 release:

Usability Improvements for MAPublisher Tools

The Avenza team is always working to improve the capabilities of our vast suite of cartography tools. We work with our users to implement improvements to our tool catalog that truly meet the needs of actual mapping professionals. In this release we are introducing several enhancements to some of our existing tools:

Multi-Column selections in the Attribute Table Editing Schema

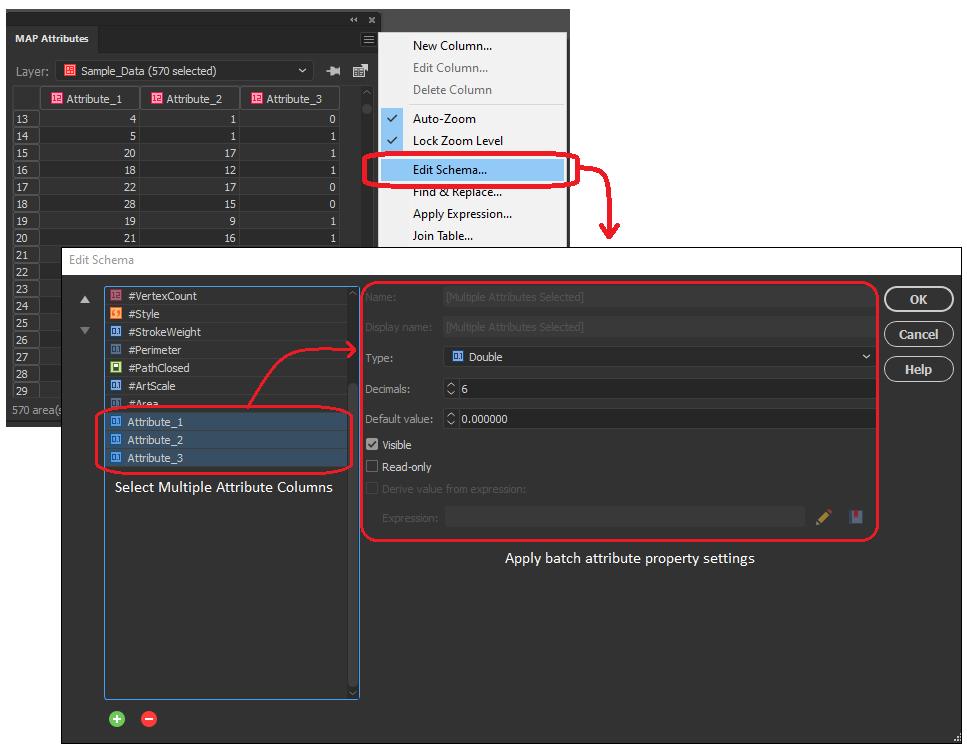
In the early versions of MAPublisher 10, we added the ability to select multiple columns within the Edit Schema window of the MAP attributes panel, allowing users to toggle visibility settings on multiple attribute columns at the same time. Now with 10.8, we are delighted to build on this by implementing the ability to configure data properties across multiple selected attribute columns. Users can not only toggle visibility or remove multiple attribute columns at once, but can now also edit default values, attribute size, and read-only settings for all selected values. Additionally, users can now change the data type (i.e string, integer, boolean, etc) for multiple selected attribute columns all at once, as long as each column shares the same starting data type. 

Select and add multiple MAP Locations in Line Plotter

We continue to bring improvements to the Line Plotter tool, this time by introducing the ability to select multiple MAP locations and add them to the line vertices (node) list. For users familiar with the Point-by-point plotting method in Line Plotter, this will be especially useful for adding a large collection of sequential MAP locations, as previously each point needed to be entered one at a time. 

Document Summary Panel now includes “Last Saved with” Version Info

For users working with MAPublisher projects across different versions of the software, you will be delighted to know that the document summary dialogue now includes information indicating the version of MAPublisher the project was last saved with. This information will help users that frequently share MAPublisher projects with colleagues, allowing them to better establish version standards across collaborative projects. 

Overprint Options in MAP Themes

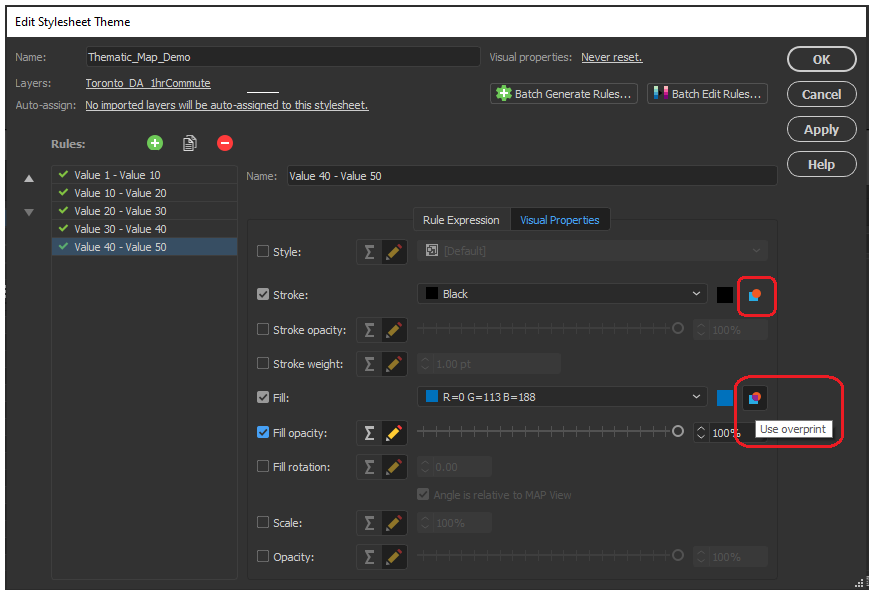
Previous versions of MAPublisher required a user to navigate the Illustrator attributes panel to configure overprint options for each map element individually and refer to these options separately using MAP Themes. Now with MAPublisher 10.8, an overprint option has been implemented directly within the MAP Themes panel, allowing users to configure overprint settings for fills and strokes within each stylesheet in the MAP Themes tool.

Scale bar, Create Legend, and Elevation Profile tool previews with Background Colours

We have added a small improvement to the scale bar, create legend, and elevation profile tool panel. The preview window for these tools, which allows users to adjust and edit their visual properties before adding them to the map, now has the option to configure a preview background colour. This option is helpful when configuring light, or white-coloured map elements which were previously difficult to see against the default white preview background. 

Support for Raster ECW file formats

New to MAPublisher 10.8, we now include Enhanced Compression Wavelet raster files to our growing lists of supported data formats. Users can now import and work with ECW files directly within the MAPublisher environment of Adobe Illustrator, all while retaining necessary spatial integrity, and without needing to convert your data. 

Engine Improvements and Updated Coordinate system catalogue

We are working continuously to improve the back-end MAPublisher engine to ensure our users can continue their work in an optimized, seamless,  design-focused cartographic environment. Along with improvements to our engine and bug fixes, we have built on our current coordinate system catalogue with updates to the coordinate system and projection library. This means our list of supported projections has grown, with new additions including the Natural Earth and Natural Earth 2 Projections created by Tom Patterson. For a full list of our expanded coordinate systems library please check the projections guide in the Avenza Support center.

MAPublisher 10.8 is immediately available today, free of charge to all current MAPublisher users with active maintenance subscriptions and as an upgrade for non-maintenance users. 

Find out more at the Avenza User Conference!

Want to learn more about MAPublisher? Want to see how industry professionals are using Avenza Products in their organizations? Join us on May 12th, 11am – 5pm (EST) for the first-ever Avenza User Conference. Registration is Free!

The event will feature a full day of speaker presentations from the Mapping and Geospatial communities. The Avenza Product teams will also be on hand to answer questions and give you a sneak peek of upcoming developments to the Avenza Platform. Sign up for free at avenza.com/user-conference

Avenza User Conference 2021


News Archive

Blog Archive

December 2024 (2)
November 2024 (1)
October 2024 (1)
November 2024 (1)
September 2024 (1)
August 2024 (2)
July 2024 (1)
September 2024 (1)
June 2024 (1)
July 2024 (1)
May 2024 (1)
April 2024 (2)
May 2024 (1)
March 2024 (2)
February 2024 (1)
January 2024 (1)
December 2023 (1)
November 2023 (2)
October 2023 (2)
September 2023 (1)
August 2023 (1)
July 2023 (3)
June 2023 (1)
February 2023 (1)
January 2023 (2)
December 2022 (1)
November 2022 (2)
October 2022 (2)
September 2022 (1)
May 2023 (1)
August 2022 (2)
July 2022 (1)
June 2022 (2)
May 2022 (1)
February 2022 (1)
January 2022 (2)
August 2022 (1)
December 2021 (3)
November 2021 (5)
October 2021 (1)
September 2021 (3)
August 2021 (2)
July 2021 (1)
June 2021 (2)
May 2021 (2)
April 2021 (2)
March 2021 (3)
April 2021 (1)
February 2021 (1)
January 2021 (1)
November 2020 (1)
October 2020 (1)
June 2020 (2)
May 2020 (1)
April 2020 (3)
March 2020 (2)
December 2019 (1)
November 2019 (2)
September 2019 (1)
August 2019 (1)
July 2019 (1)
June 2019 (3)
May 2019 (4)
April 2019 (2)
March 2019 (1)
February 2019 (2)
January 2019 (3)
December 2018 (2)
November 2018 (1)
October 2018 (1)
September 2018 (2)
August 2018 (4)
July 2018 (2)
June 2018 (1)
July 2018 (1)
June 2018 (4)
May 2018 (1)
April 2018 (2)
March 2018 (4)
February 2021 (1)
February 2018 (1)
January 2018 (1)
November 2017 (1)
October 2017 (2)
August 2017 (2)
July 2017 (1)
March 2017 (1)
February 2017 (2)
January 2017 (2)
November 2016 (1)
January 2017 (1)
November 2016 (1)
October 2016 (2)
May 2016 (1)
March 2018 (1)
April 2016 (2)
December 2015 (2)
June 2015 (1)
May 2015 (1)
April 2015 (2)
December 2014 (4)
October 2014 (2)
May 2014 (4)
February 2014 (1)
October 2013 (3)
April 2013 (1)
January 2013 (2)
August 2012 (1)
October 2012 (1)
July 2012 (3)
May 2012 (2)
January 2012 (2)
August 2011 (1)
July 2011 (2)
June 2011 (2)
May 2011 (2)
March 2011 (1)
February 2011 (1)
January 2011 (5)
December 2010 (1)
November 2010 (1)
December 2010 (1)
November 2010 (1)
October 2010 (1)
August 2010 (4)
July 2010 (2)
June 2010 (3)
May 2010 (2)
April 2010 (2)
March 2010 (2)