Kim Beckmann is a storyteller above all else. As a graphic designer and Associate Professor of Design & Visual Communication at the University of Wisconsin-Milwaukee (UWM), Beckmann
uses visual media to do just that. More recently, she dipped her toes into the world of cartography (another story-telling medium) then fell right into the deep waters.
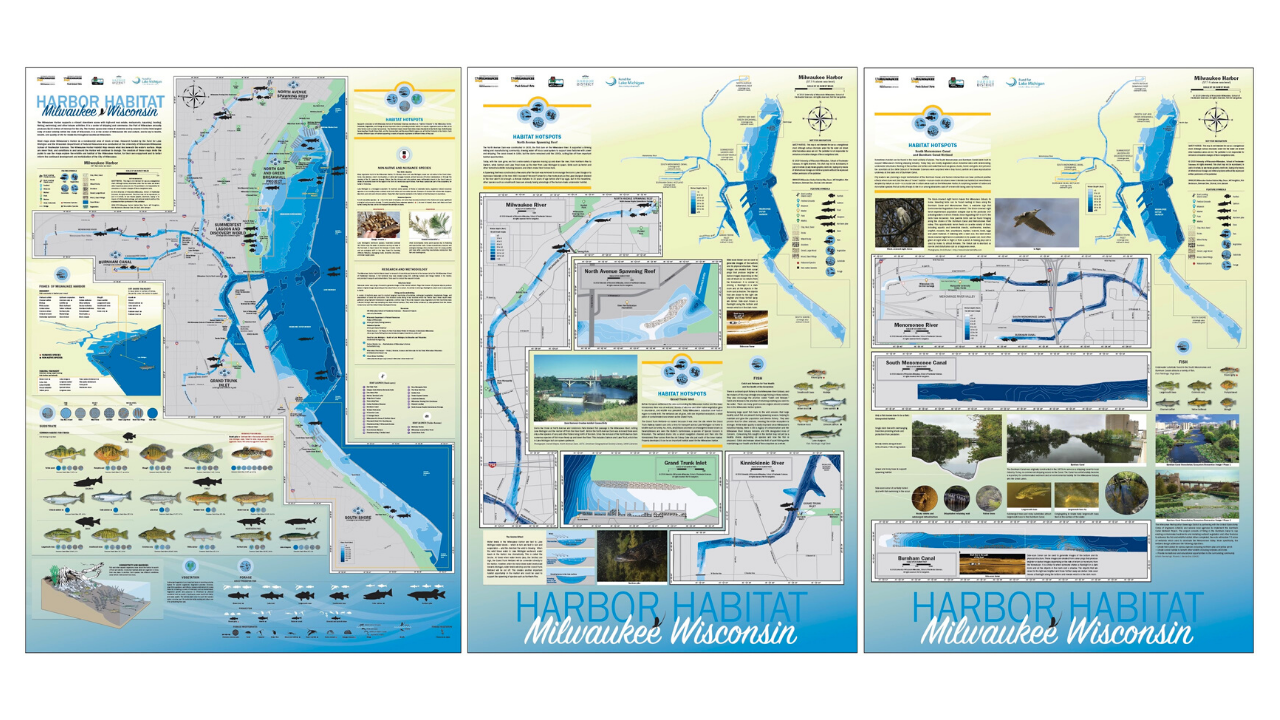
It all started when researchers from the university’s School of Freshwater Science came to her for help with creating supporting materials for a research project. The team’s ambitious project set out to map several miles of the Milwaukee harbor coastline, studying the effects of urban development on the harbor habitats. The research team had already created highly detailed technical maps but reached out to the Peck School of the Arts for a faculty member who could help put together the material in a way that could be more easily digested by the public and told the a story about the impact of people on the habitats that exist in the harbor.
“I also represent a part of the general public who would be interacting with the maps; individuals that want the maps to tell them a story. I recall at the first team meeting where we discussed research findings and what to present on the maps, I had many questions. What type of fish live in the harbor and rivers? What do they eat? Where do they live? Does water temperature effect where and when we might find them? Interestingly, the questions I raised led to incorporating additional habitat information into the maps,” said Beckmann. “What started as a concept for a single map quickly evolved to a set of five maps due to the amount to information we needed to share, the largest being 3 ft by 4 ft!”
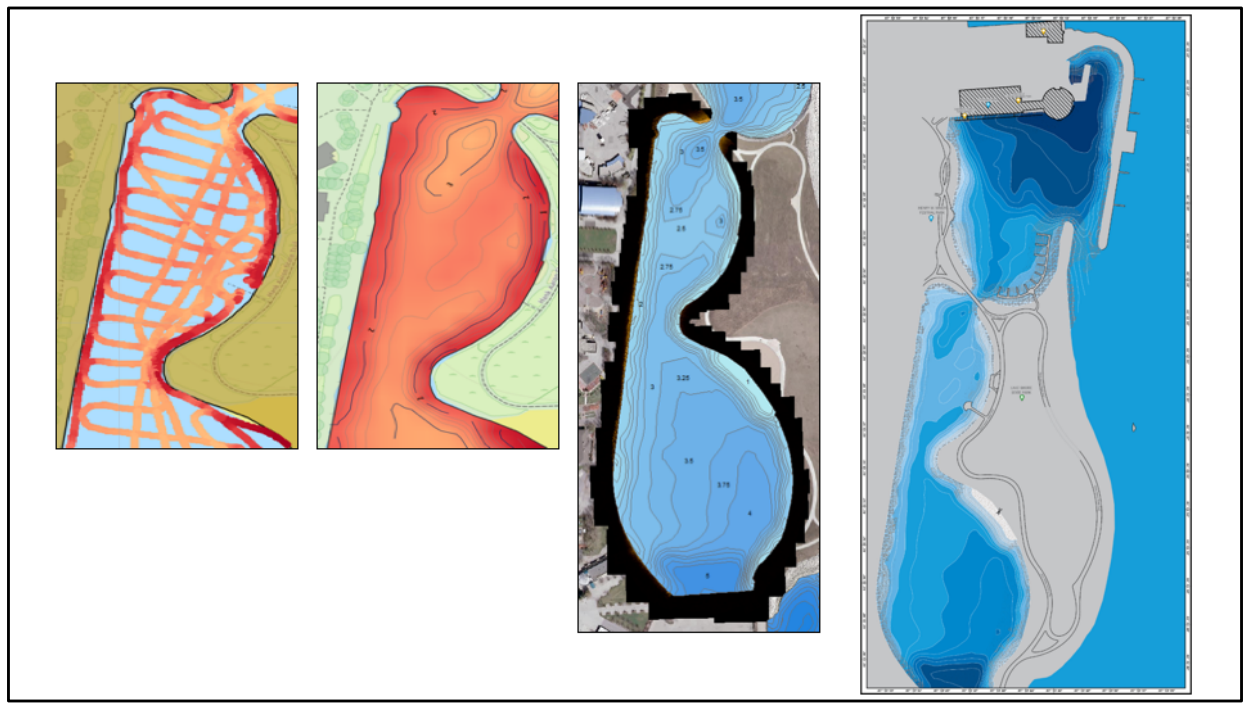
As a graphic designer, Beckmann had made maps before, including simple, vector-based topographic maps, and maps for wayfinding. But this was her first time working on a larger map project and her first time working with raw geospatial data to create bathymetric maps to illustrate water depth. “I am extremely comfortable with Adobe Illustrator so when I discovered that there was a cartography plug-in for it, called MAPublisher, that could be used to manage GIS data to create maps, I knew that it would be faster and easier than learning an independent cartography software tool.”
The School of Freshwater Science research team carried out data collection for the project using side-scan sonar devices. With technical support from the Avenza Systems team, Beckmann was able to get the data into a shapefile format and import it into Adobe Illustrator using MAPublisher. “I registered for a training course offered by Avenza Systems, on how to use MAPublisher with Illustrator,” said Beckmann. “That led to a meeting with Jeff who was able to provide helpful direction on how to transform the raw map data into the maps I wanted to make.”

Jeff Cable is the Desktop Product QA Lead at Avenza Systems. In addition to his work with the MAPublisher development team, he is also responsible for providing training to new MAPublisher users. “I met Kim in 2016 at one of our in-class training sessions in Chicago,” said Cable. “She had a very clear vision of what she wanted to create, but after some more discussion and reviewing the data, I realized that it would require advanced GIS workflows in order to get the data to an appropriate level before it was ready for mapping.” Seeing the value in the research project, he offered to assist Kim rather than have her seek out a GIS professional on her own. Once the data was prepared, she took what she learned from the MAPublisher training course and was able to apply visualization techniques to her maps. Cable corresponded several times as the project progressed and provided guidance. “Kim would ask if MAPublisher could do this or that, and in most cases, my answer was You bet it can!” he added. In addition to providing tips and best practices, he showed her many of the useful tools in MAPublisher that made her workflow more streamlined such as copying MAP Objects, working with MAP Stylesheets, and creating insets. “When I saw the finished product, I was blown away by what Kim had created. It was also gratifying as a training instructor to see how far she had come since our first meeting.”
Beckmann has since spoken about her work on the Milwaukee Harbor habitat maps project to the American Geographical Society, cartography clubs, and presented an artist talk as part of the Peck School of the Arts Artist Now! Lecture Series. The series of five maps have been printed on canvas and distributed to local and regional schools and turned into metal signage to be installed along the shores of the harbor to help share important research conducted by Janssen Labs with the public.
The first of five maps installed at Harbor View Plaza Park.
Two of the maps installed in the active learning classroom as Discovery World.
Disovery World is located in Milwaukee, Wisconsin.

Beckmann’s maps also currently hang in the Avenza Systems offices and we are proud to have them as a reminder of the amazing things visual artists and cartographers can do with the tools we provide.
Learn more about the project and how the maps were made on the UWM website https://uwm.edu/harbormaps/
__________________
In collaboration with Kim Beckmann, Associate Professor of Design & Visual Communication at the University of Wisconsin-Milwaukee.


