Articles
Does your map have data that updates periodically? Maybe your river data gets updated each year, or the lake boundaries change. Typically, this means importing all the data into your map again as things change. To make your life easier, MAPublisher has the option to Manage Data Links, which allows you to check for updates to linked data and to automatically apply the updates to the map! You can even set your MAP Theme Stylesheets to apply to the new data so you don’t have to re-style it manually.
Say you’ve got a street map that you created last year. But, the city has updated the status of some of the streets. Some of the lanes have changed to local roads, and some of the minor arterial roads have been updated to major arterial. Instead of importing all of your data again, let’s create some data links (with linked MAP Theme Stylesheets) to update the map with ease.

Let’s focus on a small inset of this map so we can better see the changes that will happen. In this example, we’ll focus on an area where we know the ‘laneways’ have changed to ‘local’ roads. Our laneways are purple, and our local roads are in blue.

Now that we know what we’re looking for, let’s check out the data link itself. Your data link was automatically created when you imported your data. To access the data link, simply open the Manage Data Links in the MAP Views panel.
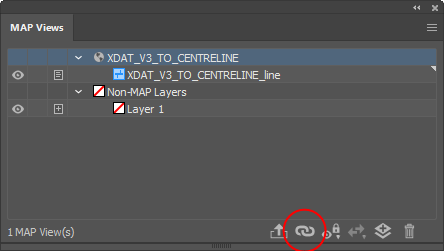
You’ll see that there is one data link, and that’s for the streets file we imported to make the map last year. To view the settings of the data link, click Edit (pencil icon) at the bottom-left of the dialog box.
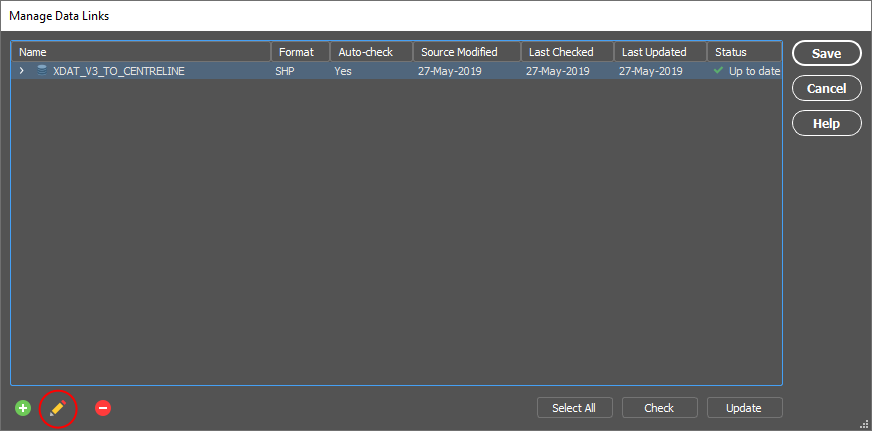
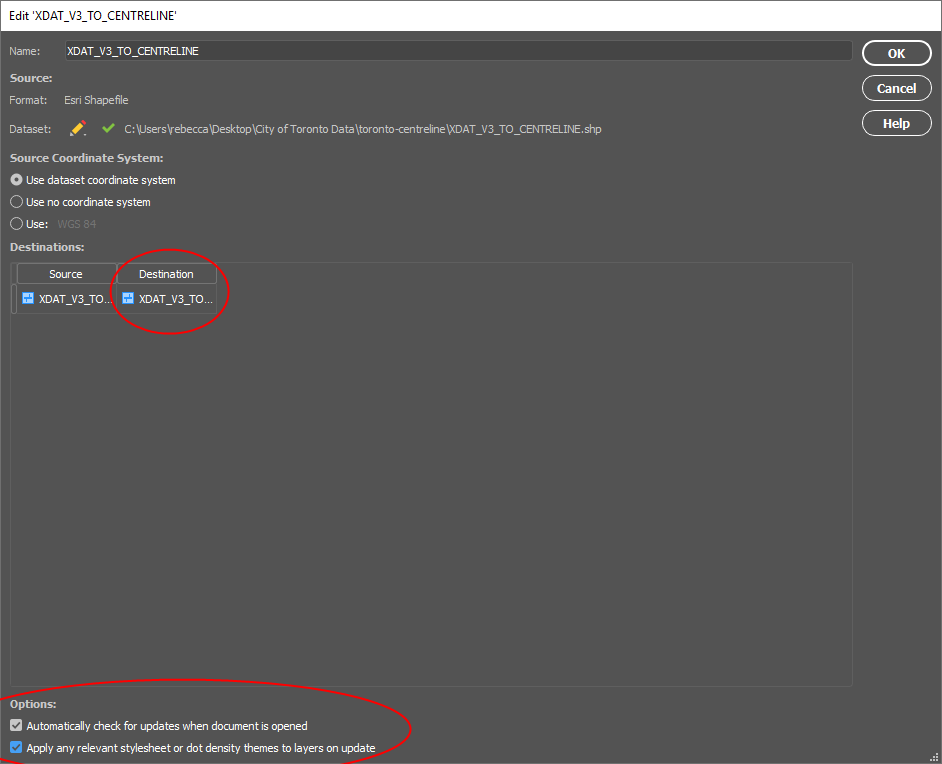
Now you have the option to turn on the ‘Automatically check for updates when the document is opened’ setting, and (or) turn on ‘Apply any relevant stylesheet or dot density themes to layers on update’. In order for the stylesheet option to work, be sure to set the appropriate destination layer.
Once all the settings are set, check if there are any data updates by clicking the Check button in the Manage Data Link window.
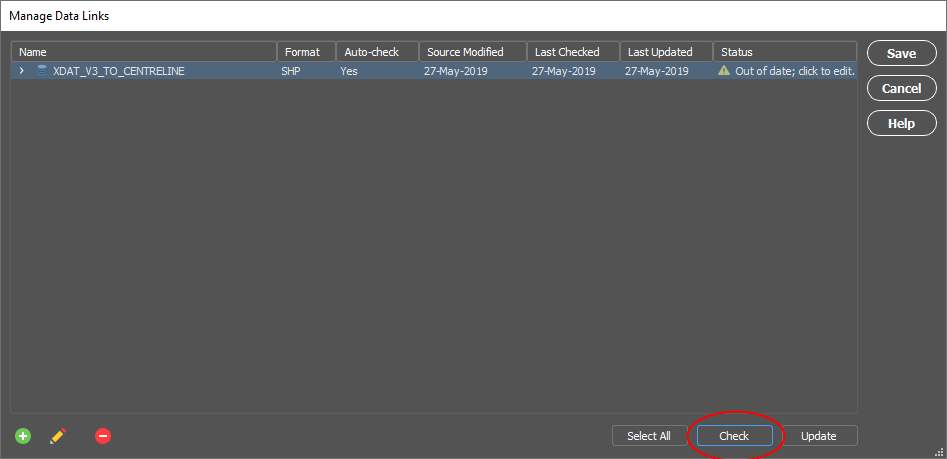
After checking we can see that the Status has updated to say that our data is out of date. Click the Update button to update the data. A dialog box will pop up to confirm that this is indeed the data you’d like to update. Click Update to start the update. I know that some of the ‘laneways’ have been changed to ‘local’ roads, and so the attribute has been updated. Since I created the MAP Theme using those, we should see the changes.
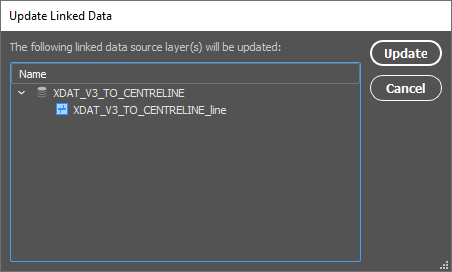
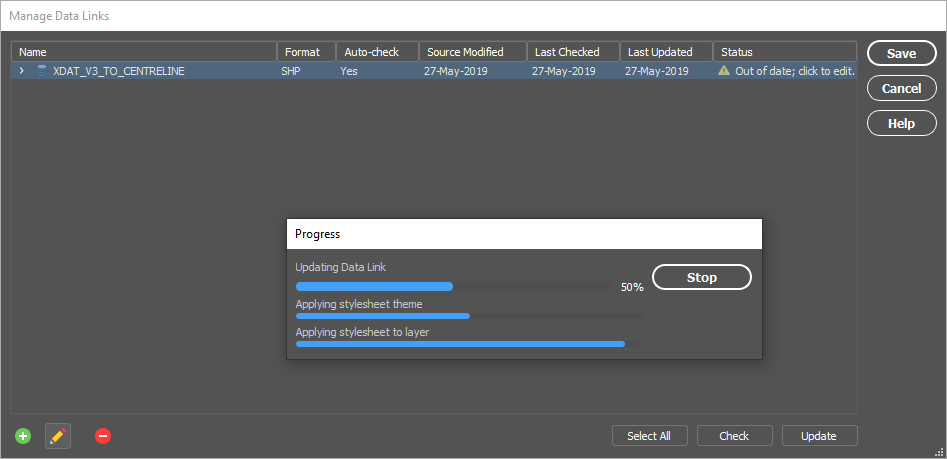
Once the update is finished, we can see on our map that all of our ‘laneways’ have changed to ‘local’ roads, and they have updated with the MAP Theme Stylesheet as well.

Using the Manage Data Links option is an easy way to update your data when updates become available! Save yourself the time and hassle of importing data over and over again and use the data links to your advantage. If you’re looking for more documentation, be sure to check out our help pages.
Sometimes when you’re on the hunt for geospatial data, all the data you need isn’t available in common file formats. Luckily for us, lots of data is available on Web Map Services (WMS), Web Feature Services (WFS), ArcGIS Online, ArcGIS Web Services, and PostGIS.
Data can be imported into MAPublisher from all of these services. Importing from a server connection always retains the attributes and referencing that exists in the original data. In order to import from a server, an internet connection is required.
WMS and WFS services can be part of open data portals, or for private use. Both services allow you to add layers of data to your map in MAPublisher, but have different functionalities. WMS allows you to import raster data in a variety of formats, while WFS allows you to import vector data.
To import from WMS or WFS, go to Import or Multi Data Import, and choose Web Map Service, or Web Feature Service from the Format listbox. Once you’ve selected the source you’d like to use, load services from Avenza (pre-loaded services) or, import your own from a file.

Once you’ve selected your specific service, you can select the layers you’d like to import. Information such as layer name and description is included. There is also the option to use the spatial filter directly in the layer selection box, to use the extents of another layer to specify, or specify exact coordinates to limit the area being imported.
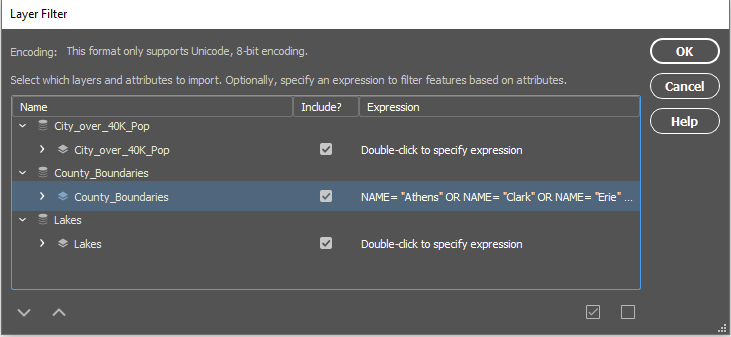
When importing data from WMS or WFS, you have the option to use the spatial filters, layer filters (attribute expressions included!) and simplification. These options allow you to filter the data to better suit your needs.

If you’re importing from ArcGIS Online, you’ll need an ArcGIS Online account, and an internet connection. Once you’re logged in, you’ll be able to select data to import. When importing data, you can choose Feature Layers, Map Image Layers, and Tile Layers to import.
When importing Feature Layers, you’re able to filter the data as well. Once you select the Feature Layer that you’d like to import, you can choose to ‘Edit Query’ and write a SQL statement to narrow down the features or attributes you’d like to import.
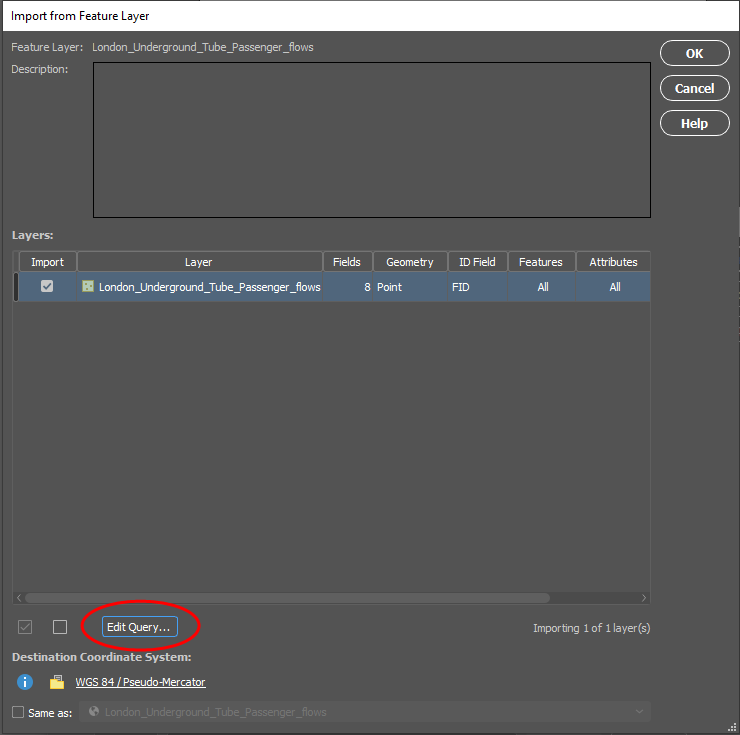
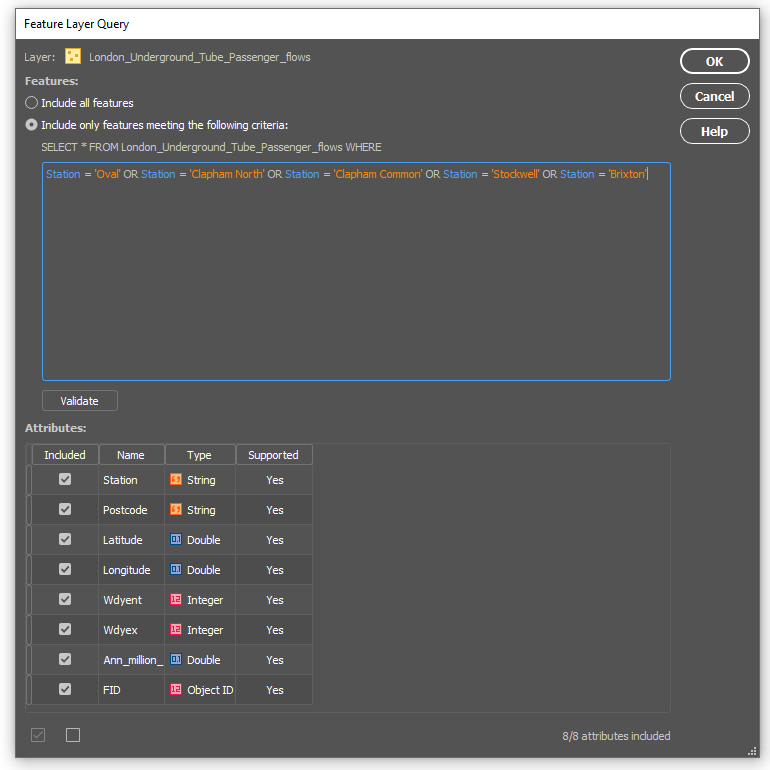
Once your query is made, your data can be imported.
If you want to import Map Image Layers or Tile layers, you’re able to choose a specific area to import, very similar to the Spatial filters available when importing other files. Using the ‘Select Area’ option can help reduce the size of the image you’re importing and helps crop data before you import it, so you’re not importing large amounts of data you’re not going to use.
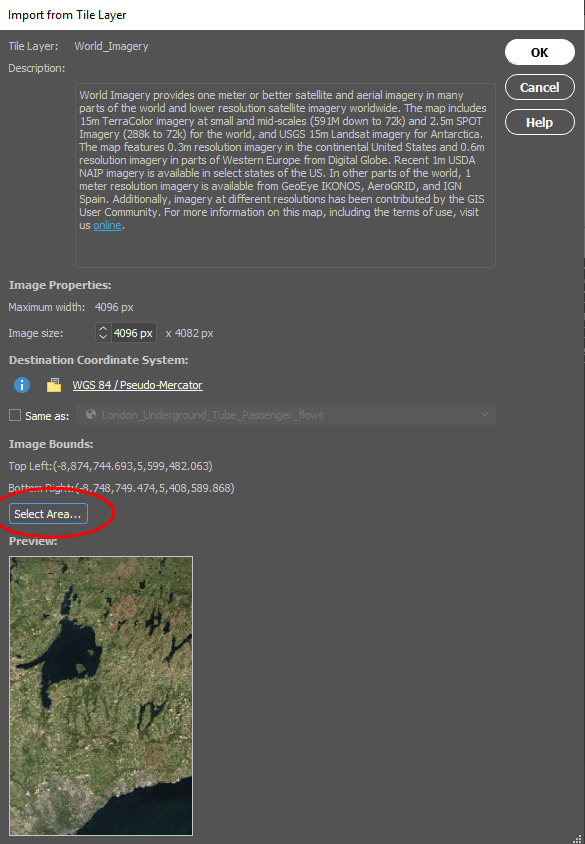
In order to import from ArcGIS Web Service, you’ll need an ArcGIS Web Service URL. Previously imported services are saved in the Service URL drop-down list.
Lastly, if you’re importing data using the PostGIS option, you also have the ability to filter your data. You can specify a Spatial Filter, and manually set the coordinates for points 1 and 2.
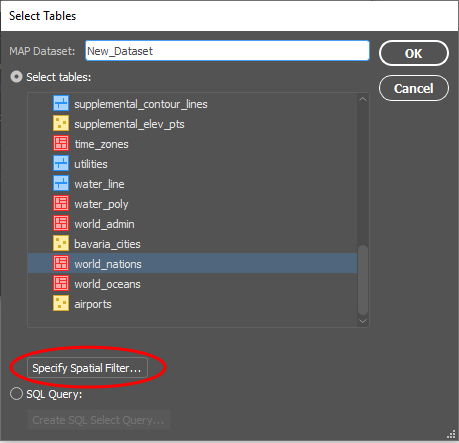
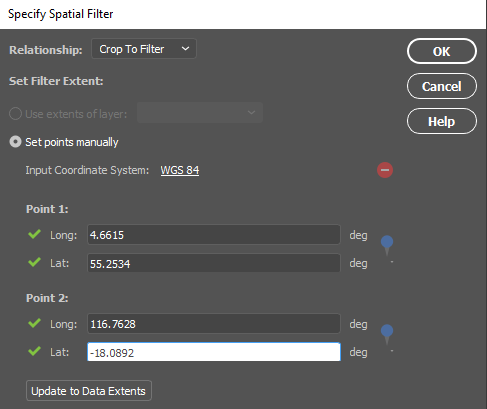
This will allow you to import only the data you need! You can also filter your data using a SQL query, which will help reduce the number of features or attributes you need to import.
Importing from different servers can be a great way to get different data. The best part about importing from servers is that MAPublisher allows you to filter as you import, just as you can when importing other file types. Crop or query the data as you see fit, regardless of where the data came from!

The process of making maps can vary greatly depending on the cartographer and the purpose of the map. Tom Patterson, one of the cartographers behind the public domain data set Natural Earth and the popular website Shaded Relief, regards cartography as a creative process. He sees geospatial data as an artist would see paint on their palette. “They are raw materials from which the map is made,” says Patterson. “For me, the map making process starts with an online scavenger hunt for geospatial data, and ends with a visual depiction of the results of that scavenger hunt, a map.”
Patterson recently retired after 26 years with the U.S. National Park Service at the Harpers Ferry Center, located in West Virginia. Harpers Ferry Center is the media hub for the U.S. National Park Service, where most of the maps, exhibits, and publications for public consumption are produced.
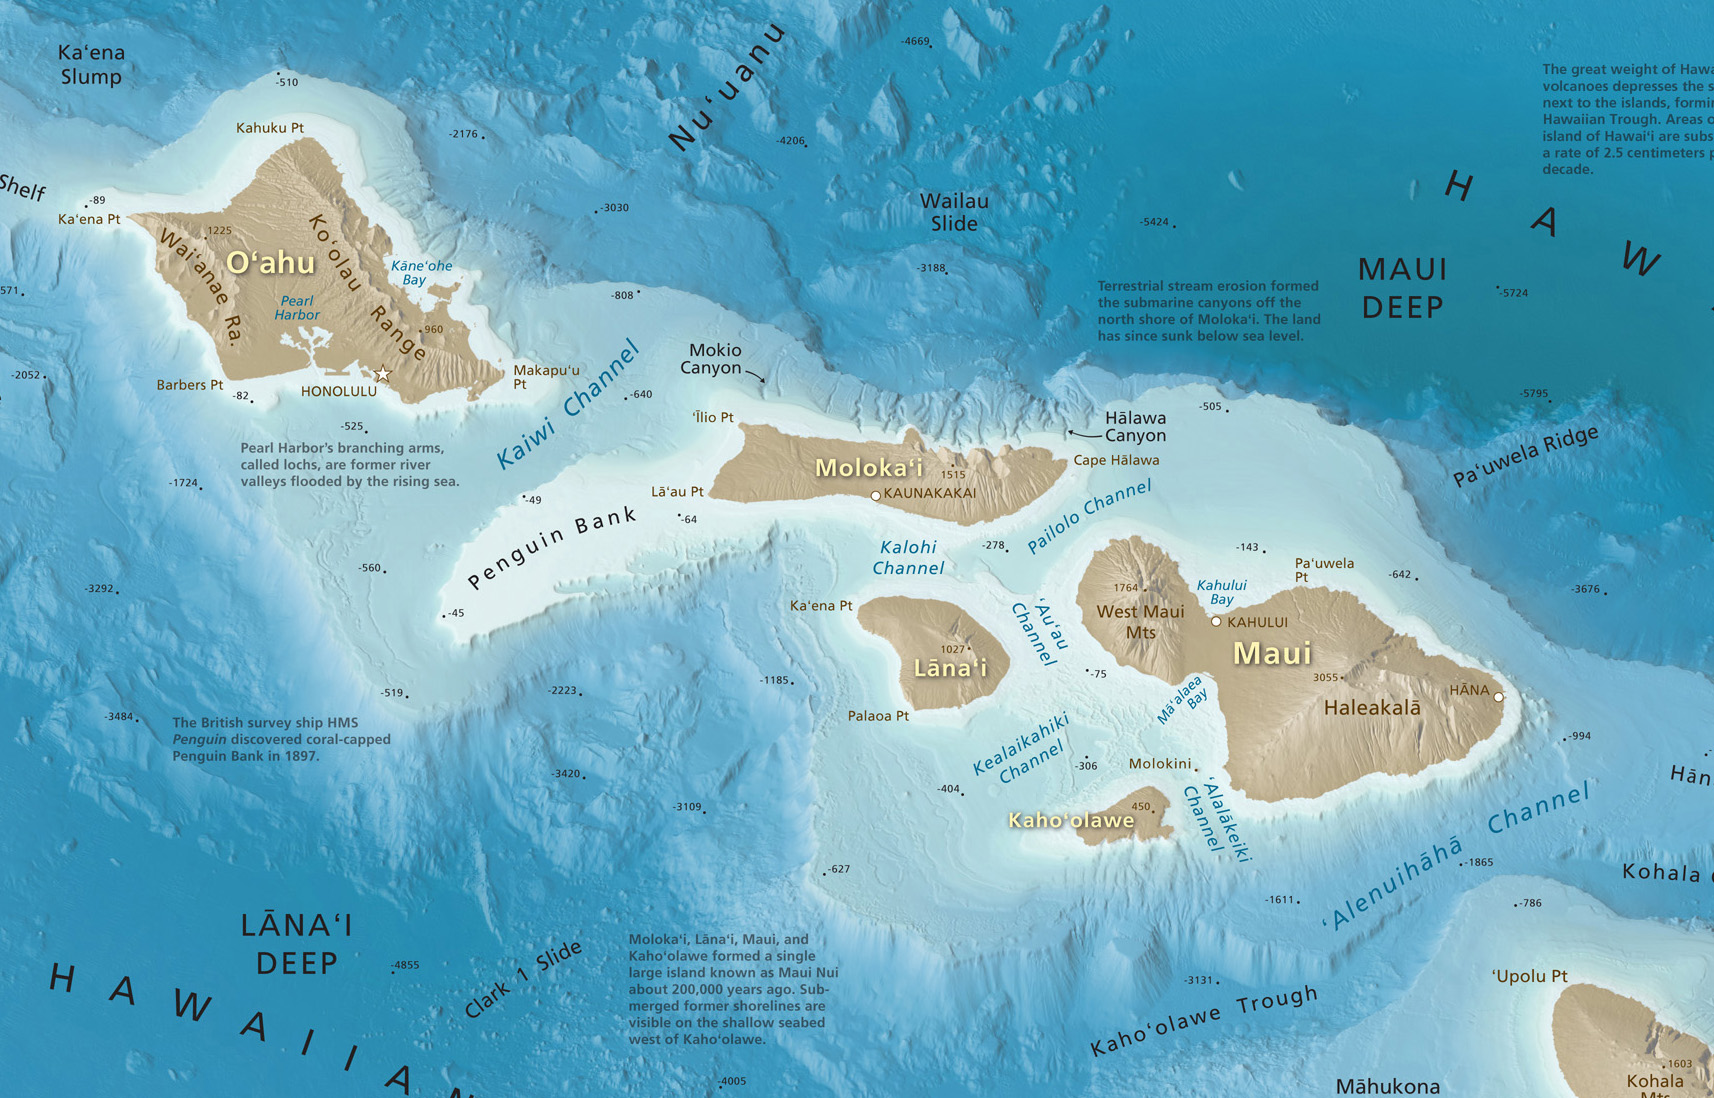
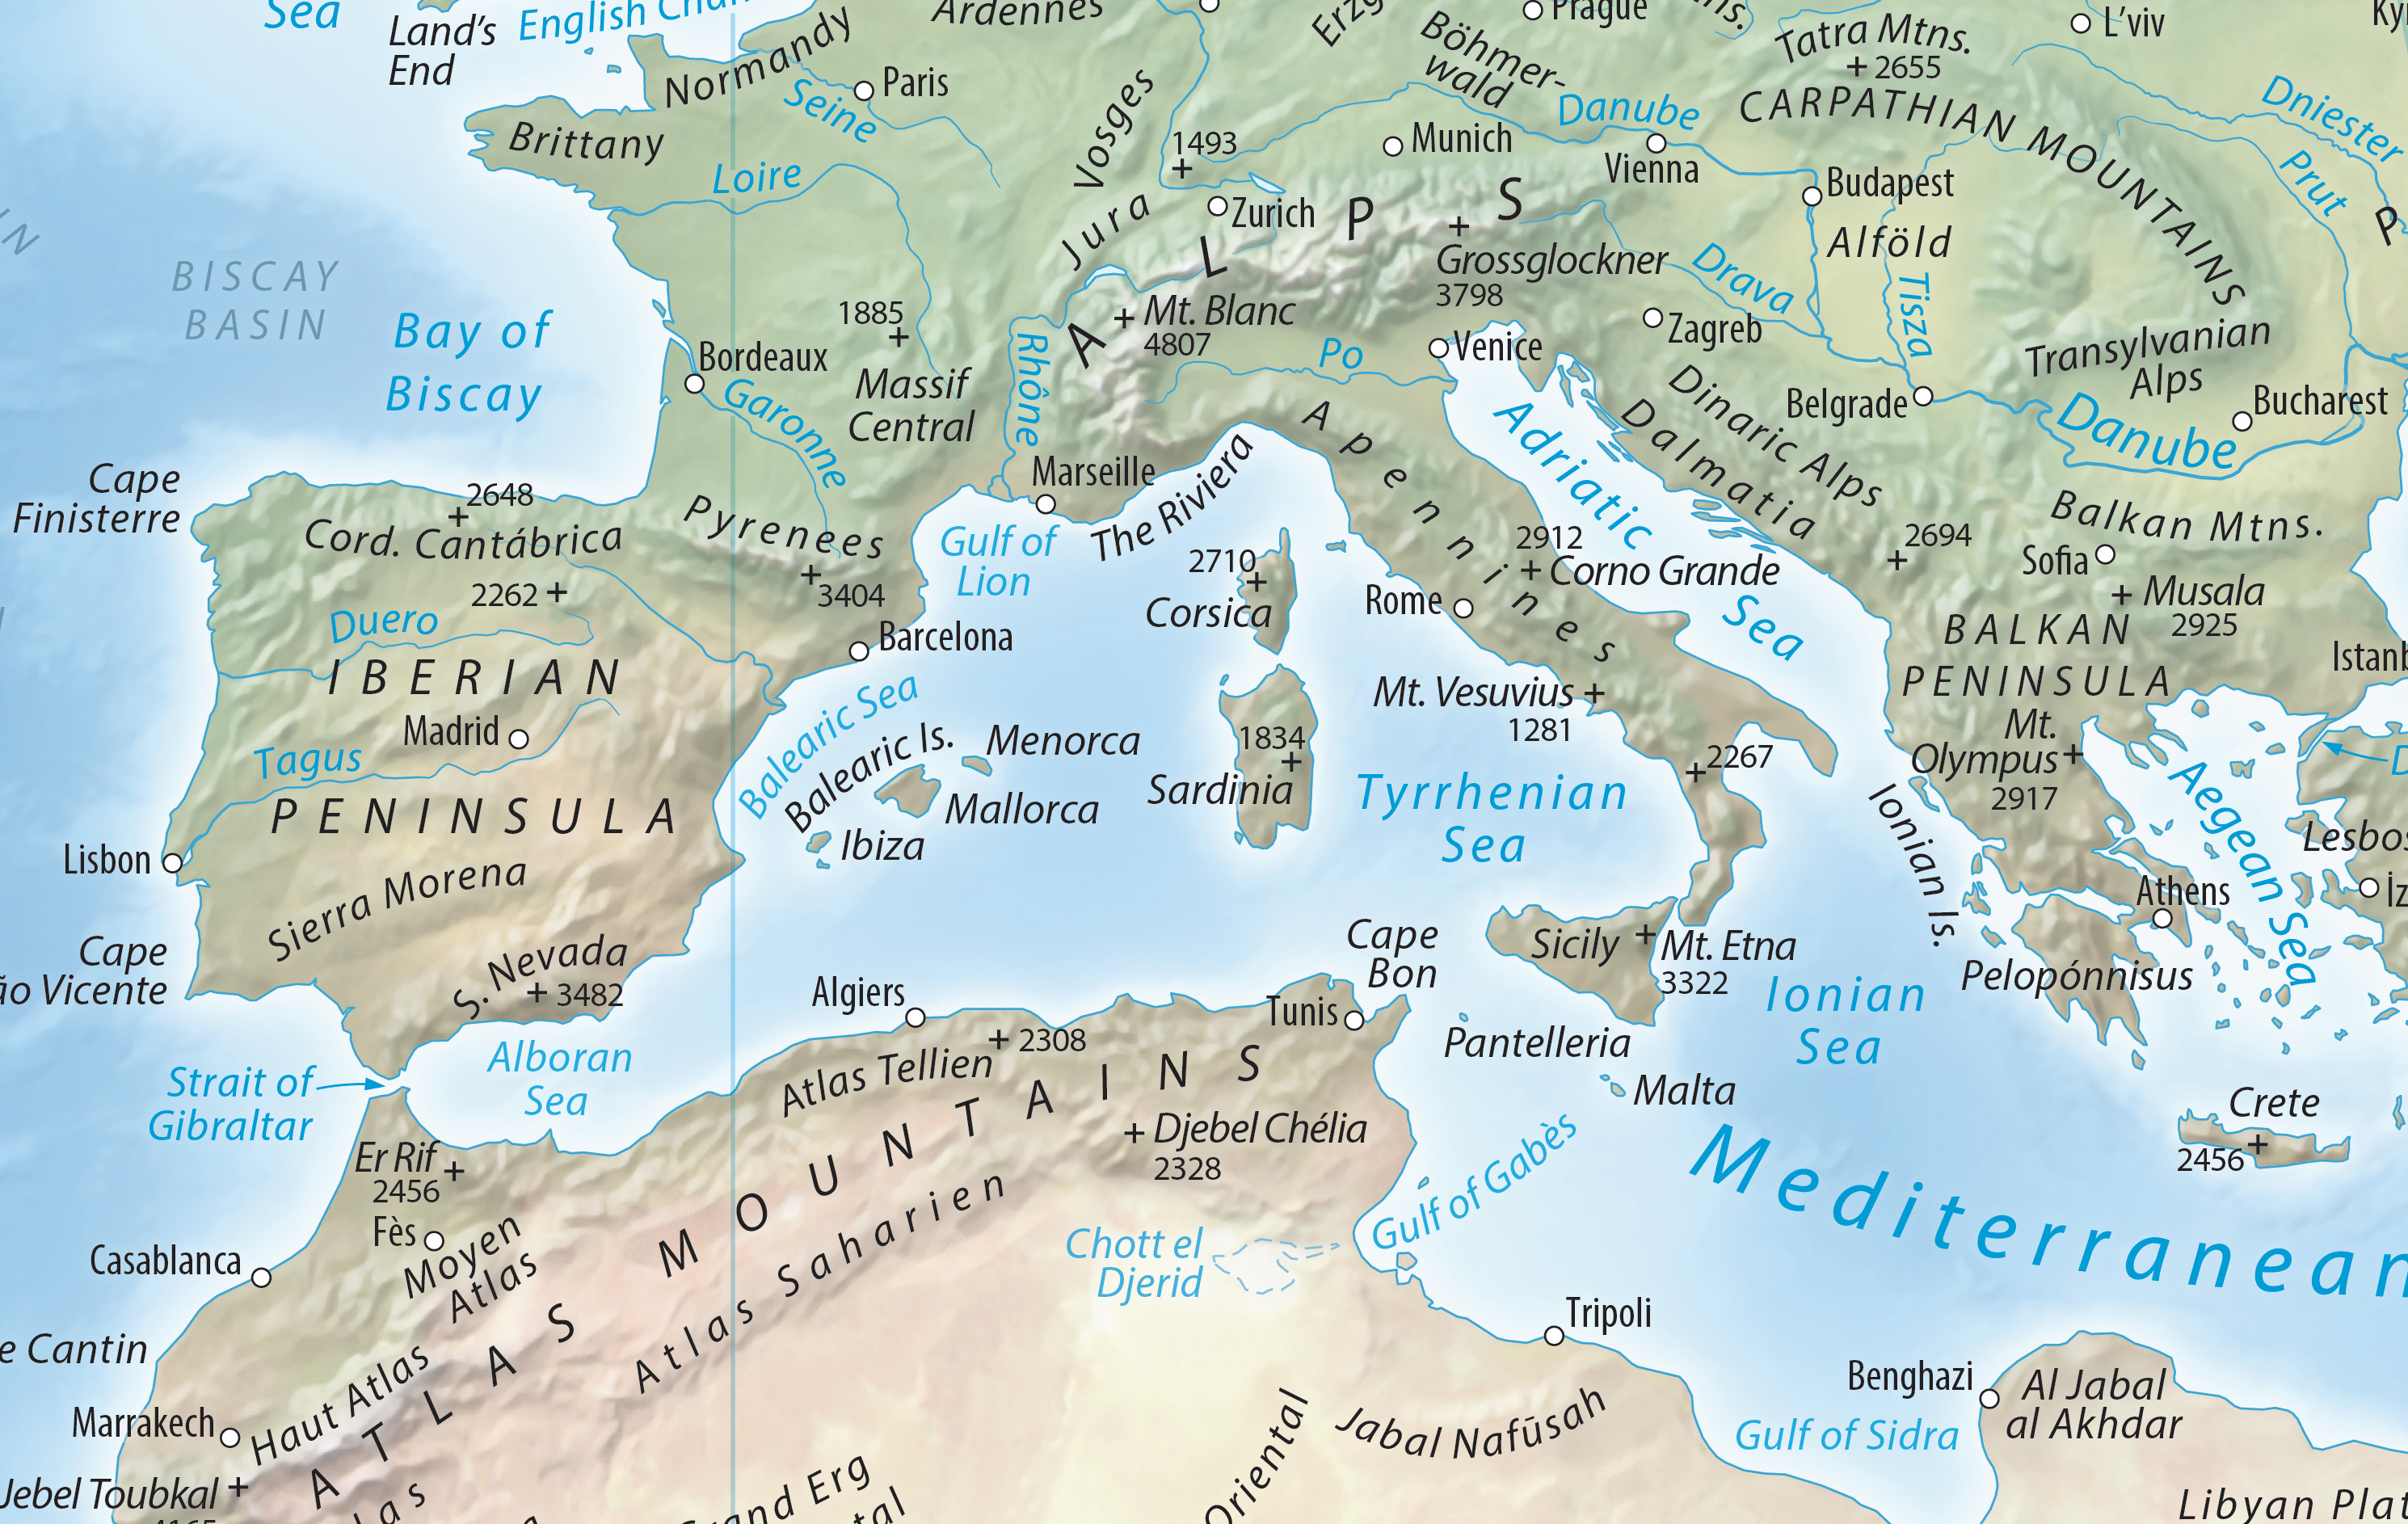
Patterson is well-known for making maps with beautiful shaded relief effects, a technique that he has focused on for his entire career. It’s something he has a passion for and is a feature that he believes makes his maps unique. “When making a shaded relief, I go to great pains to portray the natural world in a beautiful and idealized manner, by combining shaded relief with land cover data, drop shadows, gradients and vignettes, with control and restraint,” says Patterson. “I ultimately want to create a shaded relief that readers will find attractive and which will blend harmoniously with the vector elements above.” Patterson prefers light, luminous colours for depicting terrain, and also tell a story. “A map is more than just a combination of points, lines, polygons, type and pixels. To me, a really good map is one that becomes much more than the sum of these parts,” he says. “Maps are an important form of communication, and they should effectively share the ideas of the cartographer to the map reader.”
When making graphically creative maps, you want to use tools that provide you with the most control. With MAPublisher, you can easily access and manipulate geospatial data using Adobe software. “MAPublisher and Geographic Imager bridge the gulf between graphical and GIS worlds.”
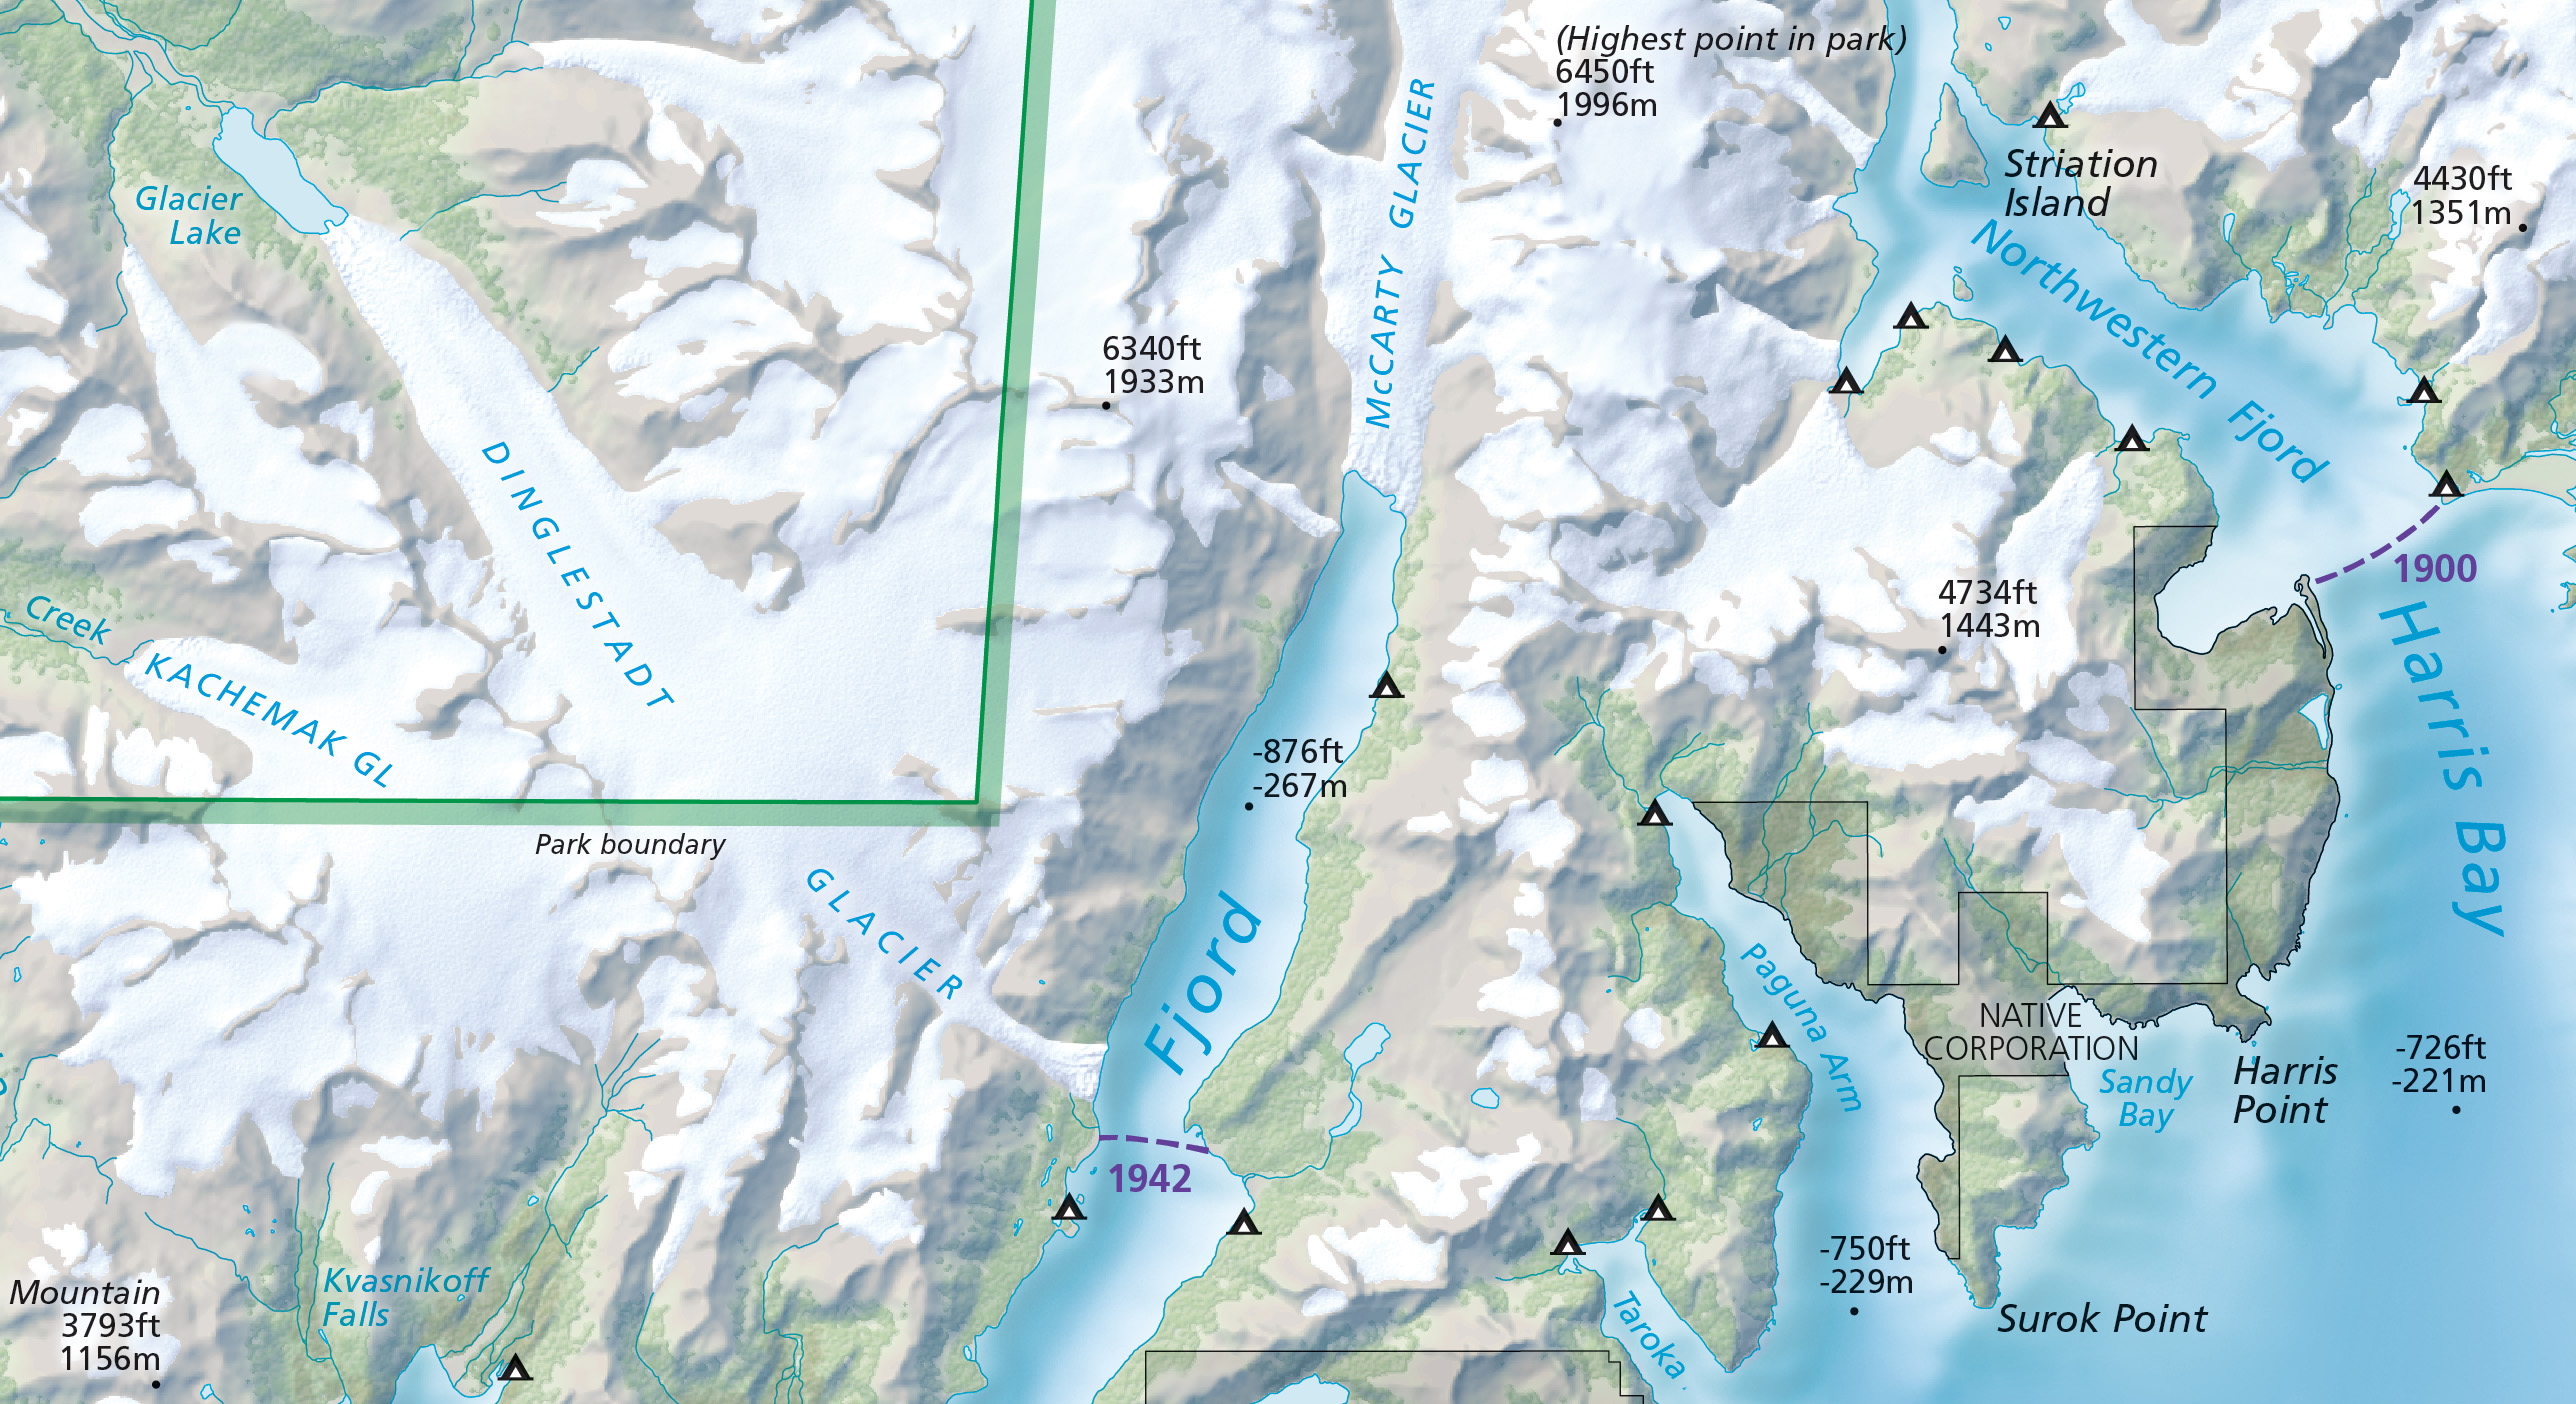
Patterson was an early-adopter of MAPublisher, a plug-in for Adobe Illustrator after learning about it in 1996 at the annual North American Cartographic Information Society (NACIS) conference. If you’ve ever used the Natural Earth data, you might be interested to know that most of the vector elements were created with MAPublisher and Adobe Illustrator.
He was also integral in the development of Geographic Imager when during a presentation about manipulating Digital Raster Elevation Model (DEM) data he commented that having a MAPublisher-like software for Adobe Photoshop would be useful. “My suggestion was heard by the President of Avenza, Ted Florence, who was in the audience. He put me in touch with the software development team at Avenza to brainstorm ideas about a GIS plug-in for Adobe Photoshop. Geographic Imager was the eventual result of our discussions.”
Along with his many contributions to the cartographic community, Patterson has held some important positions as the former president and current Executive Director of NACIS. Patterson has created accessible, open source data for global use (Natural Earth), he recently contributed to a new map projection that is taking the cartography and GIS world by storm; Equal Earth. “This equal-area pseudo-cylindrical projection has gained traction rapidly—it seems that cartographers and map users alike have had an unfilled need for world maps depicting countries at true size and presented in a pleasing manner,” he quips.
As an accomplished and respected veteran of the field, we asked that what advice Patterson would give to new cartographers, finding their way? “Seek out advice,” he states. “Map design and production is mostly a solitary task, and any map you create will seem easy-to-understand and logical to you since you are the one who made it. But, your readers may not see it that way,” says Patterson. “The easiest way to avoid these potential ‘failures to communicate’ is by showing drafts of your maps to people that are not family and close friends.”
Another tip that Patterson has for fledgeling cartographers, is to give readers a reason to slow down and read your map. “The trick in today’s media-saturated environment is to design a map that will catch your reader’s eye, ignite their curiosity, and draw them in. Give the most emphasis to the information you want them to remember long after they put down your map.”
We released an update today, to MAPublisher, our well-known cartography plug-in for Adobe Illustrator. This version features support for the Equal Earth projection, has a new look and feel that more closely matches Adobe Illustrator’s interface and includes new options for importing geospatial data into Illustrator.
Equal Earth Projection
Our partners,
Blue Marble Geographics, have added the Equal Earth Projection to their GeoCalc library, the system that we use for data reprojection and coordinate transformations. This projection is now available in MAPublisher 10.4.
An Equal Earth World Map
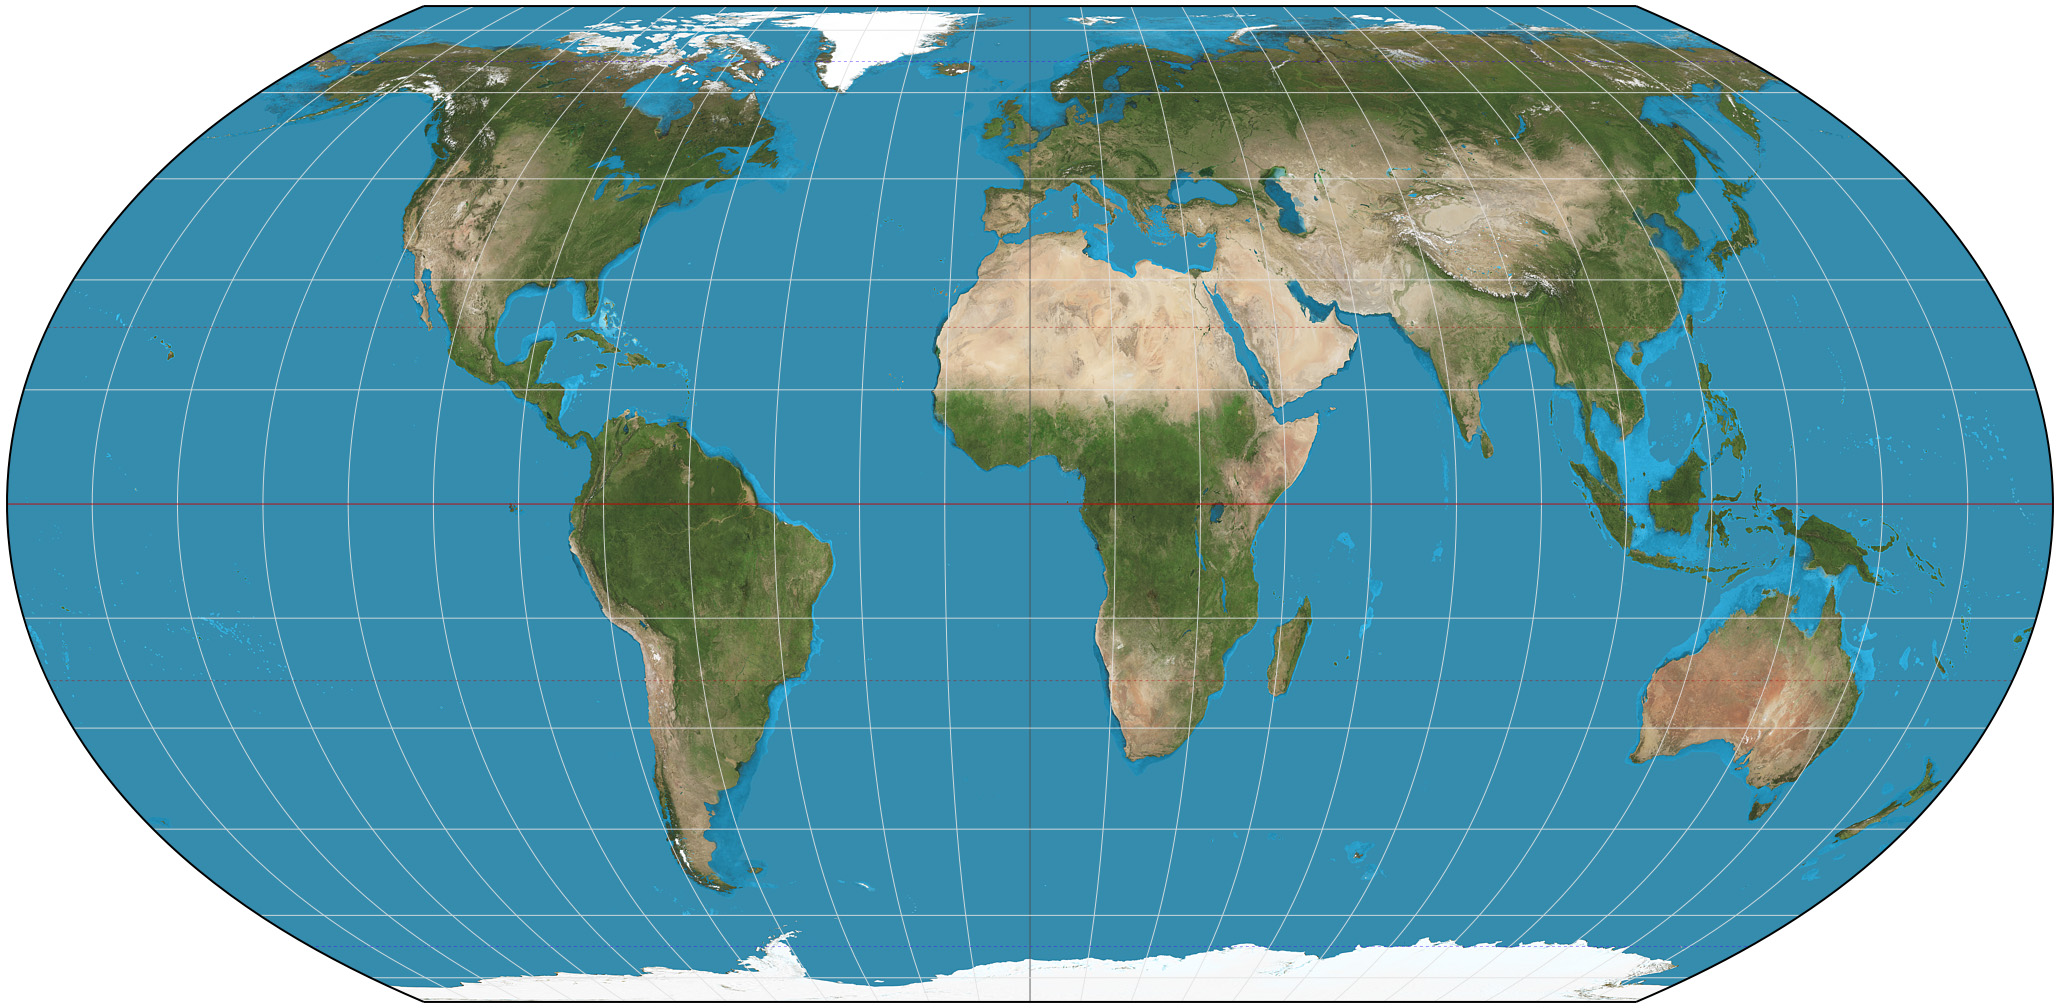
A Gall-Peters World Map
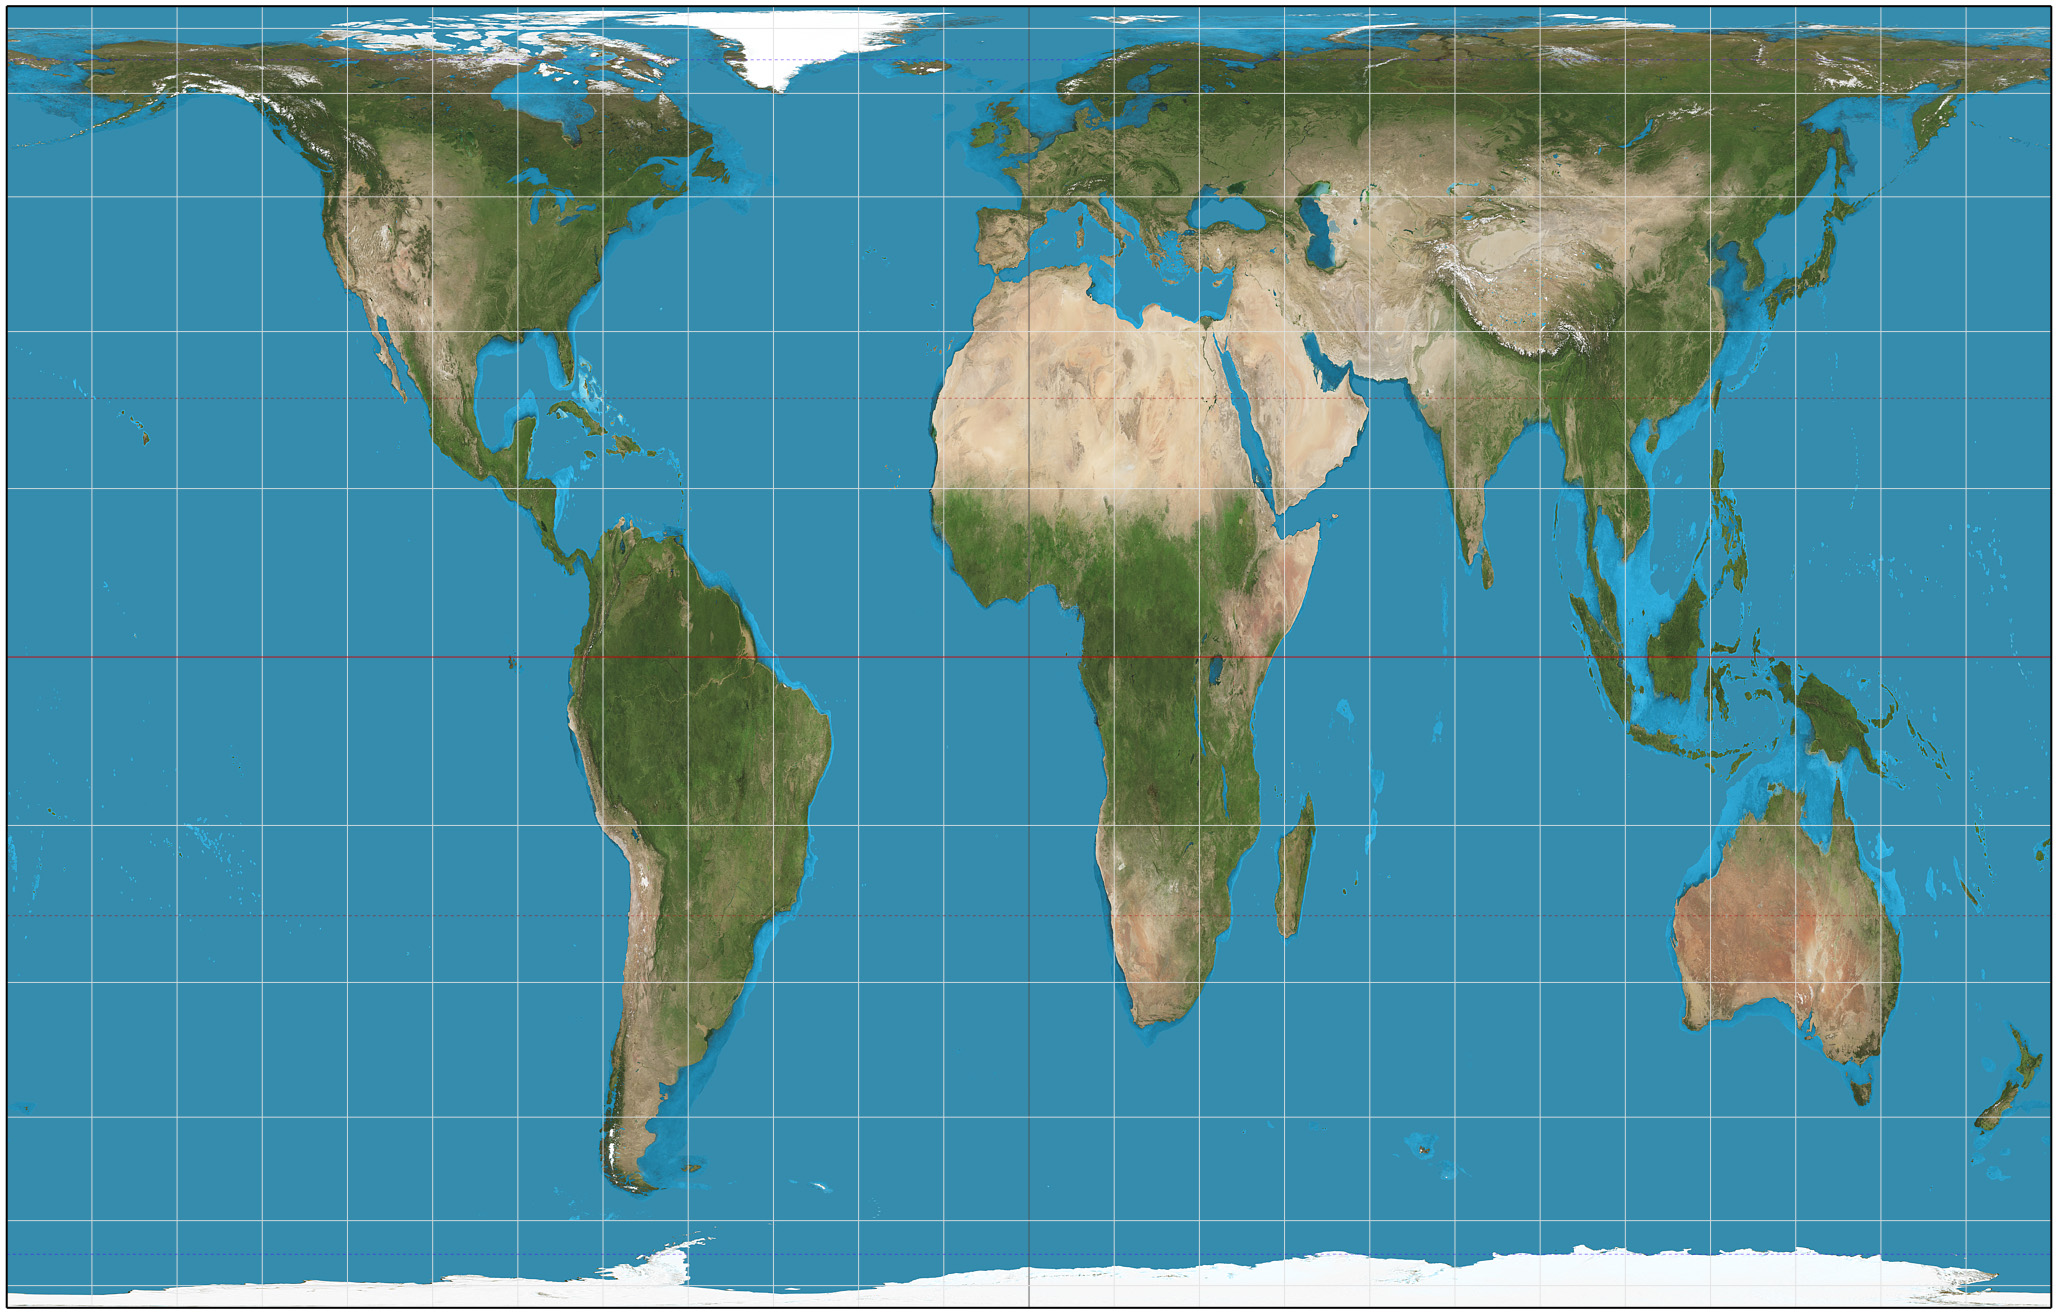

Want an Equal Earth map to experiment with? You can download MAPublisher-enabled Adobe Illustrator files at equal-earth.com
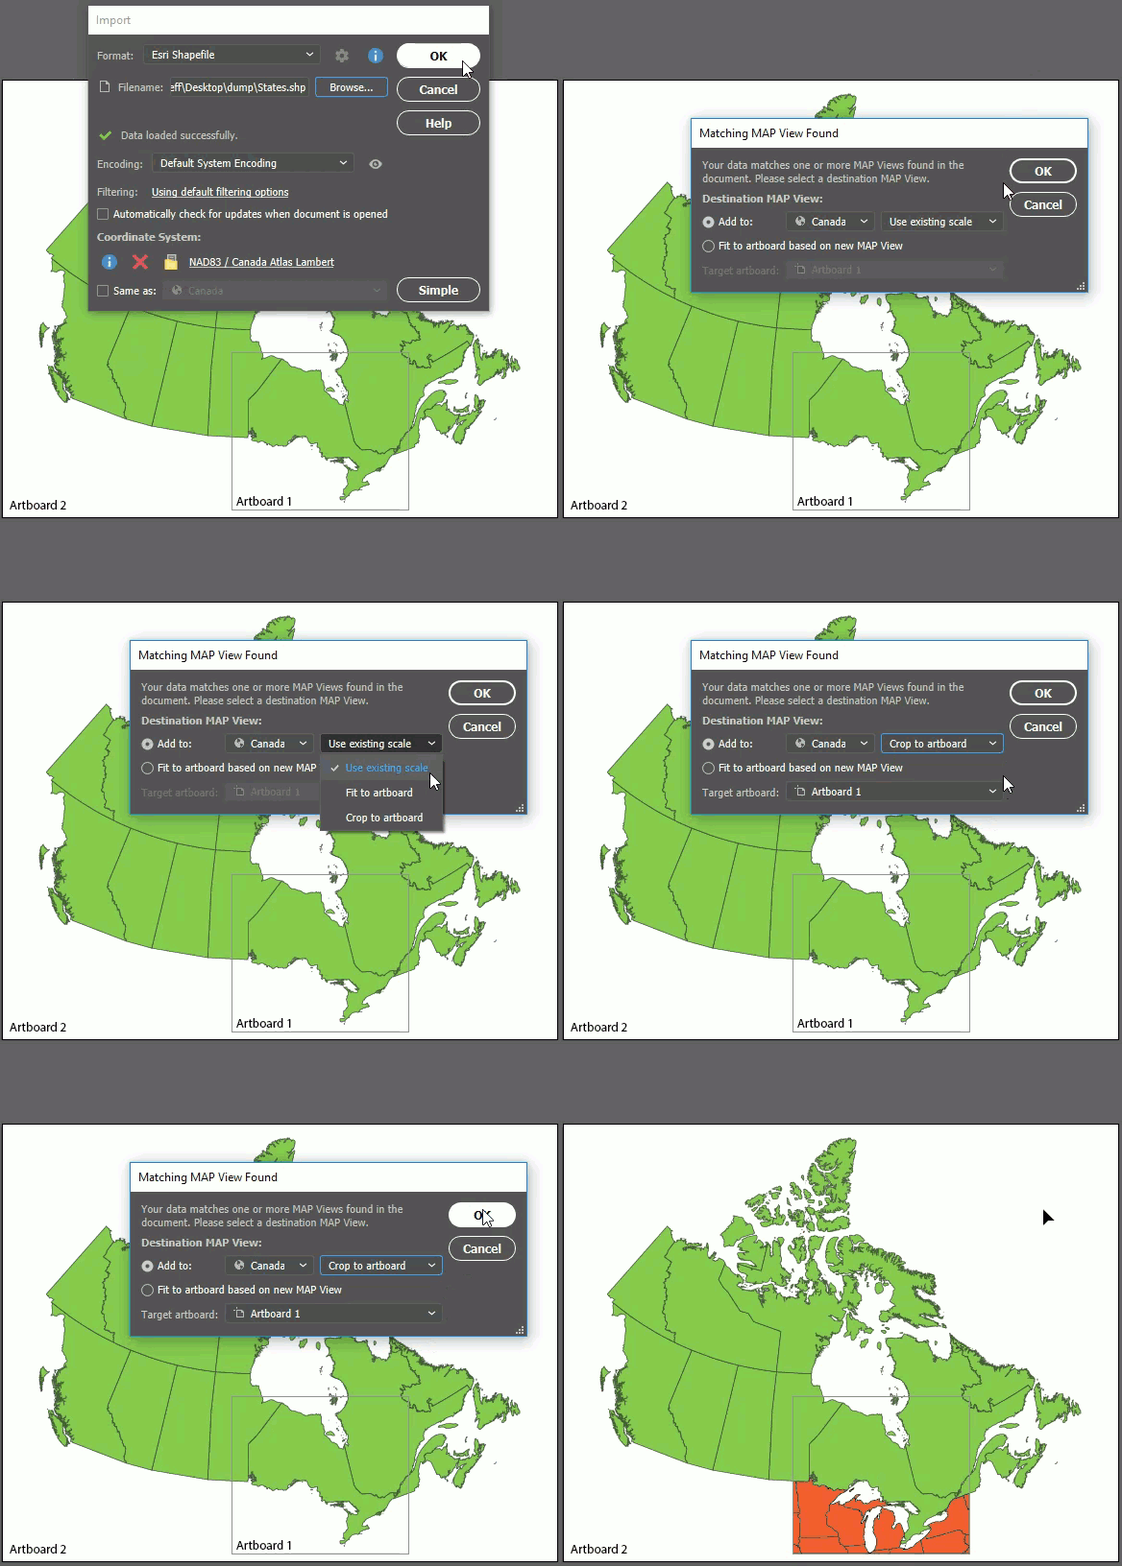
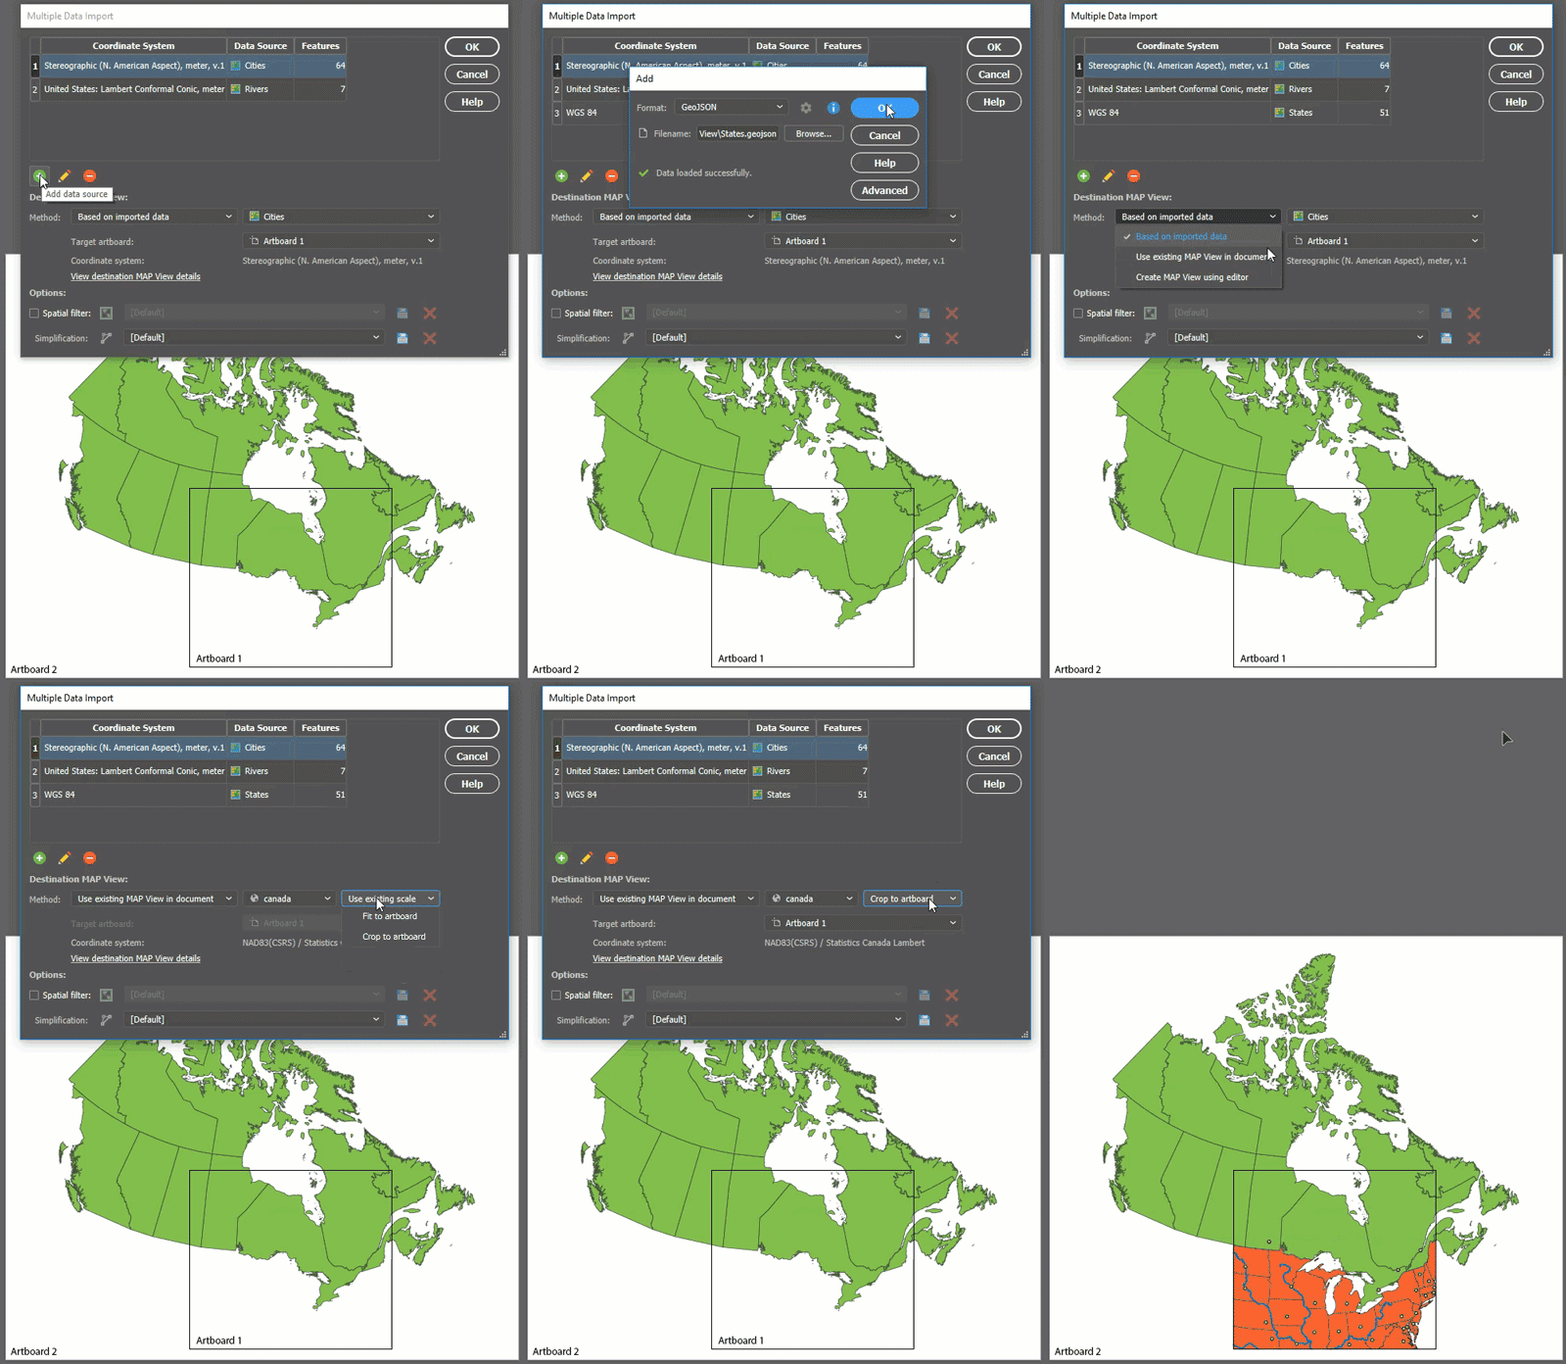
Crop to Artboard
In MAPublisher 10.4, when a matching MAP View is found while using the Import or Copy MAP Objects From tools, you can now choose to crop the added data to an artboard’s extents. This same functionality is available when specifying the destination MAP View in Multiple Data Import. Furthermore, if you don’t want to add data to the existing MAP View, you now have the option to specify which artboard the incoming data will be added to.
New Look
We’ve changed the look of the MAPublisher tools and dialogs to match the colours, fonts, and styles of the Adobe Illustrator interface. So as you use the MAPublisher tools, it feels more like you are still using Illustrator – which of course, you are! The MAPublisher tool and dialog styles will also change to match any changes in the Illustrator interface preferences. Note that the interface changes only apply to Adobe Creative Cloud versions of Illustrator, not CS6.

MAPublisher 10.4 Release Notes
- Support for Equal Earth projection
- New options available to auto-crop data when importing or copying MAP objects
- Enhanced user interface matching Adobe Illustrator interface preferences
- Various user interface and usability enhancements


