My Account     Contact Us     Cart

Articles

Accurate Georeferencing with Geographic Imager

Georeferencing is the process of adding spatial information to a physical map or raster image. Geographic Imager includes a georeferencing tool and also includes two methods of validating georeferencing so that your imagery is not only beautiful but also spatially aware (that’s two of the four keys to great maps!).

Use the Georeference feature in Geographic Imager to reference an image by establishing ground control points, choosing a transformation method, and specifying a coordinate system. It can also be used to rectify—transform or warp—an image to match the image coordinate system specified. The Validate and Show Image Extents Online tools are used to test georeferencing accuracy.

Geographic Imager - validating georeferencing accuracy

The Validate tool provides a visual comparison of the accuracy of your image to the real world. Use the Validate tool by clicking a point on the image to see the corresponding location on a web map.

The image below shows the Validate tool in action. Select the tool and click on a road intersection to open the web map with the same intersection identified. If the two don’t match, consider georeferencing again. It is good practice to test several known points on the image to ensure overall accuracy. Choose features that will be easy to identify on the web map such as road intersections, coastlines, buildings, and landmarks.


The Show Image Extents Online tool displays a rectangle representing the spatial extent of the image on the web map. Use this tool to verify that the full area covered by the image is accurate. Note that the rectangle shown on the web map will include the non-map areas of the image including the borders, legend, etc.


Geographic Imager - Show Image Extents


It’s that simple! Using Geographic Imager, you can manipulate imagery in Adobe Photoshop while now ensuring spatial integrity!

Making The Orthographic Projection in MAPublisher Work for You

The Orthographic projection is a commonly used projection by cartographers because it closely resembles the world as we know it exists – a three-dimensional sphere (sorry “Flat Earthers”). However, when MAPublisher displays the world in the Orthographic projection, it will still draw any points, lines or polygons that fall beyond the perspective’s horizon. This can create a “hollow Earth” or see-through effect that would cause confusion to the map reader.

Orthographic Projection in MAPublisher - Avenza Systems

Further confusion may arise depending on the order of the artwork within the layers, as some features that should be on the far side of the Earth may appear on top of features on the near side of the Earth. In order to prevent these inaccuracies, we need to remove the data beyond the horizon before transforming the data to the Orthographic projection. The following workflow is one example of how to overcome this limitation. It can be easily adapted for any orthographic projection with a custom latitude of origin and/or central meridian.

Step 1: Plot Your Centre Point

Import your world dataset and ensure the MAP View is in WGS84 (or you can use the world.mif file from the MAPublisher Tutorial Data folder).

Next, decide where you want the final orthographic map to be focused on. In this example, our focal point is 70°N, 100°E. Create a point layer, and plot your centre point using the MAP Point Plotter tool.

Plotting the focal point - MAPublisher

Step 2: Project to Azimuthal Equidistant Projection

Reproject the map to Azimuthal Equidistant (with a sphere-based datum). To do so, go to the MAP Views panel > Edit Map View. Enable Perform Coordinate System Transformation and click the No Coordinate System Specified hyperlink.

Under the Projected > World category, find Lambert Azimuthal Equidistant (Sphere), meter and click the Copy Object button to begin editing a copy of the existing Lambert Azimuthal Equidistant (Sphere), meter coordinate system.

Making a copy of Lambert Azimuthal Equidistant (Sphere) - MAPublisher


Side Note – Why start with the Azimuthal Equidistant projection?

The straight-line distance between the central point on the map to any other point is the same as the straight-line distance between the two points along the earth’s surface.

Furthermore, you must use the ‘Sphere’ version of the Lambert Azimuthal Equidistant projection, because the radius is equal in all directions. The other version of the projection uses an ellipsoid datum which would require more complex formulas to solve the buffer distance in Step 3.


Next On the Definition tab, set the Central Meridian to 100, and the Latitude of Origin to 70. You may rename the custom projection on the Identification tab if you wish to reuse it later. Click OK and apply the projection.

Editing the parameters of the Lambert Azimuthal Equidistant copy - MAPublisher

Step 3: Create the Horizon Line

Create the horizon line from your custom centre point. Next, add a buffer of 10,002.5 km (see note below) around your focal point.

Creating the horizon line - MAPublisher


Curious about where the buffer value comes from?

Given that we know:
Earth’s radius using Authalic Sphere is 6,371,007m
The formula for the circumference of a sphere = 2πr
The distance from the focal point to the horizon in the Azimuthal Equidistant projection = 1/4 of Earth’s circumference = C × 1/4


Relationship between Earth’s circumference and the horizon line - MAPublisher

We can first determine the circumference by:
= 2πr
= 2 × π × 6,371,007
= 40,010,000 m

Now that we know Earth’s circumference, we can determine the distance to the horizon by:
= C × 1/4
= 40,010,000 × 1/4
= 10,002,500 m or 10,002.5 km


Step 4: Convert Your Custom Horizon Line

Convert the resulting circle with four Bezier curve points to polylines using MAPublisher’s path utilities tool Convert Beziers to polylines. This is your horizon line.

Converting bezier paths to polylines - MAPublisher

Step 5: Back to WGS84 and Editing the Horizon line

Import another copy of your world file. If necessary, transform it to WGS84 and drag your horizon line into this MAP View. You can also hide or remove the Lambert Azimuthal Equidistant MAP View.

Transforming horizon line - MAPublisher

Use Illustrator’s Direct Selection Tool to select and delete the horizontal portion of the horizon polygon.

Next, use Illustrator’s Scissors Tool to cut the polyline at the artboard edge

Move the section of the curve remaining outside the artboard inside and to the opposite edge.

Adjusting the horizon line - MAPublisher

Resize the artboard to match the extents of the WGS84 MAP View. Use Illustrator’s Pen Tool rejoin the two lines into one. Continue using the Pen Tool to close the polygon by following along the edge of the artboard (result should look similar to the image below). Export the polygon area in case you need to add additional data at a later date.

Closing the horizon polygon - MAPublisher

Step 6: Crop Beyond the Horizon

Use the Crop to Shape tool to remove the features outside of the polygon.

Preparing to crop the world to the horizon polygon - MAPublisher

Crop result to the horizon polygon - MAPublisher

Step 7: Reproject the Remaining Data

After cropping, go to the MAP View and Perform Coordinate System Transformation. Choose the Orthographic, meter projection, click Copy Object to begin editing the coordinate system and put in the custom central meridian and latitude of origin you chose back at the beginning of the workflow. Once the custom Orthographic coordinate system is created, complete the MAP View transformation.

Making a custom copy of the Orthographic coordinate system - MAPublisher

Step 8: Remove Lingering Polar Points

If there are any lingering polar points, you can delete them from the horizon line manually using the Direct Selection Tool.

Cropped dataset reprojected to the custom Orthographic coordinate system - MAPublisher

You’ve successfully projected your data into a custom orthographic projection without any overlapping features from the other side of the Earth.


Enhanced Orthographic projection - MAPublisher

The best part is, all of the map features retain their attributes, so you are free to continue applying MAP Themes, generating labels, and any of the other design tools at your disposal to make your map project a work of art.


About the Author

Jeff Cable is the Quality Assurance Lead for Avenza’s desktop applications. While he primarily focuses on MAPublisher, Jeff’s formal education is in remote sensing. He hopes to utilize this knowledge in the near future to help develop Geographic Imager into a more powerful geospatial image processing suite.


Bridging the Gap Between ArcGIS and Adobe Illustrator with MAPublisher

Maybe you already know that MAPublisher has the ability to let you import shared data layers from your ArcGIS Online organizational account and to connect to publicly available map servers from various online sources. Once GIS data is imported, you can use Adobe Illustrator’s powerful design tools to style and edit your map into a thing of beauty. The ability to import from ArcGIS has been available for a while, however, it’s still a question that people ask our Support Team frequently. So, here’s a reprise of a blog post, from a while ago, that illustrates how to import layers directly from ArcGIS Online or an ArcGIS web service into Adobe Illustrator, using MAPublisher.

Esri’s ArcGIS Online is a collaborative web geographic information system (GIS) that allows you to store and share GIS data using Esri’s secure cloud. Use MAPublisher to import Feature, Map Image, and Tile layers into Illustrator without losing any georeferencing, features, or attributes. MAPublisher does not currently support the use of Map Image or Tile services that use Dynamic layers.

Importing from ArcGIS Online

To load a layer, use the MAPublisher Import tool as you would with any data type and select ArcGIS Online from the Format drop-down menu. Click the login link to enter your ArcGIS Online credentials to access your organization’s web portal.

MAPublisher Import Dialog Box

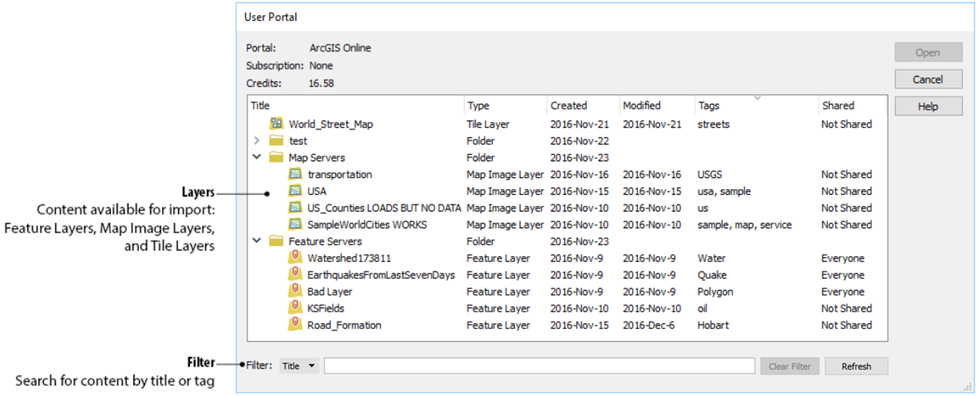
MAPublisher - Online User Portal Dialog

Feature Layers contain vector data that will import as artwork into Adobe Illustrator. You can reduce the time it takes to import by filtering the data first, isolating only the layers that you need.

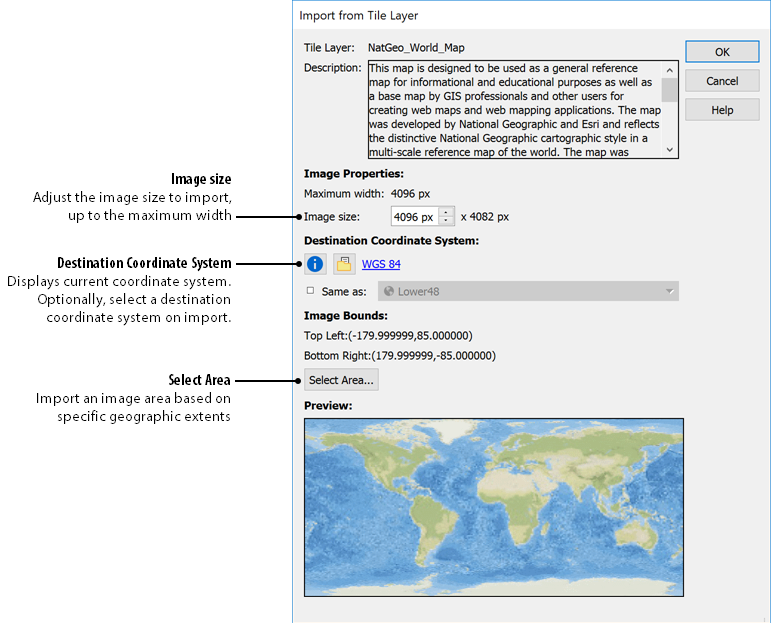
Map Image Layers and Tile Layers are raster data layers that can be added by selecting the geographic extents.

Import from Map Image Layer

Importing from a Web Service

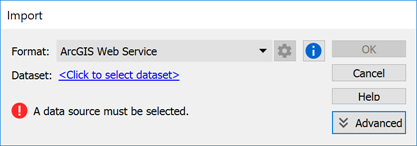
In addition to using your organization’s data, you can get publicly available data by connecting to an ArcGIS Web Service. To connect to a web service, use MAPublisher Import and select ArcGIS Web Service from the Format drop-down menu. Click to select the dataset and enter the URL for the service. This is a great option when searching for data from open data portals created by government agencies.

Import from Web Service

Import from ArcGIS Web Service

Connect to ArcGIS dialog

MAPublisher bridges the gap that exists between Esri’s Online services and the full-featured design environment of Adobe Illustrator. You can leverage Illustrator’s tools on GIS data shared within your organization, or from a publicly available source to make better, more beautiful maps.

News Archive

Blog Archive

December 2024 (2)
November 2024 (2)
October 2024 (1)
September 2024 (1)
August 2024 (2)
July 2024 (1)
September 2024 (1)
June 2024 (1)
July 2024 (1)
May 2024 (1)
April 2024 (2)
May 2024 (1)
March 2024 (2)
February 2024 (1)
January 2024 (1)
December 2023 (1)
November 2023 (2)
October 2023 (2)
September 2023 (1)
August 2023 (1)
July 2023 (3)
June 2023 (1)
February 2023 (1)
January 2023 (2)
December 2022 (1)
November 2022 (2)
October 2022 (2)
September 2022 (1)
May 2023 (1)
August 2022 (2)
July 2022 (1)
June 2022 (2)
May 2022 (1)
February 2022 (1)
January 2022 (2)
August 2022 (1)
December 2021 (3)
November 2021 (5)
October 2021 (1)
September 2021 (3)
August 2021 (2)
July 2021 (1)
June 2021 (2)
May 2021 (2)
April 2021 (2)
March 2021 (3)
April 2021 (1)
February 2021 (1)
January 2021 (1)
November 2020 (1)
October 2020 (1)
June 2020 (2)
May 2020 (1)
April 2020 (3)
March 2020 (2)
December 2019 (1)
November 2019 (2)
September 2019 (1)
August 2019 (1)
July 2019 (1)
June 2019 (3)
May 2019 (4)
April 2019 (2)
March 2019 (1)
February 2019 (2)
January 2019 (3)
December 2018 (2)
November 2018 (1)
October 2018 (1)
September 2018 (2)
August 2018 (4)
July 2018 (2)
June 2018 (1)
July 2018 (1)
June 2018 (4)
May 2018 (1)
April 2018 (2)
March 2018 (4)
February 2021 (1)
February 2018 (1)
January 2018 (1)
November 2017 (1)
October 2017 (2)
August 2017 (2)
July 2017 (1)
March 2017 (1)
February 2017 (2)
January 2017 (2)
November 2016 (1)
January 2017 (1)
November 2016 (1)
October 2016 (2)
May 2016 (1)
March 2018 (1)
April 2016 (2)
December 2015 (2)
June 2015 (1)
May 2015 (1)
April 2015 (2)
December 2014 (4)
October 2014 (2)
May 2014 (4)
February 2014 (1)
October 2013 (3)
April 2013 (1)
January 2013 (2)
August 2012 (1)
October 2012 (1)
July 2012 (3)
May 2012 (2)
January 2012 (2)
August 2011 (1)
July 2011 (2)
June 2011 (2)
May 2011 (2)
March 2011 (1)
February 2011 (1)
January 2011 (5)
December 2010 (1)
November 2010 (1)
December 2010 (1)
November 2010 (1)
October 2010 (1)
August 2010 (4)
July 2010 (2)
June 2010 (3)
May 2010 (2)
April 2010 (2)
March 2010 (2)