My Account     Contact Us     Cart

Articles

Difference Between Lines and Tracks When Exporting from Avenza Maps

There are two methods of exporting GPS tracks from Avenza Maps in KML format: as a line and as a track. Which option to select depends on the intended purpose. Lines are much simpler than tracks and store only the position of each vertex in the line as latitude longitude and elevation. Tracks contain a complete description of how the path moves through space including the position at one-second intervals, the time at which each position was recorded, the compass angle of the heading, and the velocity. Lines take up much less storage space than tracks. To switch between exporting to Lines or Tracks, select Track Export in the Export Settings screen.

Export Settings screen

Tracks are useful in applications where the GPS position at a given time and space is important. For example, in Google Earth there is an option to record a tour that moves to predetermined places on the globe. This would be useful if you wanted to follow along on a hiking path or do a virtual walkthrough of a proposed building development. To make a tour from a track, open the KML file in Google Earth, select the track in the places panel, and click the Play Tour icon. The animation below shows a walk through Mount Pleasant Cemetery in Toronto, Canada. Lines contain only the location information: latitude longitude and elevation. Export to line when the time data is not important such as if you are making a map of a hiking trail.

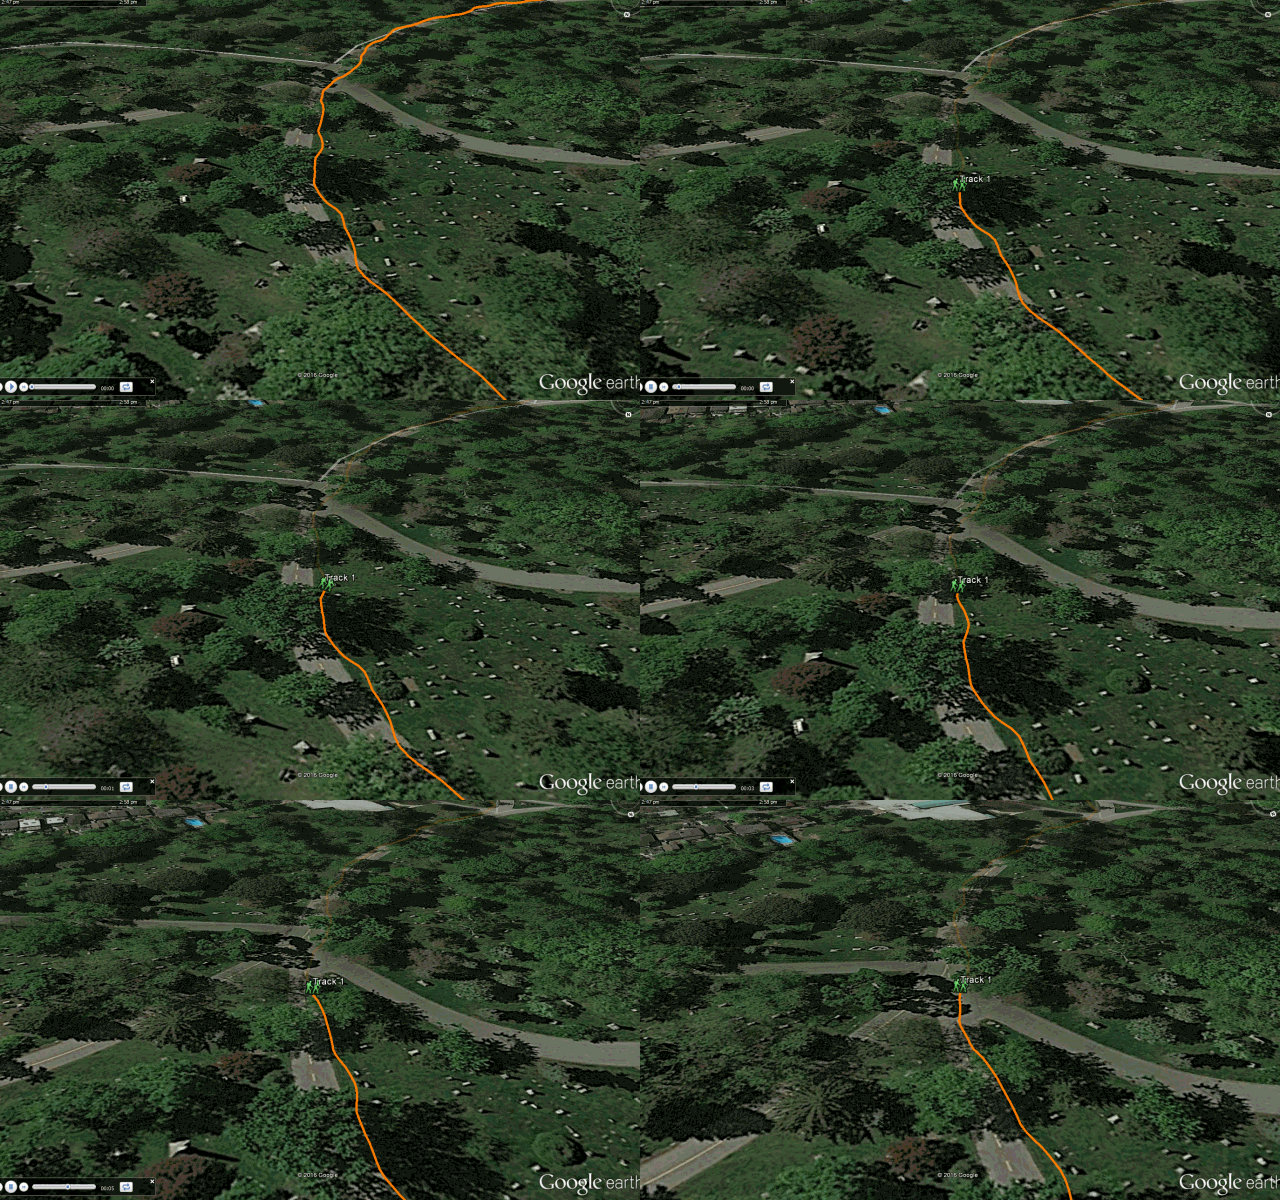
Play tour in Google Earth
A tour of Mount Pleasant Cemetery in Toronto, Canada using Google Earth

KML Code for Lines and Tracks

KML (short for Keyhole Markup Language) is an XML notation for displaying spatial data in web applications. It was developed for use with Google Earth and can be read by many programs. Avenza Maps uses KML to import and export placemarks, lines, and tracks. You can view and modify KML files in any text editor. The KML element used for lines is called a Linestring which is defined as “a connected set of line segments”. A Linestring element contains a coordinates tag which is a list of longitude and latitude positions in decimal degrees and elevations in meters.

KML Linestring code sample

Tracks use the KML element “gx:Track” which contains several tags.

  1. when – the date and time a point was recorded in UTC
  2. gx:coord – the location of the point in decimal degrees and the elevation in meters
  3. gx:angle – the current heading in compass degrees (i.e. 0 degrees is north, 90 is degrees east and so on)
  4. gx:value tag defined as “speed” – the current speed in meters per second

There are equal numbers of each of these tags. A full description of the vertex includes all the tags in the same sequence. For instance, the first when tag, coord tag, angle tag, and speed tag, describe the first vertex in the track.

Track KML code sample


Isolating and Displaying Specific Grid and Graticule Lines

MAPublisher Grids and Graticules is a powerful tool. There are dozens of settings to create an indexed grid, measured grid, or graticule exactly the way you want. We often receive questions about how to create certain grid and graticule styles and this was interesting. We were asked how to create a graticule to display a very specific latitude and longitude, perhaps even by itself (only a single line of latitude or longitude).

Creating a single graticule line

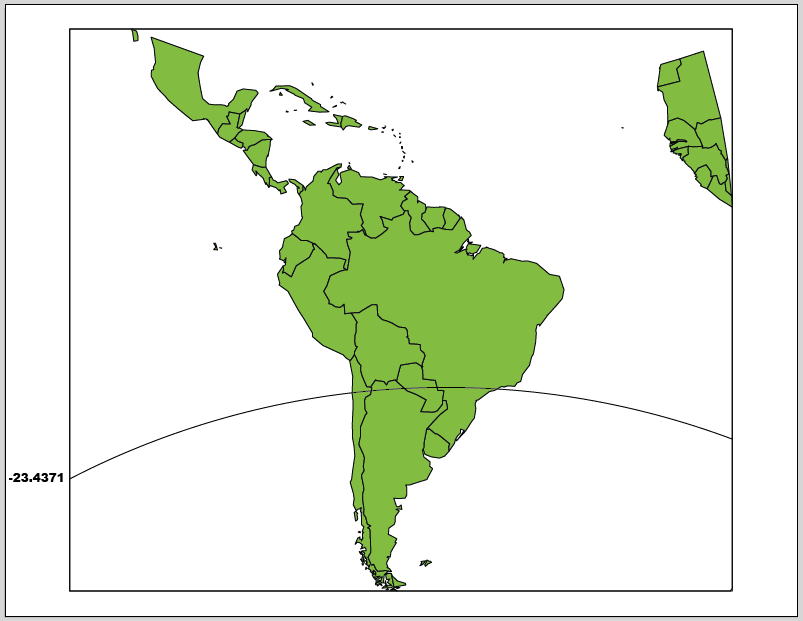
In this example, we’re going to create a graticule that will only display the Tropic of Capricorn at -23.4371 degrees (or 23.4371 degrees south of the equator).

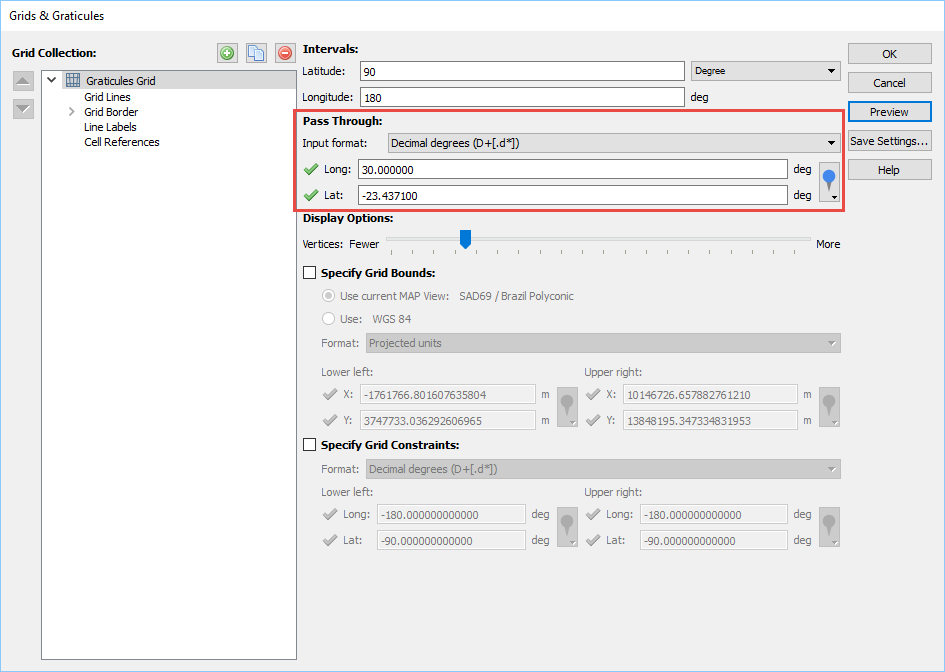
On the MAPublisher toolbar, click the Grids and Graticules button to open the dialog box. Click the Graticules button to create one. On the Graticules Grid main settings, the important setting to note here is the Pass through section — it specifies lines of latitude and longitude that must be included in the graticule. Enter 30 deg Long and -23.4371 deg Lat. This means that a graticule line must pass through -23.4371 degrees latitude (the Tropic of Capricorn). The reason why a line at 30 deg longitude is specified is to hide it from the map view (it is placed at 30 deg longitude outside of the map extent).

Pass through setting

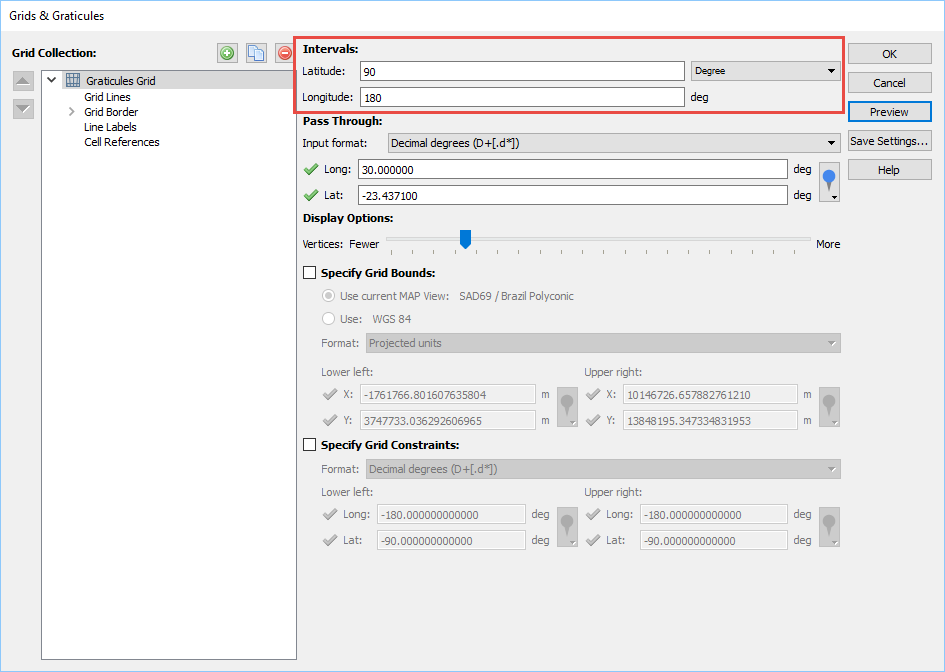
In the Intervals section, set 90 deg Latitude interval and 180 deg Longitude interval. Because the intervals are at the extreme, this means that the the only lines left to display are the ones specified in the Pass through section (30 deg long and -23.4371 deg lat). In this case, it will only display a single line of latitude (the Tropic of Capricorn) for the graticule.

Intervals setting

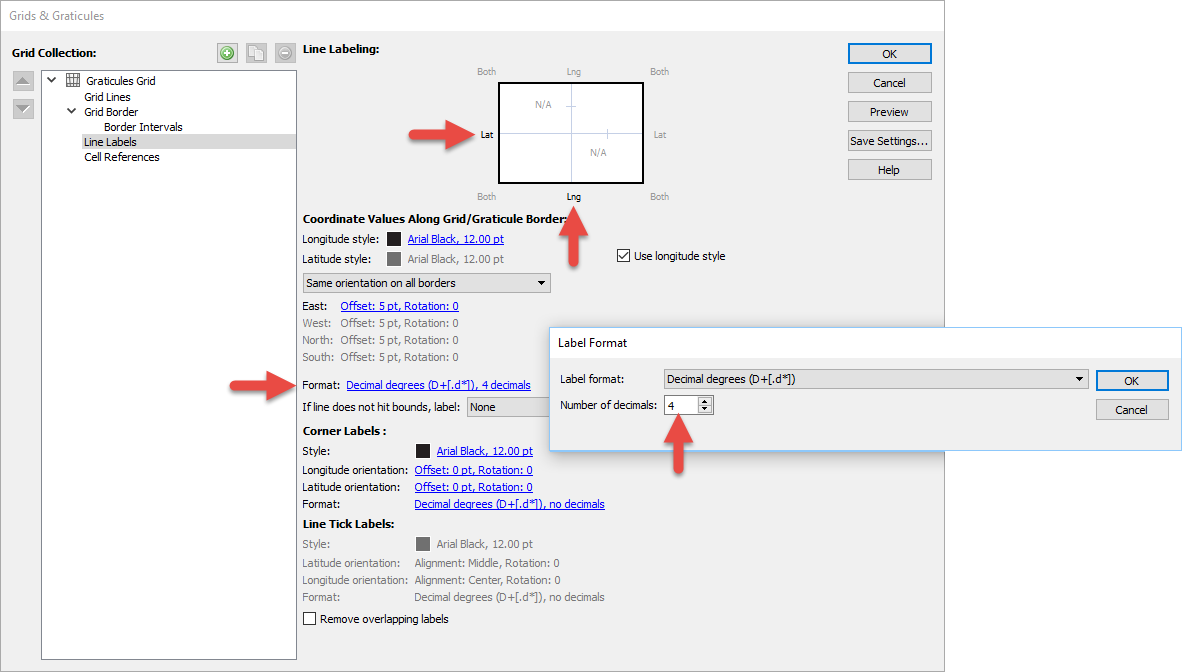
If you want to label the graticule, go to the Line Labels setting. Click the Lat and Lng on the grid label control to enable them. To control how many decimals are displayed, click the Format setting, then change the number of decimals to something greater than 0.

Label settings

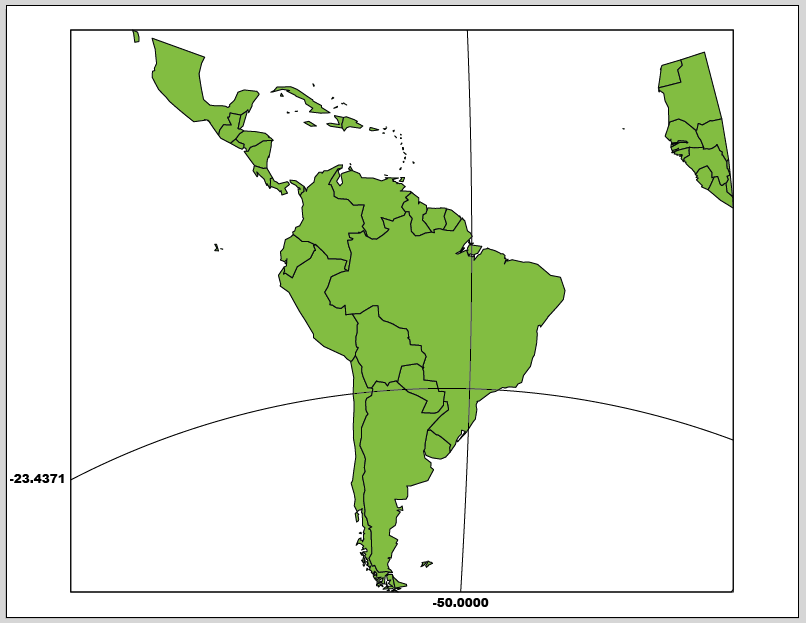
To intersect single lines of longitude and latitude, adjust the Pass through setting so that the line is within the map’s extent. In this case, it was set to -50 deg (50 deg west).

Intersect single lines of longitude and latitude

Remember that you can share Grids and Graticules settings with anybody by clicking the Save Settings button, selecting a destination folder and sharing the configuration files.

News Archive

Blog Archive

December 2024 (1)
November 2024 (1)
October 2024 (1)
November 2024 (1)
September 2024 (1)
August 2024 (2)
July 2024 (1)
September 2024 (1)
June 2024 (1)
July 2024 (1)
May 2024 (1)
April 2024 (2)
May 2024 (1)
March 2024 (2)
February 2024 (1)
January 2024 (1)
December 2023 (1)
November 2023 (2)
October 2023 (2)
September 2023 (1)
August 2023 (1)
July 2023 (3)
June 2023 (1)
February 2023 (1)
January 2023 (2)
December 2022 (1)
November 2022 (2)
October 2022 (2)
September 2022 (1)
May 2023 (1)
August 2022 (2)
July 2022 (1)
June 2022 (2)
May 2022 (1)
February 2022 (1)
January 2022 (2)
August 2022 (1)
December 2021 (3)
November 2021 (5)
October 2021 (1)
September 2021 (3)
August 2021 (2)
July 2021 (1)
June 2021 (2)
May 2021 (2)
April 2021 (2)
March 2021 (3)
April 2021 (1)
February 2021 (1)
January 2021 (1)
November 2020 (1)
October 2020 (1)
June 2020 (2)
May 2020 (1)
April 2020 (3)
March 2020 (2)
December 2019 (1)
November 2019 (2)
September 2019 (1)
August 2019 (1)
July 2019 (1)
June 2019 (3)
May 2019 (4)
April 2019 (2)
March 2019 (1)
February 2019 (2)
January 2019 (3)
December 2018 (2)
November 2018 (1)
October 2018 (1)
September 2018 (2)
August 2018 (4)
July 2018 (2)
June 2018 (1)
July 2018 (1)
June 2018 (4)
May 2018 (1)
April 2018 (2)
March 2018 (4)
February 2021 (1)
February 2018 (1)
January 2018 (1)
November 2017 (1)
October 2017 (2)
August 2017 (2)
July 2017 (1)
March 2017 (1)
February 2017 (2)
January 2017 (2)
November 2016 (1)
January 2017 (1)
November 2016 (1)
October 2016 (2)
May 2016 (1)
March 2018 (1)
April 2016 (2)
December 2015 (2)
June 2015 (1)
May 2015 (1)
April 2015 (2)
December 2014 (4)
October 2014 (2)
May 2014 (4)
February 2014 (1)
October 2013 (3)
April 2013 (1)
January 2013 (2)
August 2012 (1)
October 2012 (1)
July 2012 (3)
May 2012 (2)
January 2012 (2)
August 2011 (1)
July 2011 (2)
June 2011 (2)
May 2011 (2)
March 2011 (1)
February 2011 (1)
January 2011 (5)
December 2010 (1)
November 2010 (1)
December 2010 (1)
November 2010 (1)
October 2010 (1)
August 2010 (4)
July 2010 (2)
June 2010 (3)
May 2010 (2)
April 2010 (2)
March 2010 (2)