The Mosaic function in Geographic Imager merges multiple georeferenced images together to create a single composite georeferenced image. Though the goal of the mosaic is to create a single and seamless composite image, combining images with the Mosaic tool will often result in a slight shift of the imagery due to differences in the original pixel registration grid. This means that even when images are in the same coordinate system with the same spatial resolution, error can still be introduced because of a difference in the pixel alignment. Due to this, mosaicking processes in general tend to produce results that may be very close, but not exact. With this in mind, the results of your mosaic may be improved by resampling your images beforehand to the smallest unit of the resolution.
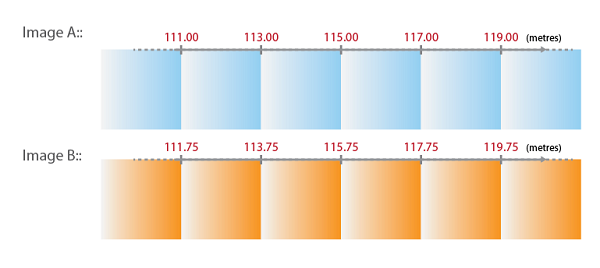
As an example, let’s say we have an image where the pixel size is 2.00 metres. When plotting the X coordinates of every pixel in this image (using the top left corner of the pixel), the X coordinate value will be incremented by the number/distance of the pixel size. For example, if the X coordinate values were to start at 111.00, then the next pixel would be 113.00, 115.00, 117.00, and so on. It’s important to note that these coordinate values are discrete, which means that the values could not be 113.22 or 115.77 because the origin of the coordinate in this case starts at 111.00 metres.

Now, we have another image that we want to mosaic with the first image. In this instance, the first image will be “Image A” and the second image will be “Image B”. Image B has the same coordinate system as well as the same pixel size as Image A.
Take a look at the X coordinates in Image A and Image B below:

We can see that the X coordinate in the top-left corner is different between these two images, and as previously mentioned, we know that the X coordinate values are discrete. When mosaicking Image B to Image A, the X coordinate cannot be 111.75 or 113.75. The coordinates must be 111.00, 113.00, 115.00, and so on, following the pattern of the pixel grid values in Image A.
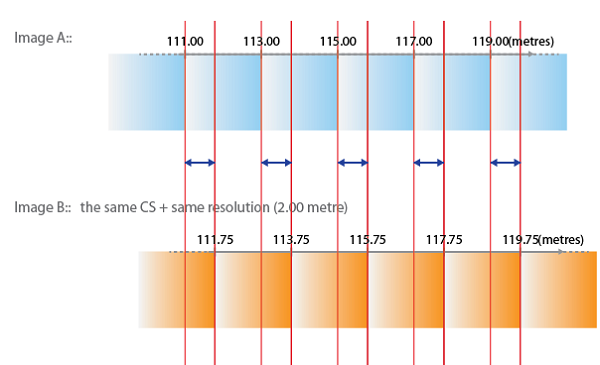
This means that Image B will need to be “shifted” or “snapped” to the closest coordinates when the mosaic is performed, see below:

As a result, the X coordinate of Image B will be shifted by 0.75 metres (less than half a pixel). The pixel with X coordinate 111.75 is now placed at 111.00 and the next pixel with X coordinate of 113.75 will now be placed at 113.00, and so on.
With this in mind, the results of your mosaic may be improved by resampling your images to the “smallest unit of the resolution”. The smallest unit of the resolution can be determined from the difference in the coordinates (spatial alignment difference) between the two images.
Looking back at our example, we can see that the smallest unit of the resolution (represented by the blue arrow) in this case is 0.75 metres – this is the value we will use to resample our images.
Once the images have been resampled to 0.75 metres, we may go ahead with our mosaic.
The above example demonstrates the possibility of a pixel shift after a mosaic for two images with a different pixel alignment. It should be noted that this example explains the problem in one-dimension (looking at only the X coordinate) when the image in reality is in two-dimension (looking at both X and Y coordinates). The basic principal of the pixel shift in 2D is the same, but it would include the direction of the shift when mosaicking images. In addition, it’s important to keep in mind that although resampling your images to the smallest unit of the resolution will improve the final mosaic, this is not always an efficient process when mosaicking with more than two images. Another thing to remember is that resampling your images will make your file size much larger. However, in cases where high precision is desired, resampling the images beforehand is a process that should be considered.


 We have a CSV file containing points for large cities that we’d like to add to the map. We know from our data source that the CSV uses the WGS84 coordinate system. After selecting the file for import, the MAPublisher Import dialog box helpfully notifies us that some required settings are missing. We’ll click the blue ‘Required settings are missing’ link to continue.
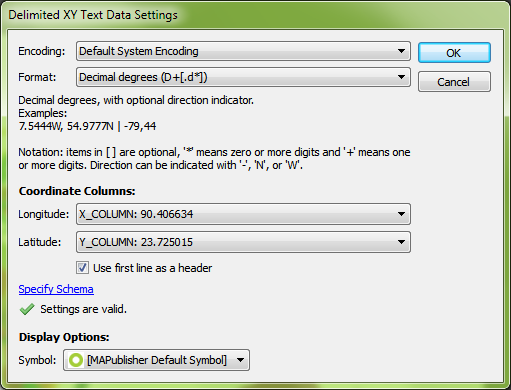
 Setting up the import, the coordinate column settings are easy since we have an X_COLUMN and a Y_COLUMN, but we can’t forget to check that the format is correct. The default is Projected units, but we know the file uses WGS84, and can tell by the numbers in the column that the coordinates are in decimal degrees, so we’ll change the format to reflect this information and click OK.
 Back at the import window, we see the message ‘Data loaded successfully’. Great! Let’s click OK and add the large cities to the map.
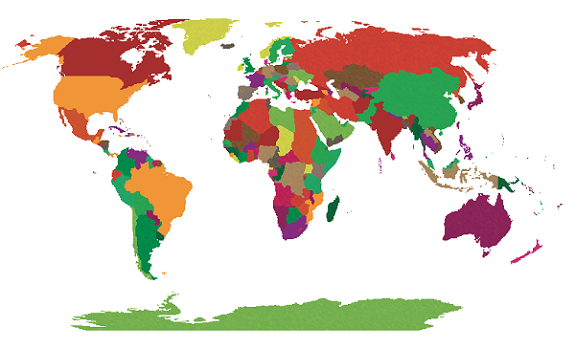
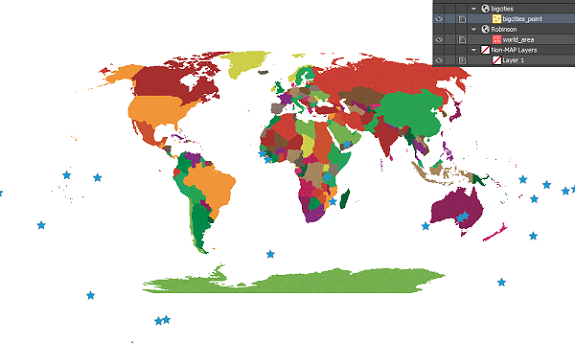
 The data has been imported but the result isn’t what we expected. The new layer has been added to a new MAP View, so let’s try dragging it into the Robinson MAP View with the world map.
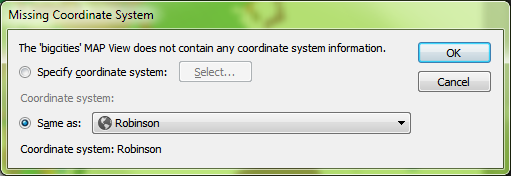
 We get a prompt saying that there isn’t any coordinate system information. We want it to be in Robinson like the rest of the map so we’re going to leave the default setting of Same as: Robinson.
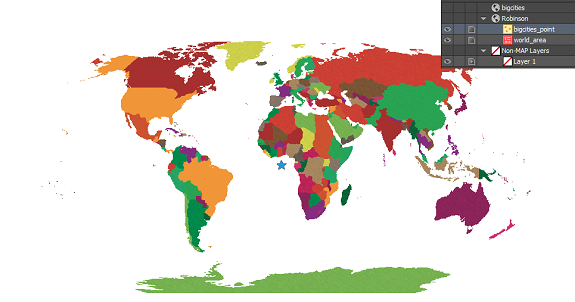
 The data has moved, but it still doesn’t look like we were expecting. Where did we go wrong here?
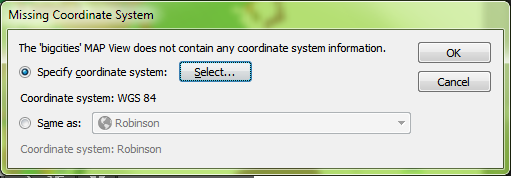
 There are actually two places in the workflow where we could have avoided this common mistake. When we dragged the point layer into the Robinson MAP View, the pop-up dialog box prompted that a coordinate system wasn’t specified. We specified Same as: Robinson, thinking this was the correct choice, but we had already determined during import that the CSV was in WGS84. What we should have done here was to specify the coordinate system as WGS84.
 The other place where we could have avoided this error was right after setting up the CSV file for import. In MAPublisher 9.4, there’s a new button on the Import dialog box that allows you to see more detailed information about files being imported. By clicking the Advanced button in the Import dialog box, we would have noticed that there was no coordinate system specified.
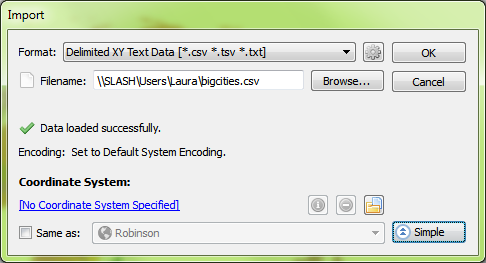 Even here, it might have been tempting to choose Same as: Robinson to add it to the Robinson MAP View, but this would import the points exactly the same as before – all in one location in the middle of the map. Instead, what we want to do is click the blue ‘No Coordinate System Specified’ link and choose WGS84. After this is set up, we’ll click OK to add the data to the map.
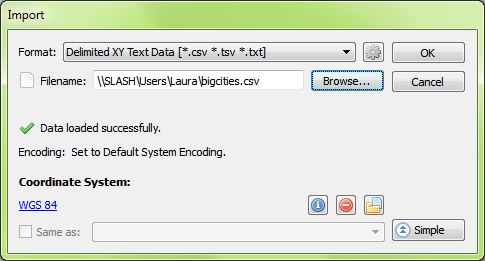 The data still isn’t quite right – it looks the same as when we first imported it. But again we notice that it has been imported into a new MAP View, so we’re going to drag the layer into the Robinson MAP View and see what happens.
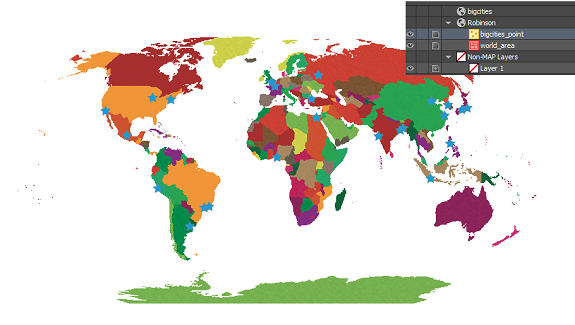 Mistakes during data import are common amongst GIS users, especially those who are just starting out. In the first scenario, when we imported the CSV and added the data directly to the Robinson MAP View, we thought we were telling MAPublisher that we’d like it to match up with the map. What we really did was tell MAPublisher that the data was already in the Robinson projection, even though we knew it was in WGS84. What we should have done first was to define the projection by telling MAPublisher what coordinate system the data is already using. Once MAPublisher knows what system the data is starting in, we can then ask it to project or transform the data into the coordinate system that we’d like to use.