My Account     Contact Us     Cart

Articles

Styling a MAPublisher Scale Bar

After generating a scale bar, it is placed in a MAP Legend layer. You can accept the default look of it, but majority of users will want to customize and style it to match their map.

Now I’ve just generated a simple scale bar. If you expand the Legend layer, you can see the object “MAPublisher Scalebar” is placed within it. This is a special object generated by MAPublisher and there is currently a dynamic link between the MAP View information (i.e. spatial information) and the scale bar object.

Generated Scale bar in the MAP Legend layer

In order to make a custom scale bar, you will have to break the dynamic link between MAPublisher and the scale bar object. In your own workflow, it’s important that you setup the scale before breaking the link because it will not rescale dynamically after the link is broken. Break the link by expanding the generated object.

From the main menu, choose Object > Expand.
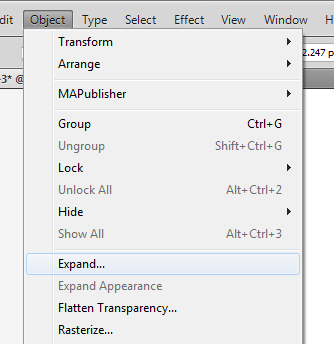
From Adobe Illustrator Menu, Object > Expand

In the Expand dialog box, click the “Object” check box, then click OK.
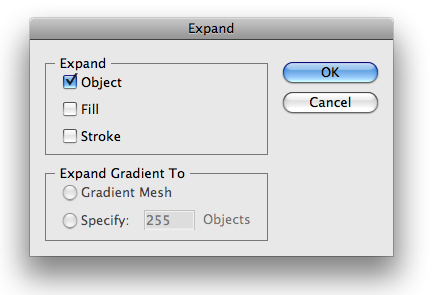
Expand diaog window

The result: the object <MAPublisher Scalebar> is replaced by an object called <Group> in the Layers panel. The connection between the scale bar object and MAPublisher is removed. The art in the scale bar object simply became grouped objects.

Expanded Scale Bar Object

At this point, select objects in the group and change its colors and lines by using the direct selection tool Adobe Direct Selection tool. The direct selection tool allows you to select individual object even if select objects is a part of a <Group> object.

If you are more comfortable with the selection tool Adobe Illustrator Selection Tool, you will want to read the suggestion below. It works, too.

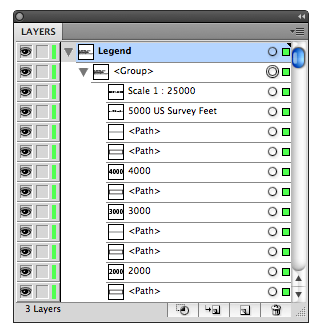
Take a look at the Layers panel again more closely. The screen capture of the Legend layer above shows that there is a <Group> object under the “Legend” layer. When the object tree under the “Legend” layer is expanded, you can see another <Group> object nested within a <Group> object. (a <Group> object containing a <Group> object). Since all the objects are still grouped, you can simply “ungroup” the art.

Expanded scale bar in the Layers panel

Select the <Group> object (i.e. the scale bar object for this example), then from the main menu, choose Object > Ungroup.
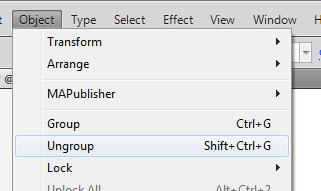
Adobe Illustrator menu: Ungroup

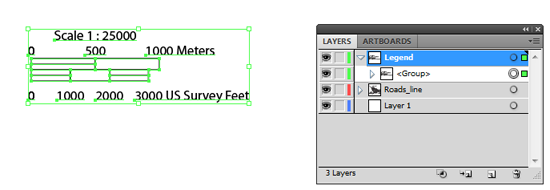
When you ungroup the object once, you now see only one <Group>. This <Group> object contains all the text, lines, and area objects composing a scale bar object.

Ungroup Once

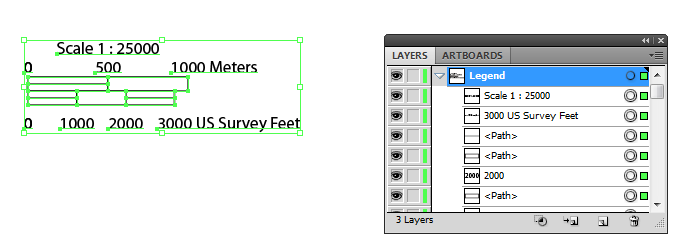
Now, ungroup the object once more. Finally you do not see the object <Group> anymore under the “Legend” layer. It indicates that every object in the layer can now be selected individually using the direct selection tool.

After the grouped object is ungrouped twice ....

Select the objects to edit and style them using Adobe Illustrator tools!

At the end ... now ready to be customized

Geographic Imager: Create shaded relief from a DEM

With Geographic Imager 3.x, you can import DEM files to Adobe Photoshop and can create shaded relief images.

step 12: Shaded relief image completed

There are two methods to achieve this:

Method 1: Run the pre-made JavaScript and apply it to all images

After opening your DEM image, choose File > Scripts > Browse… and select Shaded Relief.jsx from the SampleScripts folder inside the Geographic Imager Tutorial folder. It will generate the shaded relief image for the opened DEM image based on the settings in the JavaScript file.


Method 2: Create shaded relief images manually

We’ll use the DEM file Rocky Mountains.dem available in the Geographic Imager Tutorial folder for this demonstration.

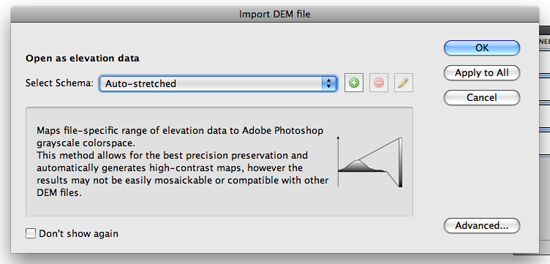
1) Open the Rocky Mountains.dem image from the Geographic Imager tutorial folder. Geographic Imager automatically detects it as a DEM file and provides the option to select the DEM image import method. For this demonstration, choose Auto-Stretched from the Select Schema drop-down list.

Step 1: Import DEM file option

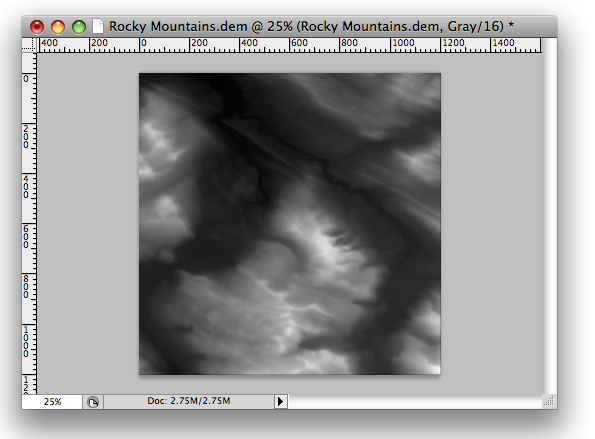
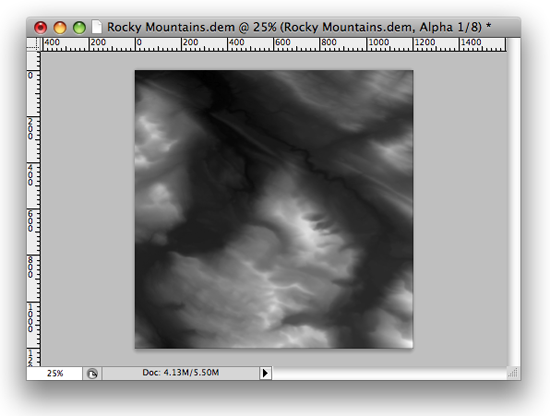
The imported DEM is opened in black and white. Take a look at the header of the image (or tab of the image file). Notice that it displays “Gray/16”. This indicates that the image is in the 16 Bits/Channel Grayscale mode.

step 1: Imported DEM image

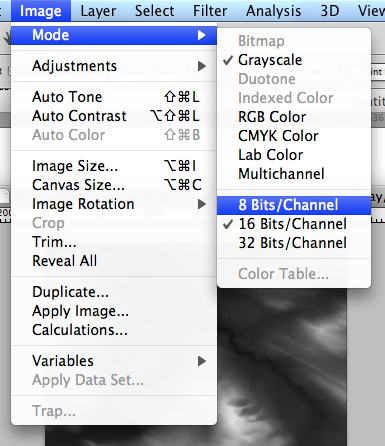
2) Now, change the image mode from 16 Bits/Channel Grayscale to 8 Bits/Channel RGB. From the top menu bar, choose Image > Mode and then 8 Bits/Channel. Once again, go to Image > Mode, this time choose RGB Color.

step 2: Changing the color mode

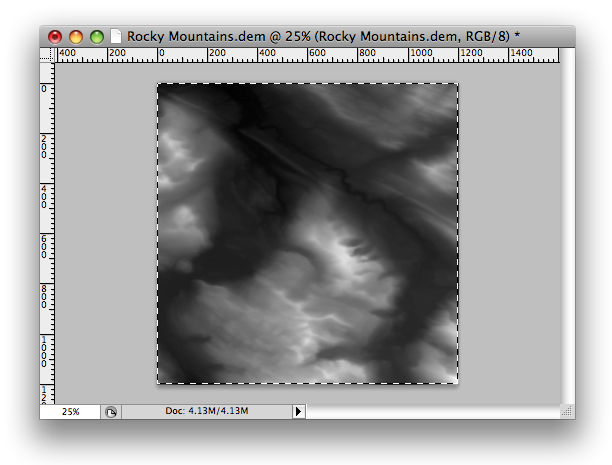
Once completed, take a look at the image header again (or file tab). Now “RGB/8” is indicated in the header, meaning that the image is now in the 8 Bits/Channel RGB color mode.

step 2: Color mode changed

3) Select the entire canvas (use the Rectangular Marquee Tool) and copy the selected area to the clipboard (Edit > Copy).

step 3: Select the entire canvas

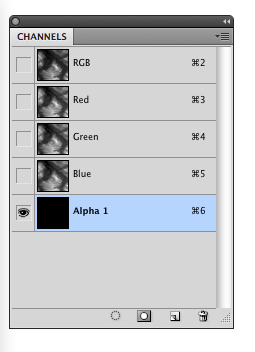
4) Open the Channels panel (Window > Channels) and add one Alpha channel by clicking the Create new channel button at the bottom of the panel or go to the panel option menu and choose New Channel. Leave the channel name as “Alpha 1”.

step 4: create a new channel

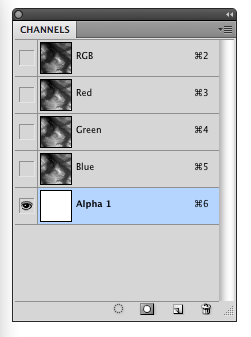
5) Select the “Alpha 1” in the Channels panel and fill it in white using the Paint Bucket Tool.

step 5: Filling Alpha channel

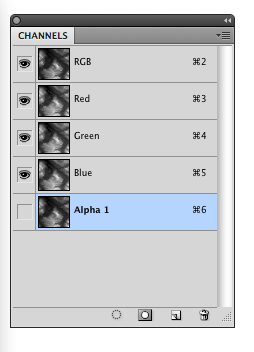
6) In step 3 we copied the selected area (the entire canvas) to the clipboard, now we’re going to paste it to the new channel. Select “Alpha 1” in the Channels panel, and paste it (Edit > Paste). You can see that the same image is displayed for all the channels when the copied area is successfully pasted. Make the Alpha 1 channel invisible and make sure the RGB channels are visible.

step 6: pasted canvas

7) Deselect the area (Select > Deselect from the top menu bar).

step 7: deselected area

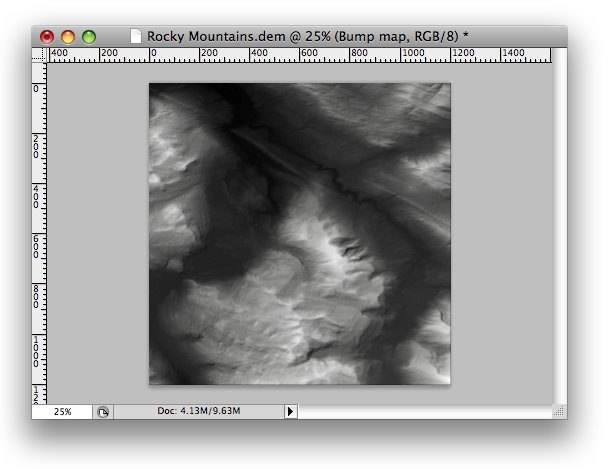
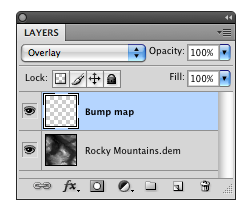
8) In the Layers panel (Window > Layers), create a new layer named Bump map. Change the Blending mode to Overlay. step 8: New Layer "Bump map"

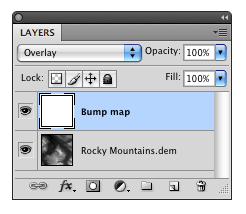
9) Using the Paint Bucket Tool again, fill the new “Bump map” layer with white.

step 9: fill white

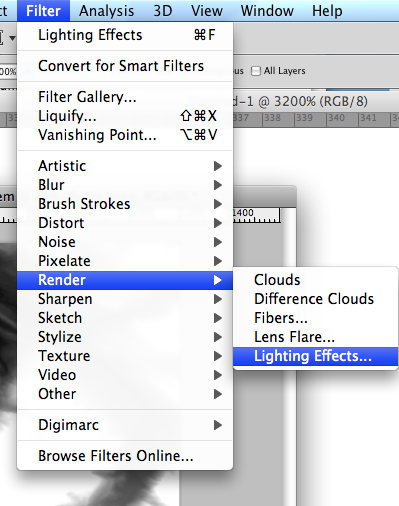
10) From the menu bar, choose Filter > Render > Lighting Effects…

step 10: Menu Filter > REnder > Lighting Effects ...

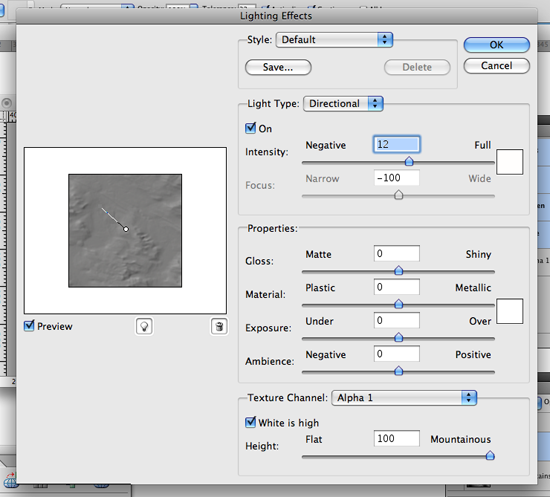
11) Adjust the settings in the Lighting Effects dialog window.

step 11: adjusting the light effect

12) The shaded relief image is completed! You can use this image to overlay with other georeferenced images with Geographic Imager or with vector datasets with MAPublisher.

step 12: Shaded relief image completed

News Archive

Blog Archive

December 2024 (1)
November 2024 (1)
October 2024 (1)
November 2024 (1)
September 2024 (1)
August 2024 (2)
July 2024 (1)
September 2024 (1)
June 2024 (1)
July 2024 (1)
May 2024 (1)
April 2024 (2)
May 2024 (1)
March 2024 (2)
February 2024 (1)
January 2024 (1)
December 2023 (1)
November 2023 (2)
October 2023 (2)
September 2023 (1)
August 2023 (1)
July 2023 (3)
June 2023 (1)
February 2023 (1)
January 2023 (2)
December 2022 (1)
November 2022 (2)
October 2022 (2)
September 2022 (1)
May 2023 (1)
August 2022 (2)
July 2022 (1)
June 2022 (2)
May 2022 (1)
February 2022 (1)
January 2022 (2)
August 2022 (1)
December 2021 (3)
November 2021 (5)
October 2021 (1)
September 2021 (3)
August 2021 (2)
July 2021 (1)
June 2021 (2)
May 2021 (2)
April 2021 (2)
March 2021 (3)
April 2021 (1)
February 2021 (1)
January 2021 (1)
November 2020 (1)
October 2020 (1)
June 2020 (2)
May 2020 (1)
April 2020 (3)
March 2020 (2)
December 2019 (1)
November 2019 (2)
September 2019 (1)
August 2019 (1)
July 2019 (1)
June 2019 (3)
May 2019 (4)
April 2019 (2)
March 2019 (1)
February 2019 (2)
January 2019 (3)
December 2018 (2)
November 2018 (1)
October 2018 (1)
September 2018 (2)
August 2018 (4)
July 2018 (2)
June 2018 (1)
July 2018 (1)
June 2018 (4)
May 2018 (1)
April 2018 (2)
March 2018 (4)
February 2021 (1)
February 2018 (1)
January 2018 (1)
November 2017 (1)
October 2017 (2)
August 2017 (2)
July 2017 (1)
March 2017 (1)
February 2017 (2)
January 2017 (2)
November 2016 (1)
January 2017 (1)
November 2016 (1)
October 2016 (2)
May 2016 (1)
March 2018 (1)
April 2016 (2)
December 2015 (2)
June 2015 (1)
May 2015 (1)
April 2015 (2)
December 2014 (4)
October 2014 (2)
May 2014 (4)
February 2014 (1)
October 2013 (3)
April 2013 (1)
January 2013 (2)
August 2012 (1)
October 2012 (1)
July 2012 (3)
May 2012 (2)
January 2012 (2)
August 2011 (1)
July 2011 (2)
June 2011 (2)
May 2011 (2)
March 2011 (1)
February 2011 (1)
January 2011 (5)
December 2010 (1)
November 2010 (1)
December 2010 (1)
November 2010 (1)
October 2010 (1)
August 2010 (4)
July 2010 (2)
June 2010 (3)
May 2010 (2)
April 2010 (2)
March 2010 (2)