My Account     Contact Us     Cart

Articles

Buffer Art in MAPublisher

Up to MAPublisher 8.2, the MAPublisher Buffer Lines function was limited to only Line features. For MAPubisher 8.3, a revised buffer function called Buffer Art can be performed on both Line and Point layers. Buffer Art allows you to enter one fixed value to either all or the selected art in one layer or the values from an attribute column in one map layer.

Example 1: Applying a static value for the buffer width

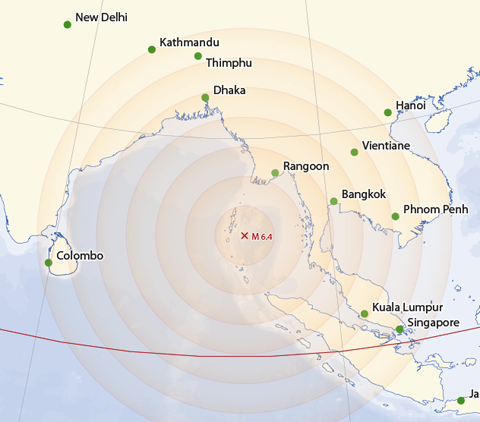
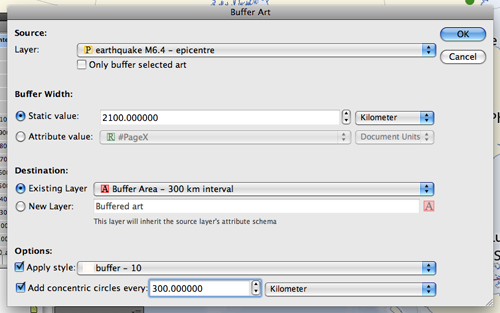
Below is the new Buffer Art dialog box. I have one MAP Point layer with a location of a strong earthquake recorded in India n May 31, 2010.

Example with Buffer Art (1): Settings

I specified a value of 2100 Kilometer as the distance to buffer from the epicentre (the origin of the earthquake). The buffered art will be placed in the existing destination layer Buffer Area – 300 km interval.

For the buffered area, a pre-designed graphic style will be applied.

Lastly, I enabled the Add concentric circles every: option. This option will generate evenly spaced rings around the points within the buffered area. I am selecting 300 Kilometer for each concentric circle distance. It will generate seven concentric circles within the 2100 km buffer. As a result, you can see that a concentric ring is drawn every 300 km from the epicentre.

Example with Buffer Art (1): Result


Example 2: Applying values from an Attribute Column for the buffer width (Creating Graduated Symbols for every point)

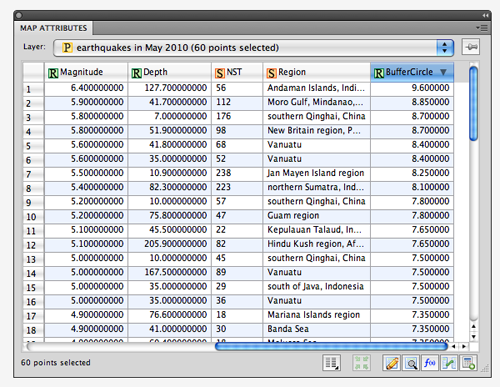
I will use another point layer this time. I have one MAP Point layer with the point information of earthquake epicenters. The size of the buffer width in the page unit (pixel) was calculated based on the size of the magnitude for every point in the layer. Those values under the BufferCircle column will be used for the buffer width.

Example with Buffer Art (2): Calculated Buffer Width in the MAP Attribute panel

Now, the Buffer Art feature will be performed with those calculated values for the buffer width.

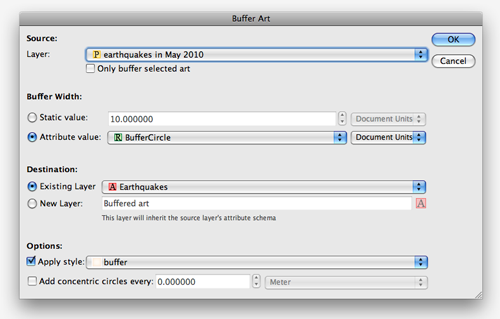
Example with Buffer Art (2):  Settings

The Attribute Value option is chosen and the BufferCircle field for the Buffer Width.

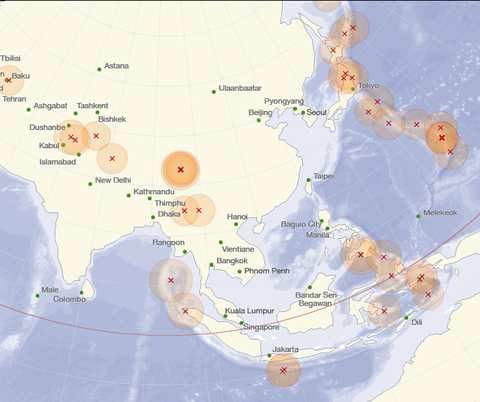
As a result, every buffered area (circle) has a different size. Also, the graphic style selected for the buffer art had some level of transparency applied. You can see the darker color when the buffered art overlaps each other. In other words, the region where the dark orange is observed experienced earthquakes more than once.

Example with Buffer Art (2): Result

Buffer Art can be applied to many situations such as around parcel lots, around road or highway lines or even creating them to find intersection proximity between map features. Experiment with your own to find out what is most useful for your own data.

Create a New MAP View For Adobe Photoshop Paths in MAPublisher 8.3

In our previous blog, we introduced you to a quick technique for remote sensing imagery: to depict a type of land types (green area) from a Landsat image. Below is the false composite image created in the previous blog. Basically, the red area indicates a lot of green vegetation (i.e. trees, shrubs, etc).
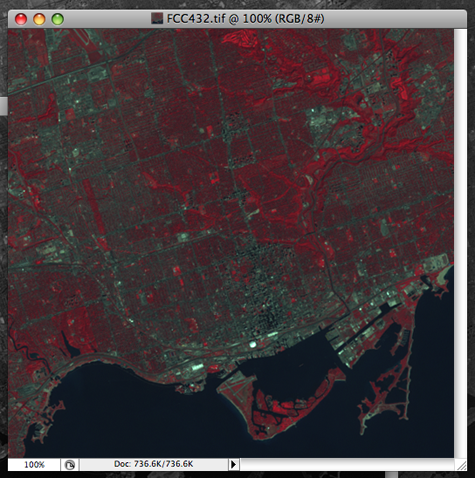
False color composite image produced in the previous blog

Now, you may be wondering how those red areas can be extracted from Adobe Photoshop and Geographic Imager and brought into Adobe Illustrator and MAPublisher?

An overview of the steps involved in this technique:

In Adobe Photoshop & Geographic Imager:

  1. Select the red areas with Adobe Photoshop tools.
  2. Save the selected pixel areas as “work path”.
  3. Export the saved work path as an Adobe Illustrator file.
  4. Export the georeference information from Geographic Imager option menu.


In Adobe Illustrator & MAPublisher:

  1. Import the exported Adobe Illustrator file with the work path.
  2. Assign the georeference information to the imported work path objects.
  3. If you have already made a map with vector dataset, open the AI file.
  4. Import MAP Objects from the AI file with the workpath to another AI file with a map.
  5. Drag and Drop transformation to align the workpath objects geospatially.


Below are the detailed step-by-step intructions.

In Adobe Photoshop and Geographic Imager:

1. Select the red areas

Open the false color composite image in Adobe Photoshop. Now, all the red areas must be selected using any of the following Adobe Photoshop tools.
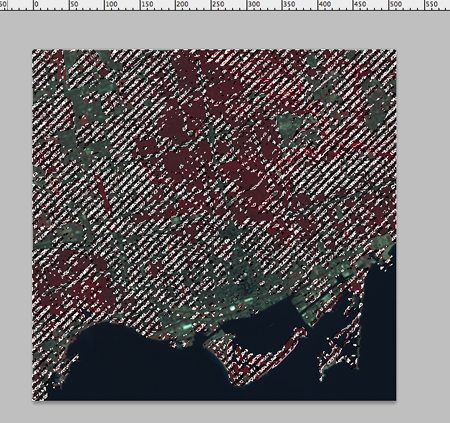
Selected red areas

For example, you can select the red areas using the Magic Wand Tool. You may want to adjust the tolerance values as you begin to select the areas so that only the approriate areas are selected. If you disable the “Contiguous” option from the settings tool bar, it selects all the areas with the same color as the one you collected.
Magic wand tool settings

If you want to more precisely select red areas with a preview window, use the Color Range Tool (Select > Color Range). With this tool, sample the color of interest first. In this example, you might want to pick only the areas with the bright red color or you might want to be within a specifc range of red. Using this, you will have more control on which areas are selected.
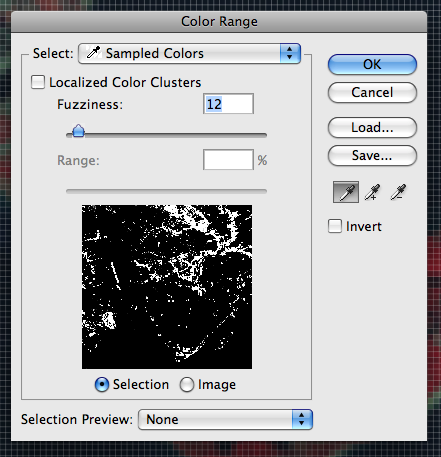
Photoshop Tool: Color Range

Of course, there are other techniques you can use to collect the pixels with a specific color. The two suggested above are used quite commonly in our workflows.

2. Save the selected pixel areas as “work path”

After all the red areas are selected, save the selected area as “work path”. This option is available in the Paths panel options menu.
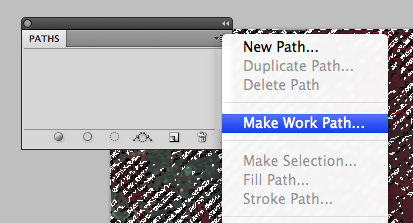
Save the selected areas as Work Path

The selection is now saved as a “work path” in the Paths panel.
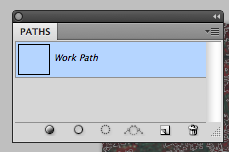
Saved work path in the Paths panel

3. Export the saved work path as an Illustrator file

Once the work path is saved in the Paths panel, export it as an Illustrator file (File > Export > Paths to Illustrator).
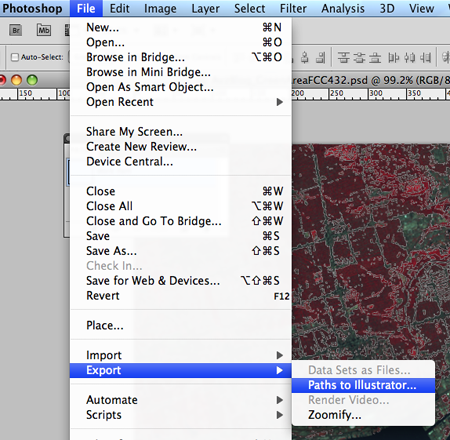
Save the work path as an Adobe Illustrator file

4. Export the georeference information from Geographic Imager option menu

As you saw in the Geographic Imager panel for the false color composite file in the previous blog, this image was georeferenced. Furthermore, we need to export the georeference information that will coincide with the Adobe Illustrator file we just exported.. You can export this georeference information as a MapInfo TAB file or Blue Marble Reference RSF file from the Geographic Imager panel options menu.
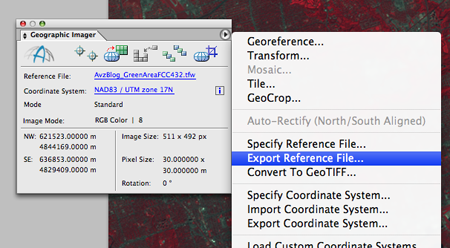
Export the georeference information from the Geographic Imager panel

In Adobe Illustrator & MAPublisher

5. Import the exported Illustrator file with the work path

In Adobe Illustrator, open the Adobe Illustrator file exported from Adobe Photoshop (Step 3). Upon opening, a prompt appears to convert the exported file to Artboards. Select the second option “Crop Area(s)”.
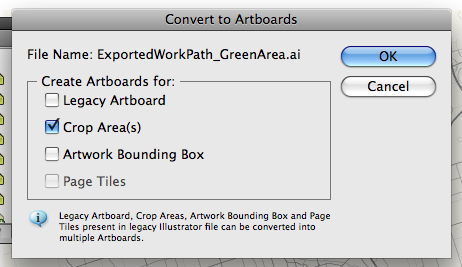
Opening the exported Adobe Illustrator file.

When the artboard is opened, it seems like there is nothing on the artboard. It is simply because there is no color assigned to the fill and stroke. I put a green color for the work path objects.
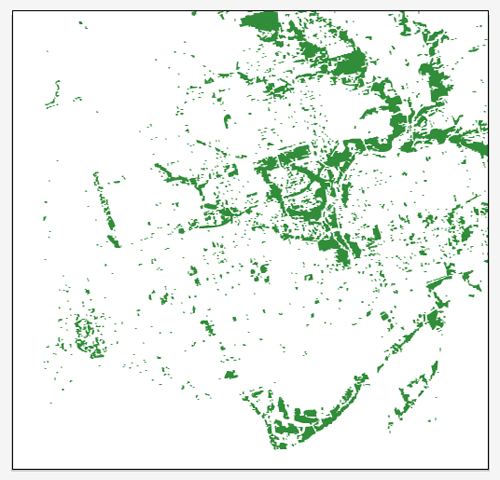
Imported exported Adobe Illustrator file.

6. Assign the georeference information to the imported work path objects

The imported work path objects do not have the georeference information yet. We exported the reference file in Step 4 using Geographic Imager. We are going to use the exported reference file to assign the georerefernce information to those work path objects.

In the MAP Views panel options menu, click “New MAP View For Photoshop Paths…”
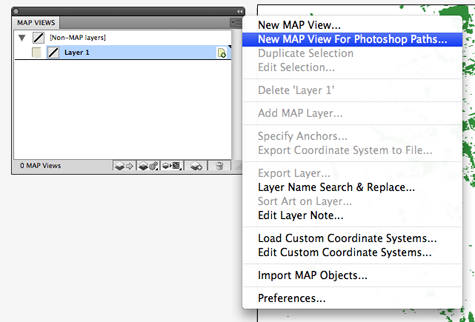
MAP Views option: Create a MAPView from Photoshop path

Browse for the exported reference file (either *.tab or *.rsf format from Step 4). Then select “Area” as the feature type for the MAP layer to be created.
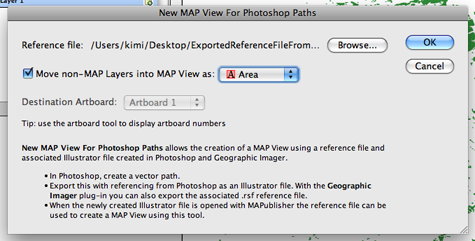
MAPublisher dialog: New MAPView For Photoshop Paths

The georeference information from the original image is now inherited by the work path objects in the Adobe Illustrator file.
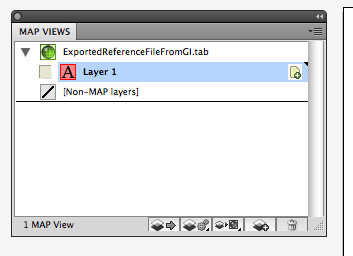
A created new MAPView

In the MAP View Editor window, you can see all the spatial information such as the coordinate system, scale, and map extent within the artboard. The name for the MAP View is renamed to “Green Area from Photoshop – GI” for Step 8.

At this point, if you have GIS dataset, you can import them to this document. However, I will show you one more MAPublisher trick to bring this green area into an existing MAPublisher file.
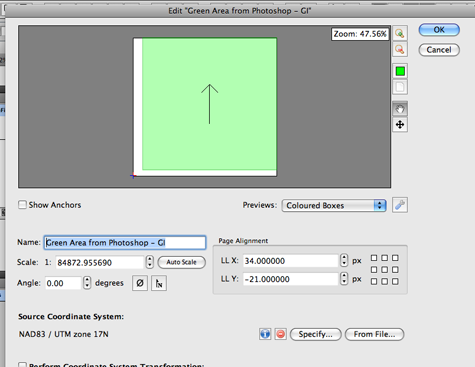
The georeference information in the MAPView editor

7. If you have already made a map with vector dataset, open the Adobe Illustrator file

Keep the Adobe Illustrator file with the work path objects open, then open another Adobe Illustrator file with MAPublisher MAP Objects. Now you have two Adobe Illustrator documents open.

8. Import MAP Objects from the AI file with the workpath to another AI file with a map

Make the Adobe Illustrator document with the map (not with the work path objects) the current document.

On the MAPublisher Toolbar, click the “Import MAP Object” button.

In the “Import MAP Objects” dialog box, select the MAP View “Green Area from Photoshop” and click OK.
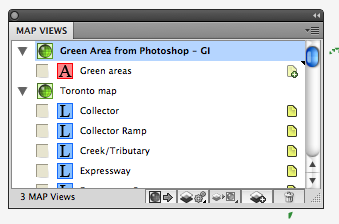
Imported MAPView with a MAP layer

All the path objects are imported to the other Adobe Illustrator file with the base map.
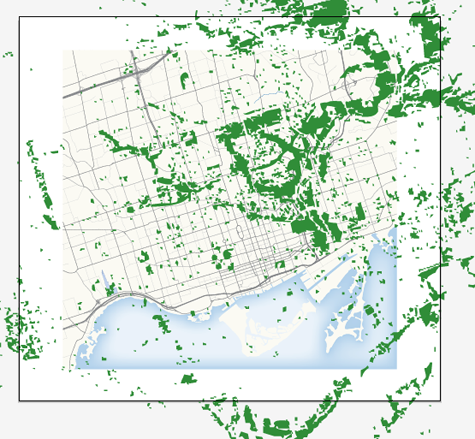
Imported green area from another Adobe Illustrator document

However, the imported objects and the base map do not line up appropriately. It is because the scale of the MAP View with the work path and the MAP View with the base map do not match. You can line up those green areas with a simple step.

9. Drag and drop transformation to align the workpath objects geospatially.

In the MAP Views panel, there are two MAP Views: “Green Area from Photoshop – GI” for the work path imported from another AI file and “Toronto map” for the base map.

Click the MAP Layer “Green areas” in the MAPView “Green Area from Photoshop – GI” …
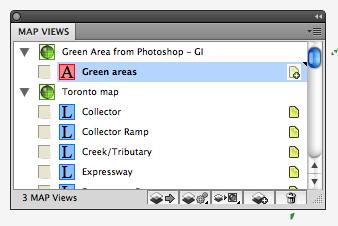
MAPublisher special trick: Drag and Drop transformation

… then drag the map layer to the MAPView “Toronto map”.
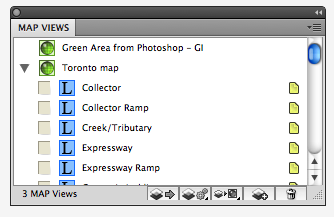
Transformed MAP Layer

Now all the green areas (work path objects) are lined up nicely with the base map.
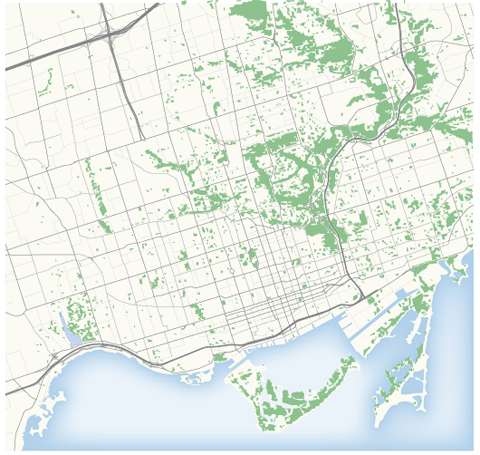
Green areas in Toronto nicely lined up with the base map.

Try this out with your own workflow to see how it may improve your maps.
Creating a false-color composite image with Geographic Imager for Adobe Photoshop

One of the powerful remote sensing tools available in Adobe Photoshop is to detect the land surface information by creating a false color composite image. Multispectral images contain the reflectance information from the visible and invisible electromagnetic spectrum. Using this information, we can detect many kinds of land surface information. For this example, we will detect the green area using Landsat images imported by Geographic Imager for Adobe Photoshop, which ensures all the georeference information is maintained.

Landsat images consist of several gray scale images, with each image containing one of the bands of the electromagnetic spectrum. For example, in the Geographic Imager tutorial folder, there are a set of Landsat images available. Those gray scale images are from Band 1, 2, 3, 4, 5, 7, and 8.

Landsat Images available in the Geographic Imager tutorial folder

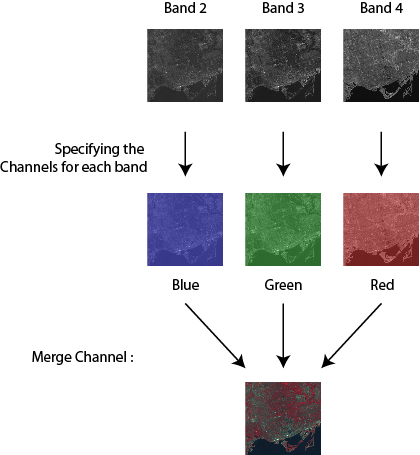
These images need to be combined into one image. The Adobe Photoshop function called “Merge Channels” produces one image by combining mulitple gray scaled images. With this example, those gray scale images from Band 2, 3, and 4 will be merged into one image by assigning a color for each band.

Image analysis trick

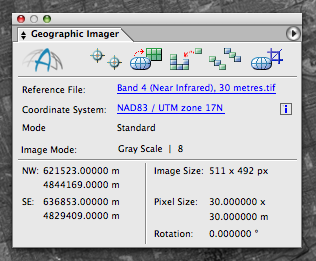
1) Open the Landsat image from Band 2, 3, and 4. Note that the Geographic Imager panel shows the information on the coordinate system and image extents.

Georeference information on the Geographic Imager panel

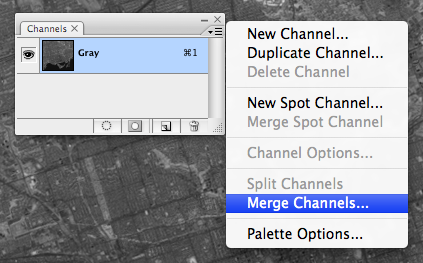
2) Open the Channel panel (Window > Channels). Choose “Merge Channels” from the panel options menu.

Merge Channels

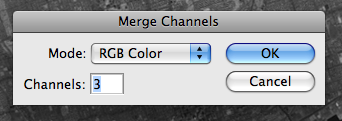
3) In the Merge Channels dialog box, select RGB color as the mode.

Merge Channels - RGB

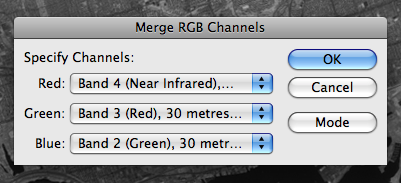
4) In the Merge RGB Channels dialog box, specify the band for each channel: band 4 for the red channel, band 3 for the green channel, and band 2 for the blue channel.

Specifying the channels for Merge channels

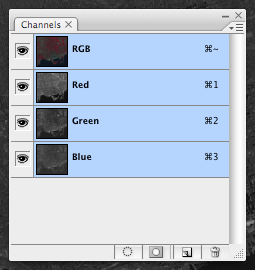
5) As a result, those three images from Band 2, 3, and 4, are assigned to the Blue, Green and Red channels, respectively.

Merge channels result in the Channels panel

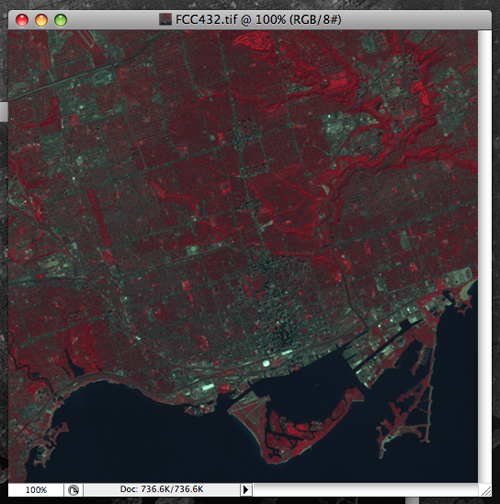
6) Now, let’s take a look at the image!

Merge channels result - false color composite image

This combination of false-color makes vegetation appear as red tones. The bright red color indicates the growing vegtation. Water is displayed in a blue color. When the water contains high sediment concentrations, the color will be lighter blue. Urban areas will appear gray to blue-gray in color.

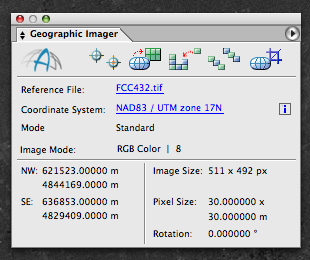
7) All the georeferenced information is inherited by the new image with merged channels from those original images. The georeference information is displayed in the Geographic Imager panel.

The georeference information was maintained from the original georeferenced image.

News Archive

Blog Archive

December 2024 (2)
November 2024 (2)
October 2024 (1)
September 2024 (1)
August 2024 (2)
July 2024 (1)
September 2024 (1)
June 2024 (1)
July 2024 (1)
May 2024 (1)
April 2024 (2)
May 2024 (1)
March 2024 (2)
February 2024 (1)
January 2024 (1)
December 2023 (1)
November 2023 (2)
October 2023 (2)
September 2023 (1)
August 2023 (1)
July 2023 (3)
June 2023 (1)
February 2023 (1)
January 2023 (2)
December 2022 (1)
November 2022 (2)
October 2022 (2)
September 2022 (1)
May 2023 (1)
August 2022 (2)
July 2022 (1)
June 2022 (2)
May 2022 (1)
February 2022 (1)
January 2022 (2)
August 2022 (1)
December 2021 (3)
November 2021 (5)
October 2021 (1)
September 2021 (3)
August 2021 (2)
July 2021 (1)
June 2021 (2)
May 2021 (2)
April 2021 (2)
March 2021 (3)
April 2021 (1)
February 2021 (1)
January 2021 (1)
November 2020 (1)
October 2020 (1)
June 2020 (2)
May 2020 (1)
April 2020 (3)
March 2020 (2)
December 2019 (1)
November 2019 (2)
September 2019 (1)
August 2019 (1)
July 2019 (1)
June 2019 (3)
May 2019 (4)
April 2019 (2)
March 2019 (1)
February 2019 (2)
January 2019 (3)
December 2018 (2)
November 2018 (1)
October 2018 (1)
September 2018 (2)
August 2018 (4)
July 2018 (2)
June 2018 (1)
July 2018 (1)
June 2018 (4)
May 2018 (1)
April 2018 (2)
March 2018 (4)
February 2021 (1)
February 2018 (1)
January 2018 (1)
November 2017 (1)
October 2017 (2)
August 2017 (2)
July 2017 (1)
March 2017 (1)
February 2017 (2)
January 2017 (2)
November 2016 (1)
January 2017 (1)
November 2016 (1)
October 2016 (2)
May 2016 (1)
March 2018 (1)
April 2016 (2)
December 2015 (2)
June 2015 (1)
May 2015 (1)
April 2015 (2)
December 2014 (4)
October 2014 (2)
May 2014 (4)
February 2014 (1)
October 2013 (3)
April 2013 (1)
January 2013 (2)
August 2012 (1)
October 2012 (1)
July 2012 (3)
May 2012 (2)
January 2012 (2)
August 2011 (1)
July 2011 (2)
June 2011 (2)
May 2011 (2)
March 2011 (1)
February 2011 (1)
January 2011 (5)
December 2010 (1)
November 2010 (1)
December 2010 (1)
November 2010 (1)
October 2010 (1)
August 2010 (4)
July 2010 (2)
June 2010 (3)
May 2010 (2)
April 2010 (2)
March 2010 (2)