Getting Started: The Basics of Map Data and Projections
Welcome to the Avenza MAPublisher: Getting Started video series, a tutorial-focused introduction to the MAPublisher workspace. As the second part of “The Basics”, this video will discuss the fundamental concepts behind the geospatial data map-makers use to create maps with MAPublisher. The video briefly discusses types and functions of geospatial data, and how they differ from normal vector art layers in Adobe Illustrator. It also provides a light overview of projections and some of the commonly used types. The summary notes below will help you follow along.
What is Map Data?
Map data, also commonly known as geospatial data, is any data that references a geographic location. This could be a series of GPS coordinate points that identify the location of cities, lines that describe the paths of rivers or roads, or areas that denote the boundaries of a park. Commonly, these datasets often include a non-spatial component (called “attributes”) that provide additional descriptive information. For example, a map dataset of tree locations may include attribute components that describe the species and age of each individual tree located in the dataset.
Vector vs Raster Map Data
There are two primary types of map data that cartographers will encounter while working with MAPublisher; Vector data and Raster data.
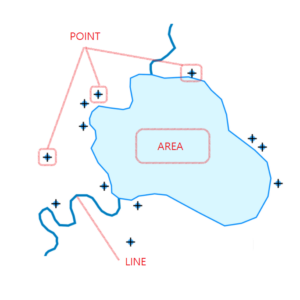
Vector data is the main type used with MAPublisher. It can be defined using two-dimensional XY coordinates and is often referred to by its feature type, such as point, line or area data. For example, in the example map here, the wells represent point data, the rivers represent line data and the lake represents area data.

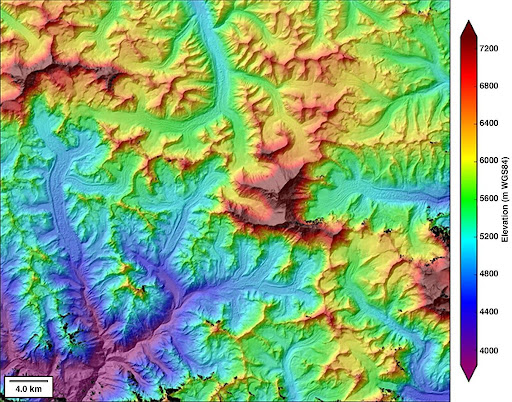
Raster data such as satellite imagery, or digital elevation models (DEM) is commonly used with Geographic Imager, but it can also be used in MAPublisher to provide a background for vector features. In a raster dataset, each pixel represents a value within a certain range. For example, in the digital elevation model seen here, each pixel might represent an elevation value, such as meters above sea level. A caveat of raster data is that it has relatively larger file sizes, although it is the ideal type of data for creating continuous datasets.

Map Projections
A major difference between geospatial data in MAPublisher and vector art layers in Adobe Illustrator is that map data is georeferenced. Georeferenced data ensures that locations and coordinates in the map data are assigned correctly and accurately to their real-world locations on Earth. Since the Earth is a 3-Dimensional sphere, and maps are typically 2-dimensional and flat, it is a challenge for cartographers to properly present map data in a way that minimizes distortion and inaccuracy. The most common way to tackle this challenge is through careful use of “Map Projections”.
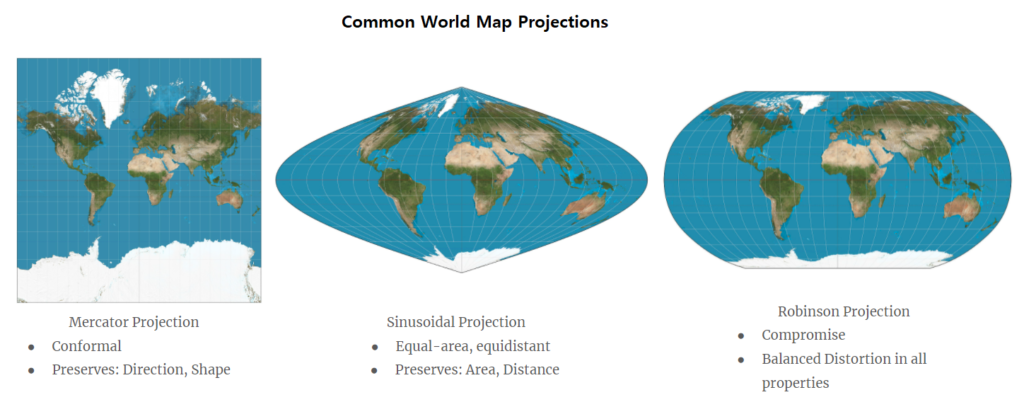
Map Projections will selectively preserve different properties of the map data that ensure the map is accurate where it needs to be. While all map projections result in some distortion, different ones can be used to preserve Area, Distance, Shape, or Direction. It is up to the cartographer to decide which properties are important, and thus which projection should be specified, based on how the map is intended to be used. In general, the larger the area being shown by the map, the greater the distortion that will occur.

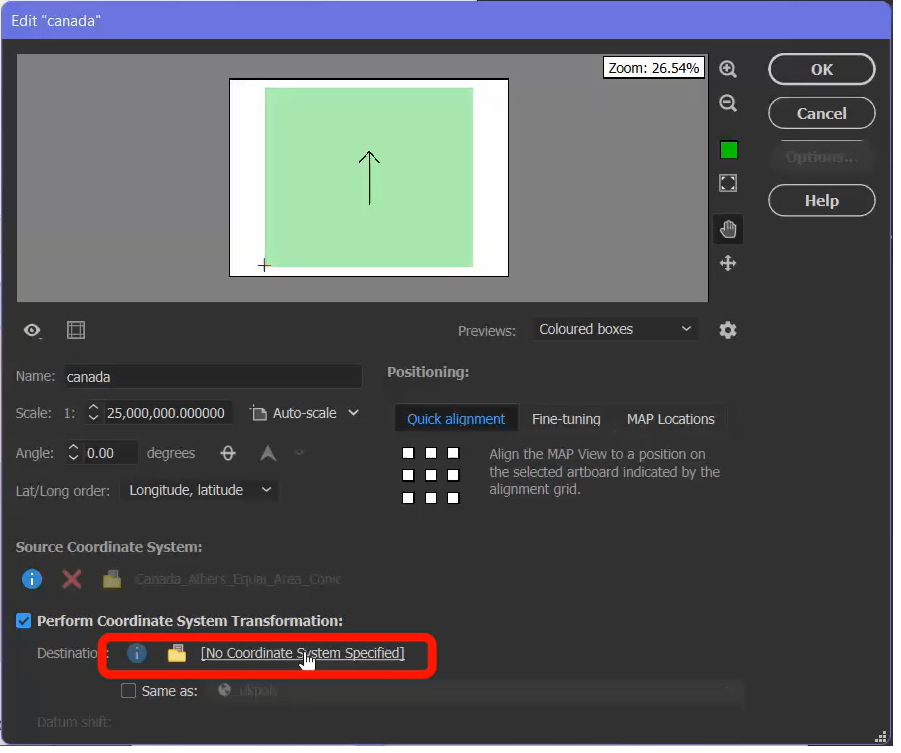
Changing projections in MAPublisher can be done by accessing the MAP View properties panel and selecting “Perform Coordinate System Transformation”. There are hundreds of different projections to choose from, each with their own specific use-cases and distortions. For more information about Projections in MAPublisher, please see the Projection Guide.

To see more helpful tutorials for MAPublisher, check out our Support Centre!
- Getting Started: An Introduction to the MAPublisher Workspace
- Getting Started: The Basics of Map Data and Projections
- Getting Started: Import Map Data into MAPublisher
- Getting Started: Create, Copy, and Delete MAP Views
- Getting Started: Working with MAP Attributes
- Getting Started: Transform a Coordinate System Using the MAP View Editor


