


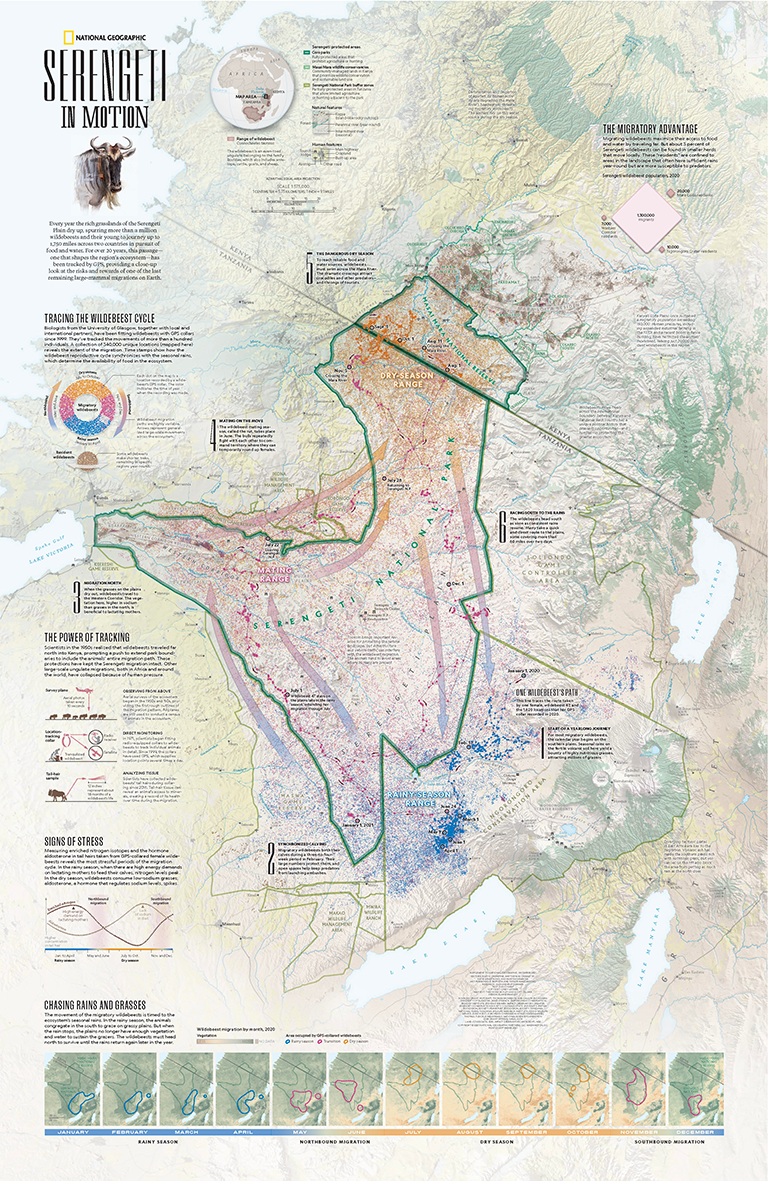
In the Map Spotlight this time, we are highlighting a submission from the 2021 Avenza Map Contest. Serengeti in Motion by Riley Champine was a supplement to the December 2021 issue of National Geographic magazine, which featured several stories about the Serengeti and its wildlife. The map depicts the annual great migration of wildebeests, one of Earth’s last remaining large-mammal migrations. It also depicts the natural features of the landscape as well as the boundaries of several protected areas in the Serengeti region.
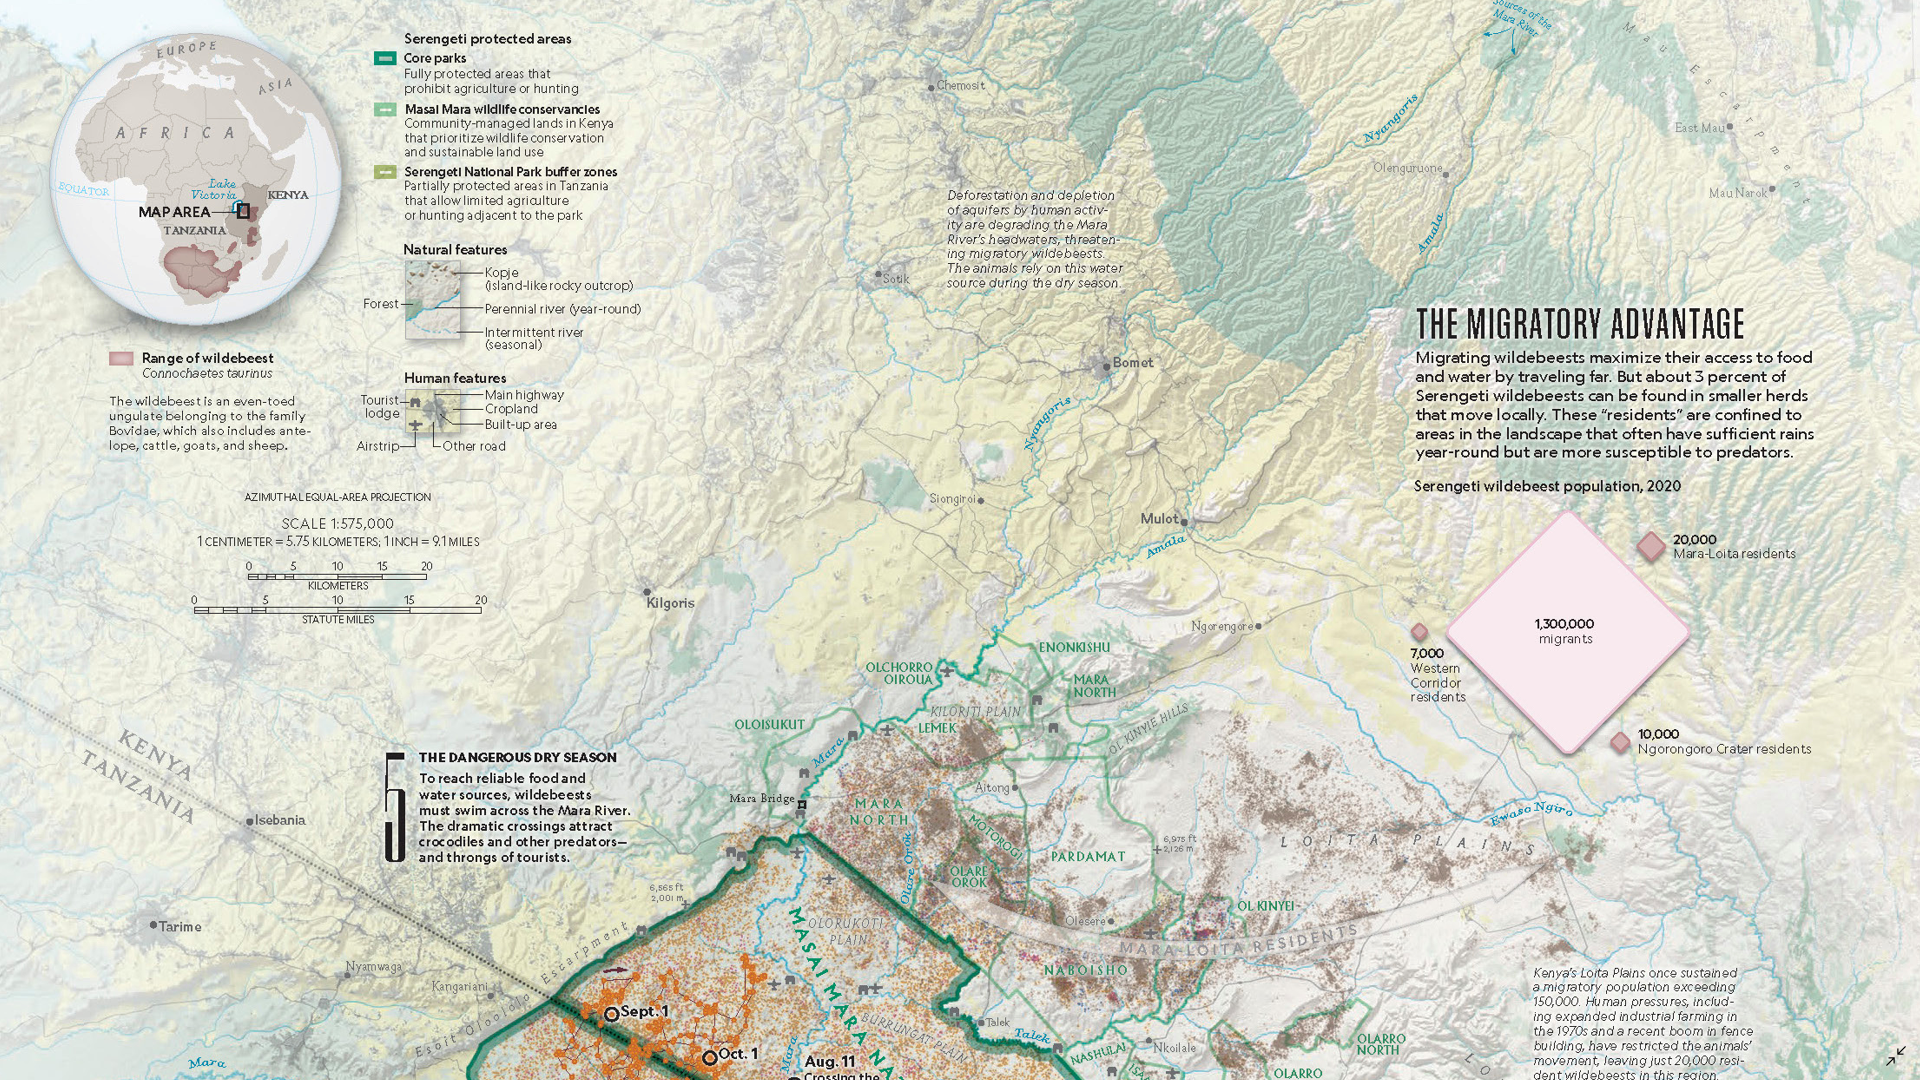
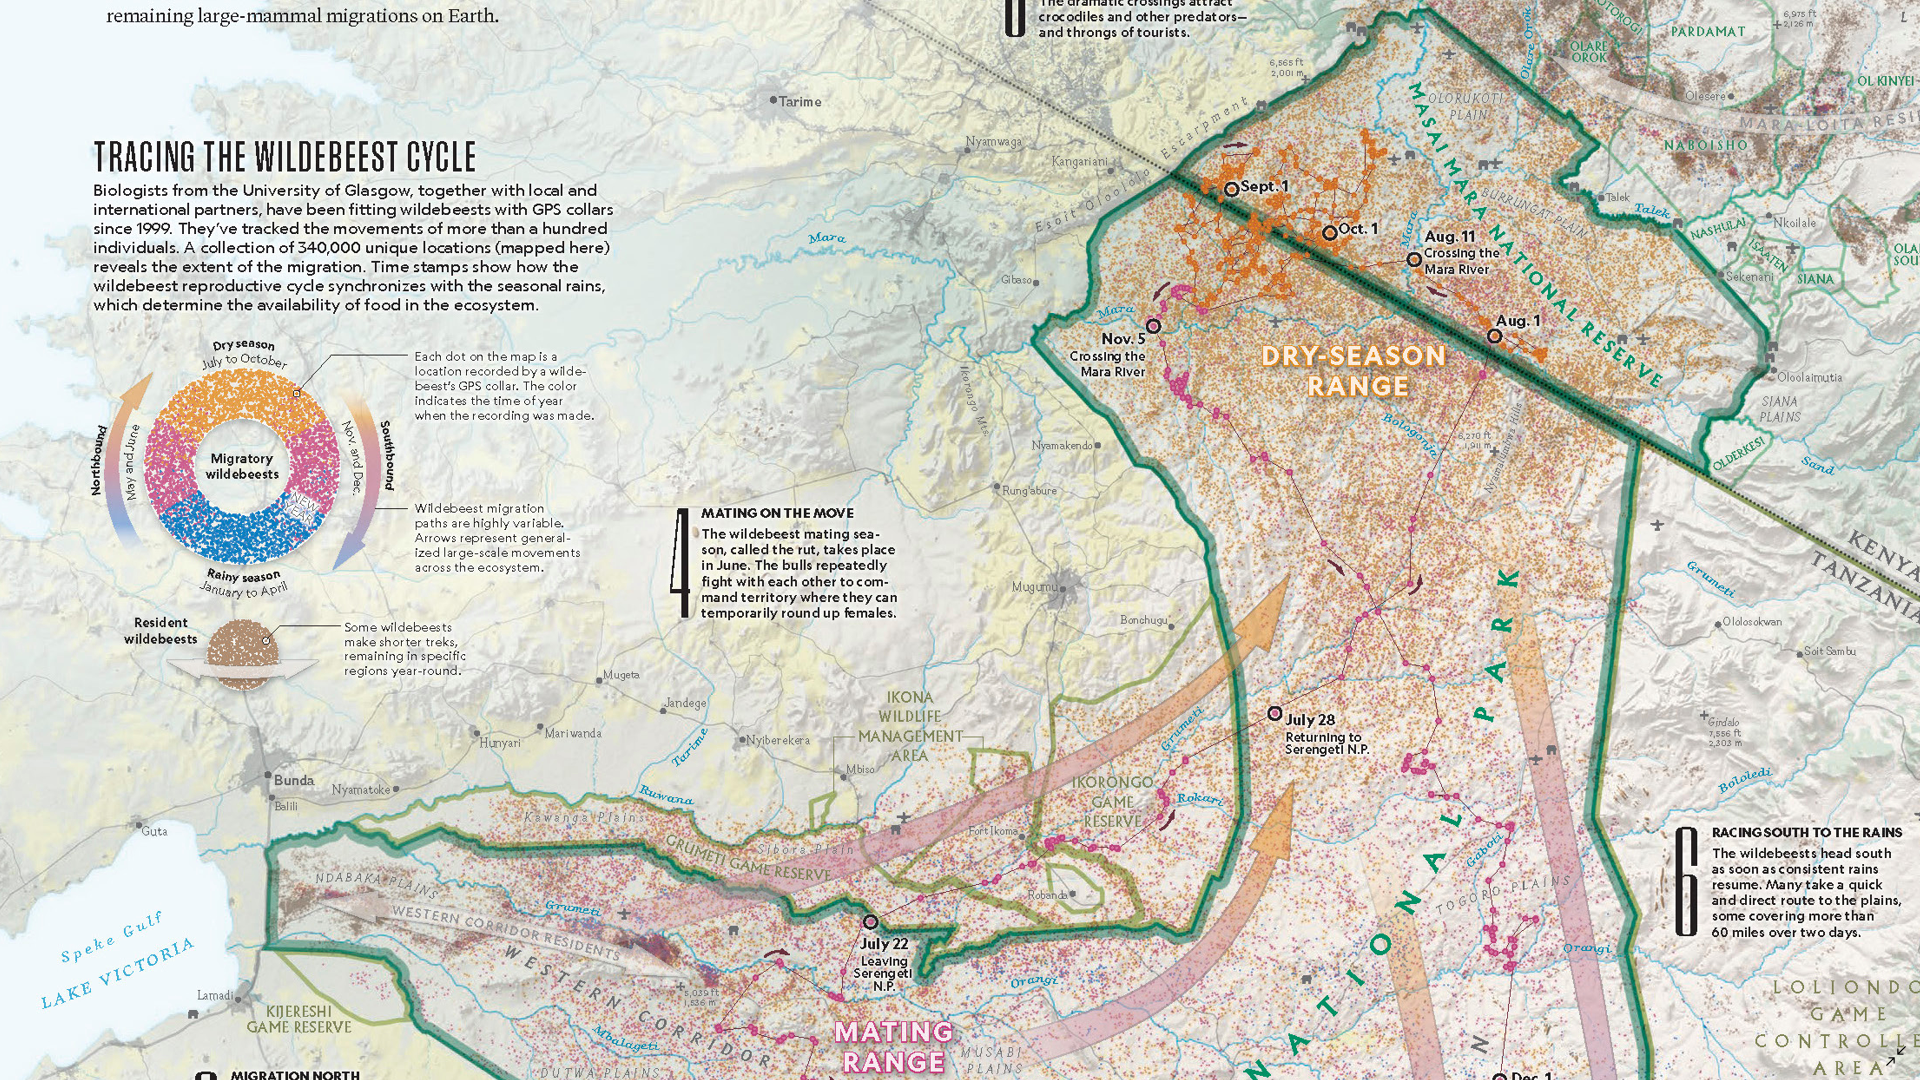
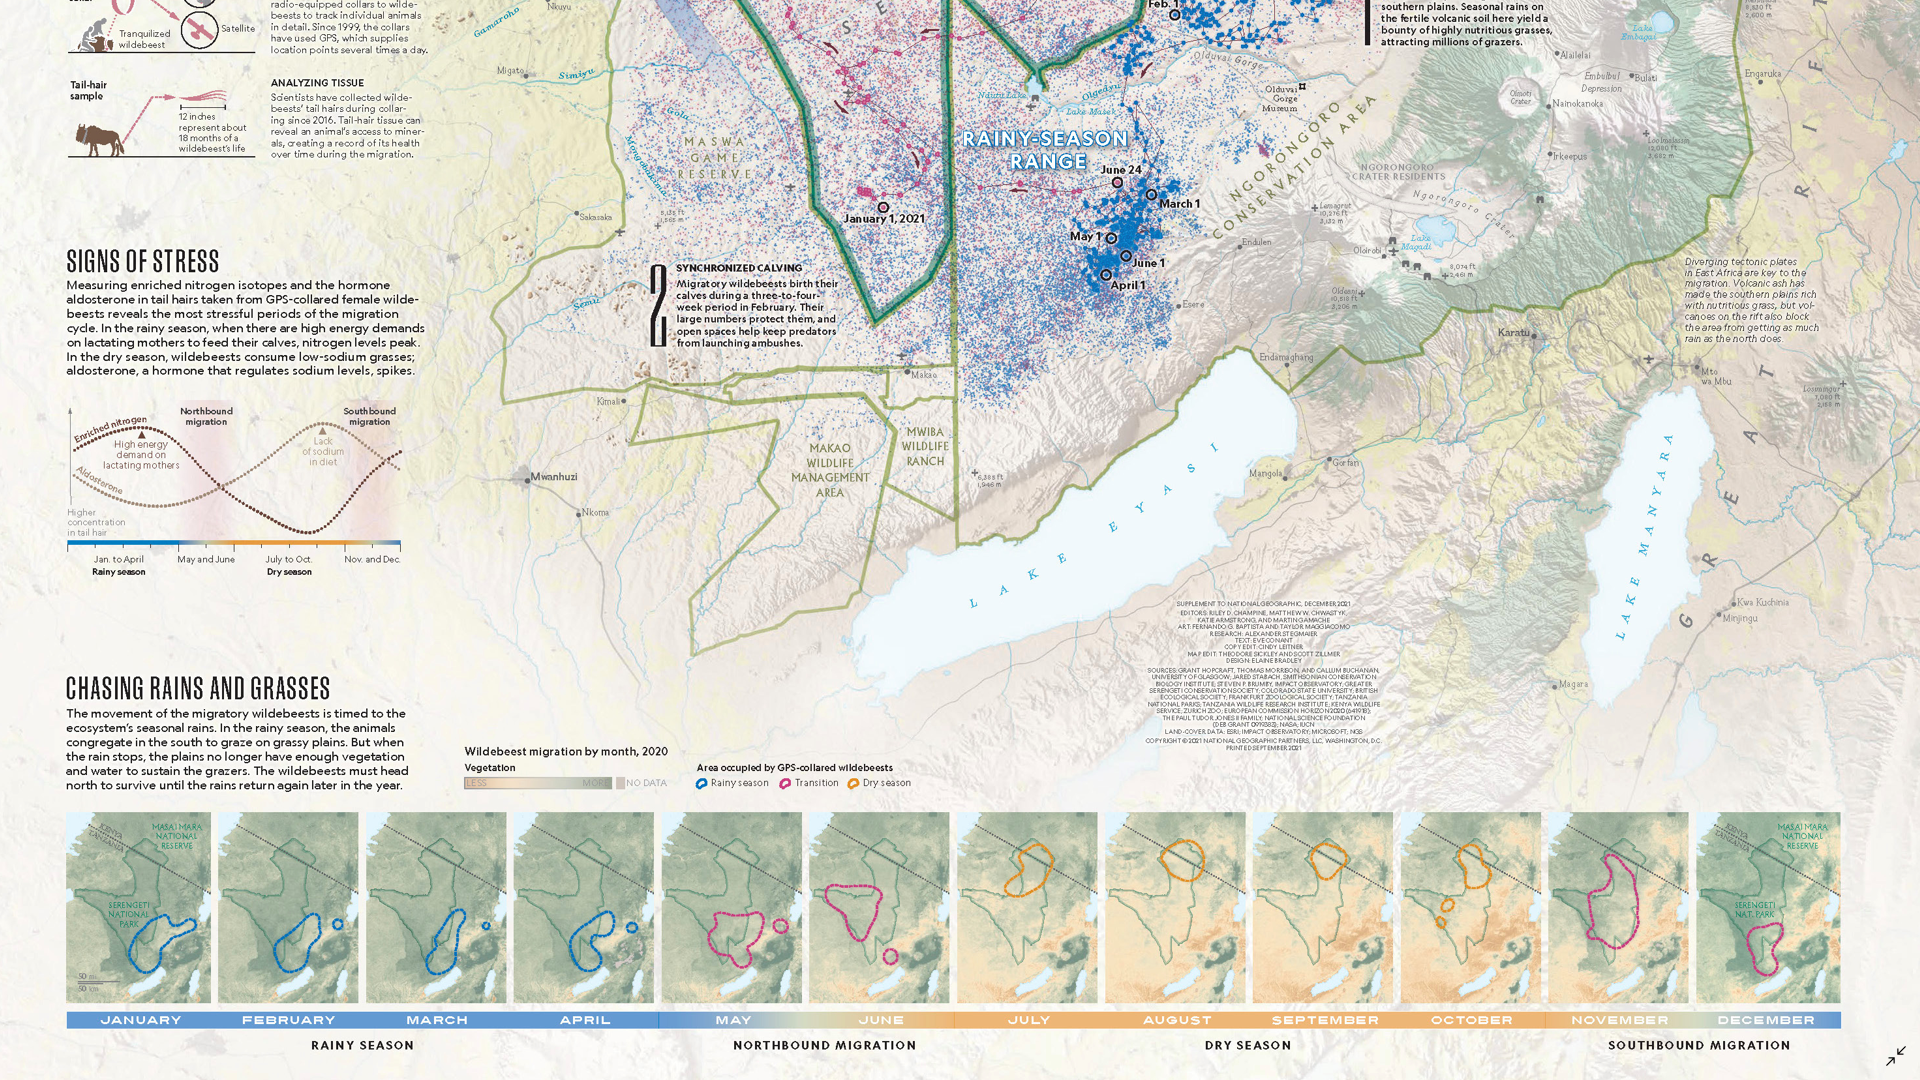
Each year over one million wildebeest (and other mammals such as gazelles and zebras) participate in a circular migration which starts in the southern Serengeti in Tanzania, loops through Serengeti National Park, and advances north toward the Masai Mara National Reserve in Kenya. Seasonal rains drive migration patterns as the wildebeest search for more grass to graze on. On this map, the migration has been illustrated using 340,000 points collected by an ongoing 20+ year biological study that uses GPS collars worn by wildebeest to track their location. The map also details the path of a single female wildebeest as she crossed multiple habitats, several rivers, and an international boundary (twice!) over the course of one year.
Select the images below to see a detailed look at Riley’s map
Making the Map
To create the terrain of the map, Riley used Geographic Imager to reproject and then mosaic aerial imagery of the Serengeti region. This terrain imagery could then be saved and imported into MAPublisher to constitute the background for the map. Some of the data was prepared in other programs such as Microsoft Excel, QGIS and Natural Scene Designer, and then easily imported into MAPublisher.
Riley used the MAP Selections tool to select location points by their date attribute, and group them into three main categories: rainy season (January to April), dry season (July to October), and migration periods (May to June and November to December). He also employed the use of MAP Stylesheet Themes to symbolize these points as well as other data on the map.
The MAP Point Plotter came in handy for Riley while creating the path travelled by the single female wildebeest on the map. The Simplify Art tool was also helpful in decreasing the detail in some line and area features, which helps in software performance when dealing with a large amount of data in one document.
Riley added the finishing touches to his map using his Stylesheet Themes to create legends as well as using the LabelPro add-on to easily place labels by attribute.
Learn more about the Avenza Map Contest and submit your entry here, and check out our other Map Spotlight blogs here!