My Account     Contact Us     Cart

What’s New? Geographic Imager 6.1

Geographic Imager 6.1 is available now and in addition to full compatibility with Adobe Photoshop 2020, here are the other exciting new features to make working with spatial imagery in Photoshop even easier:

Vector Import from databases

Geographic Imager allows you to import a number of GIS vector formats directly on to your images in Photoshop. Whether performing a check to ensure accurate georeferencing, QA/QC or simply including supplemental data, this functionality allows you to improve the efficiency of your workflow. For a while, it was only possible to import vector data from your own files however we have added the capability to import from databases including PostGIS Spatial Database, and ESRI File and Personal Databases (.gdb and .mdb). Note that importing vector data from databases is only available in the full version of Geographic Imager.

Improved Mosaic Layer organization

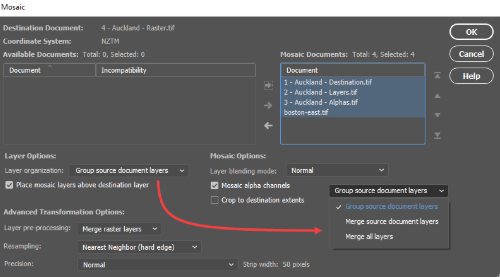
When mosaicking documents in Photoshop with Geographic Imager’s Mosaic tools, you previously had the option to either group the layers from each document into folders or merge all layers into one single layer. In this new release, we’ve added a new option to merge source document layers which will flatten each source document into a single layer, but also keep each document separated in the destination, without the use of folders. This helps to keep the individual images separate while minimizing the number of layers and folders you need to deal with.

Improved mosaic layer

Geographic Imager 6.1 Improved mosaic layer

7 GIS terms To Know: Map Making for Designers

Many of our MAPublisher clients are cartographers and GIS professionals, but a growing number are graphic designers who are tired of the tedious work of making maps without specialized tools. Making a map is part art and part science and while we help bridge the gap between Geographic Information Systems (the science) and graphic design (the art), as a graphic designer, you may not be familiar with the wonderful world of GIS.

So on this GIS Day, we have compiled the definitions to a few common GIS terms that you may encounter; GIS Day, celebrated each year, in November to help educate non-GIS professionals about the importance of geospatial information systems and the benefits that GIS brings to our lives.

1. Spatial Analysis

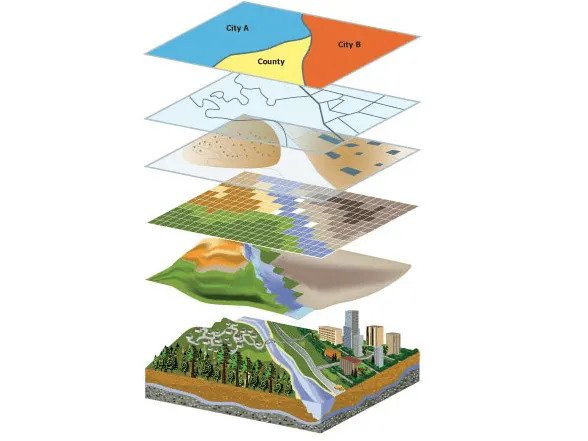
Any good and useful design involves analysis. This process of stacking layers, inspecting and interpreting model results seeks to solve complex location-oriented problems. This can be used for predictive analysis, estimating the level of suitability and for further understanding of the geographic location. 

spatial analysis

2. Layer 

Maps contain several layers, each representing a set of spatial features. Layers are laid atop one another for viewing or spatial analysis. This lends itself to working with the map layers in Illustrator, as they can be treated similarly to a layer containing artwork.  

3. Attributes

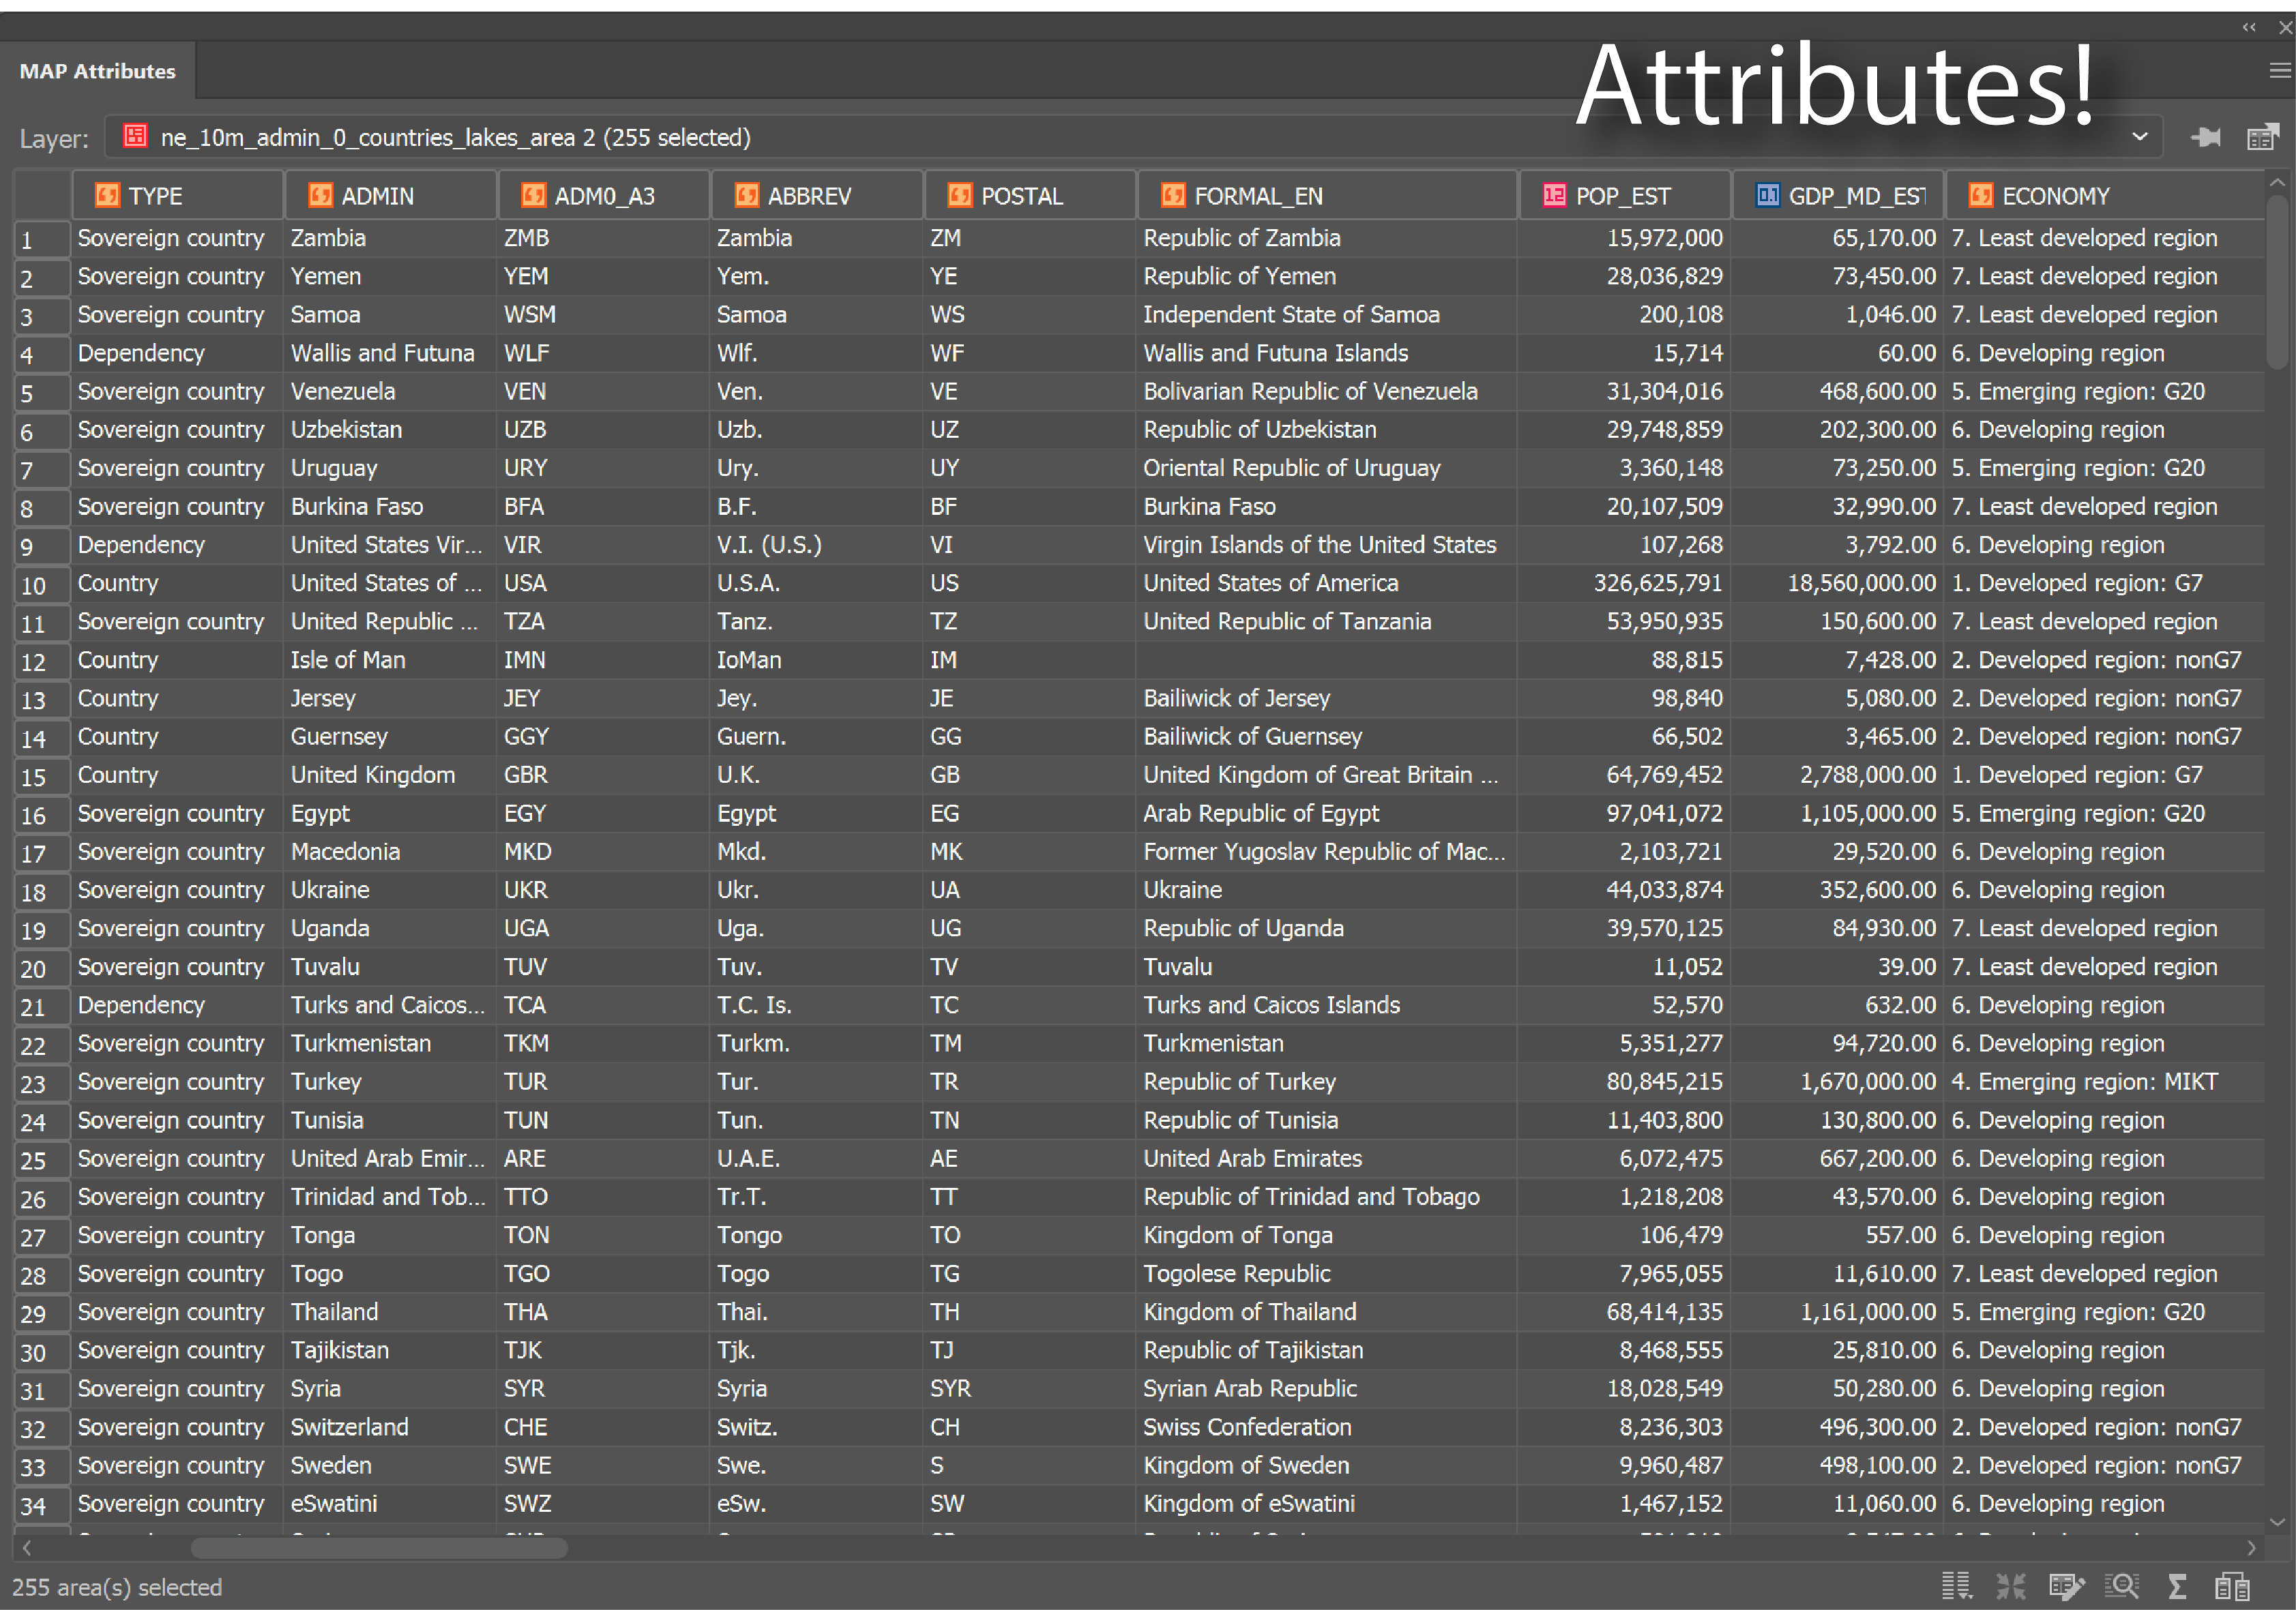
Attributes denote a geographic feature on a map. The information is typically stored in a tabular format that is linked to the feature. For instance, the attributes of a well-represented point along a river may include the name, the course of the river/ length, sediment load, etc. 

When you are familiar with the attributes associated with the map data, you can do things like applying rules to style your map according to attributes in the table.

4. Geocoding

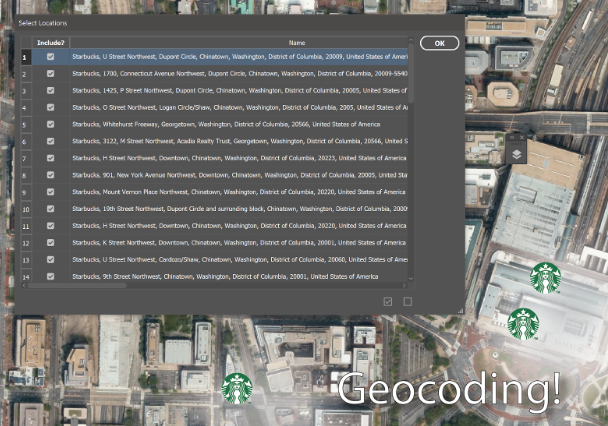
Geocoding

The process identifies a location by its geographic coordinates (latitude and longitude). This is used to position places and features on a map as well as to reference the map itself. 

5. Buffers

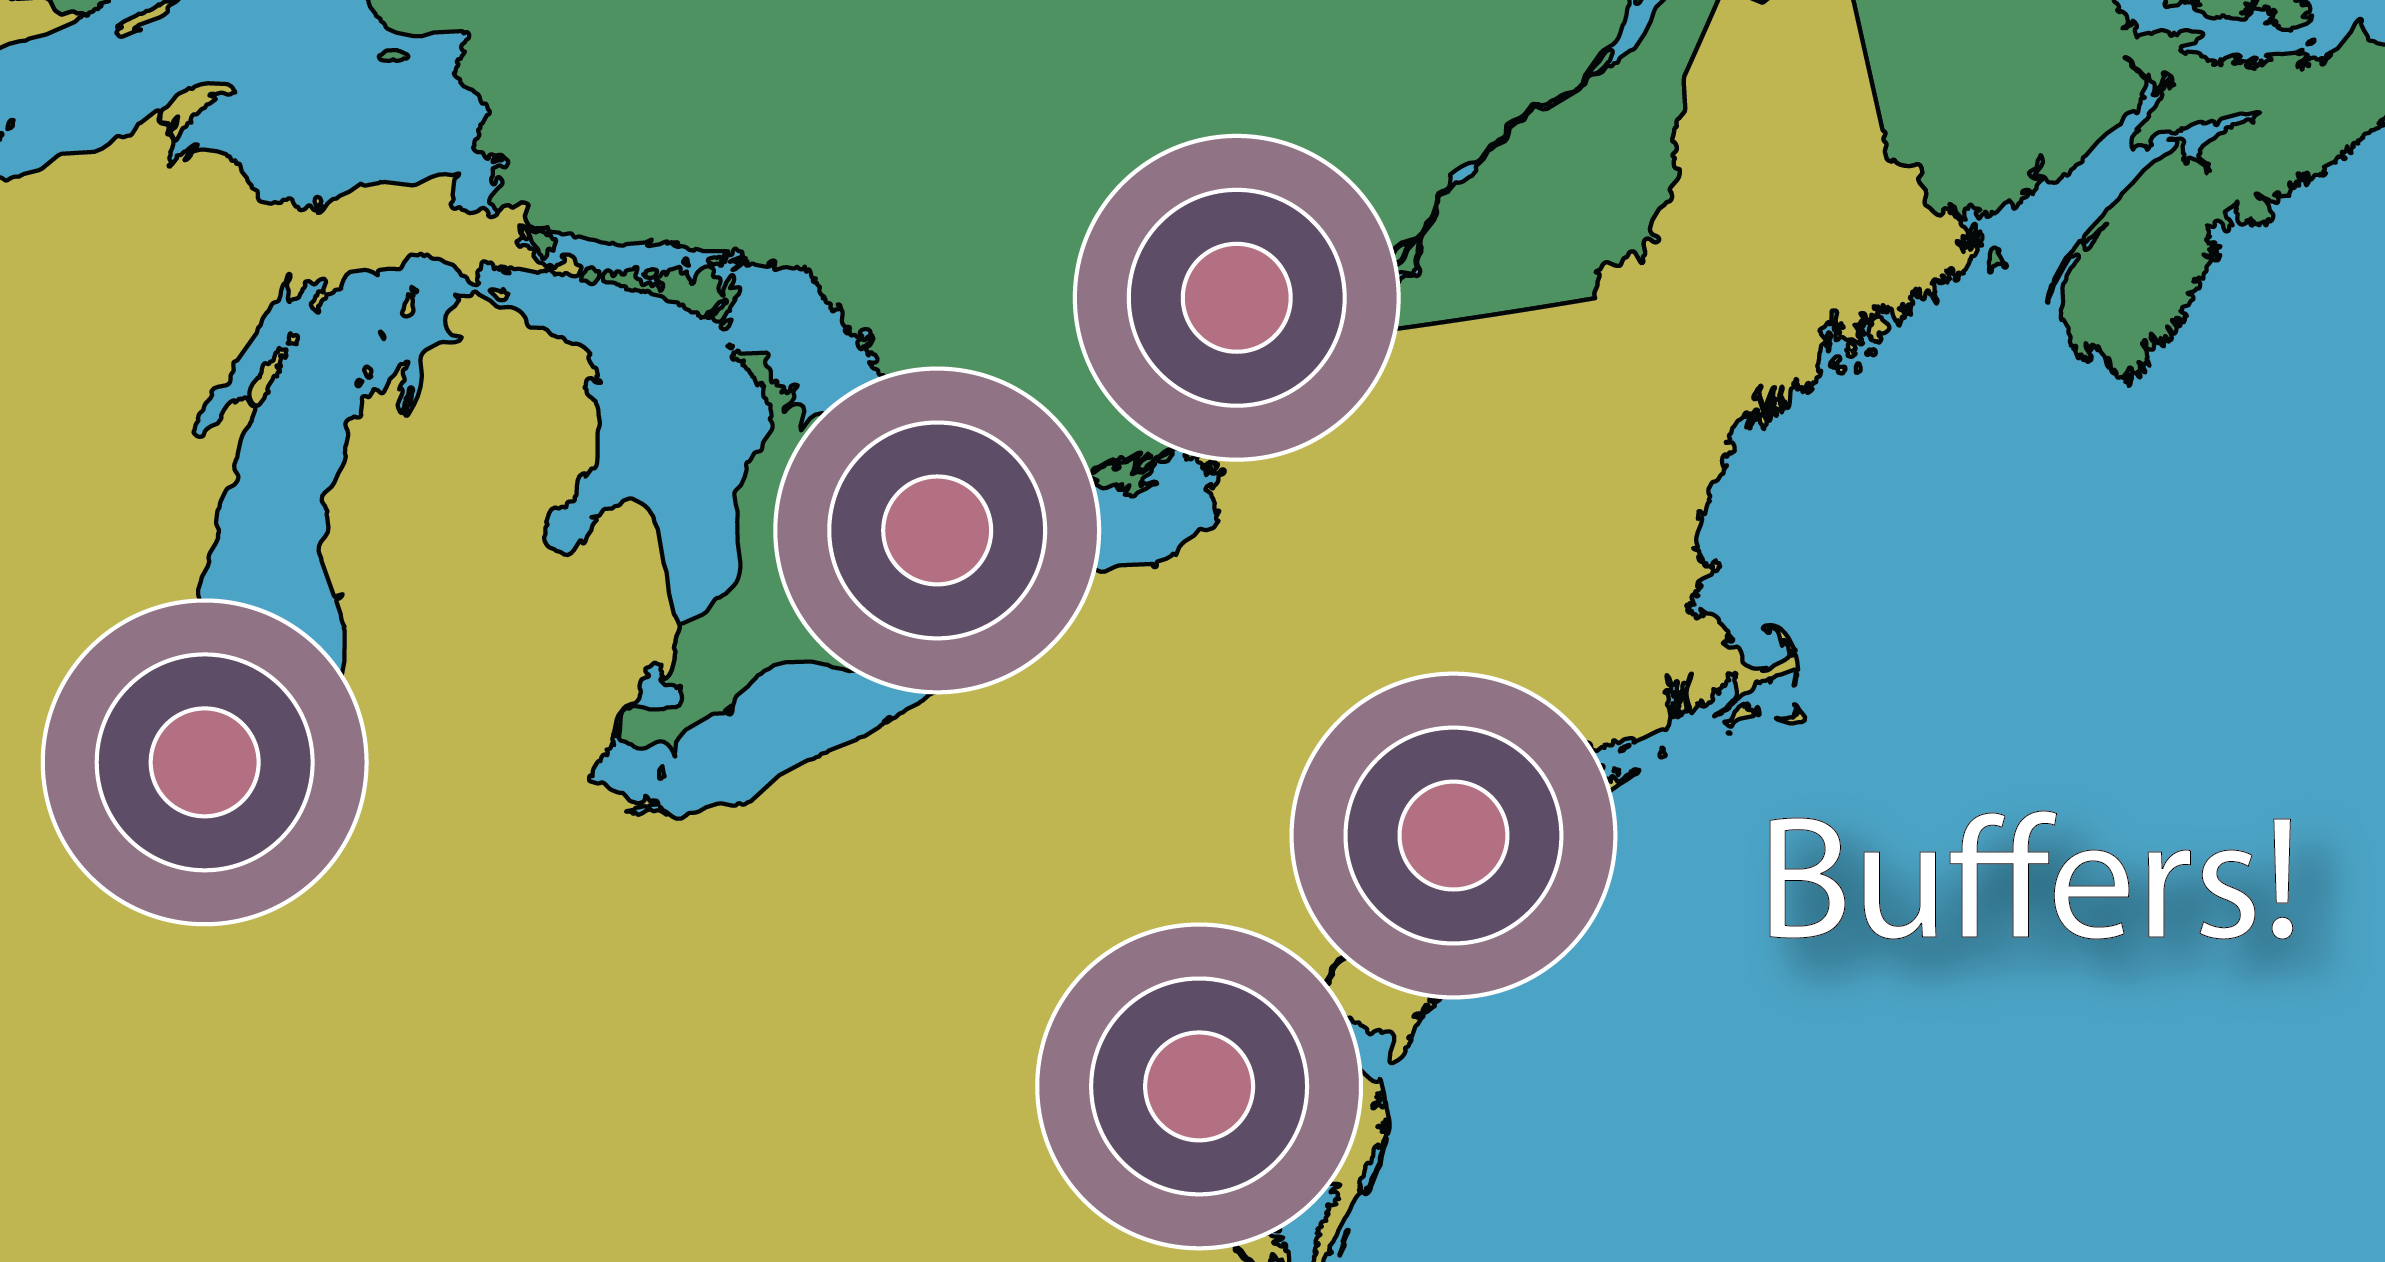
Buffer

A buffer is a zone around a specific map feature, that is measured in units of time or distance. A buffer is useful for proximity analysis or visualizing the areas that are within a certain distance from another feature (i.e. within school zones, or floodplains) 

6. Polygons/Areas

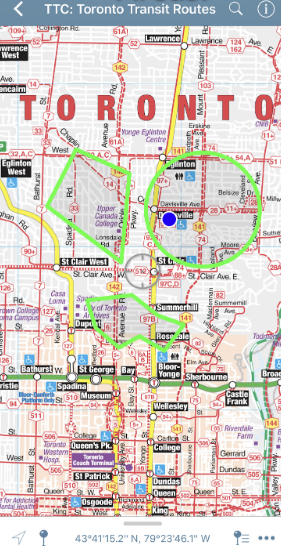
Areas / Polygons on a map

Enclosed Polygons on a map are often referred to as areas. Polygons can have attributes associated with them to represent a particular real-world entity such as postal code, economic identifiers, population demographics, environmental factors, or social behaviors.

The image above depicts areas on a map.

7. Coordinate systems

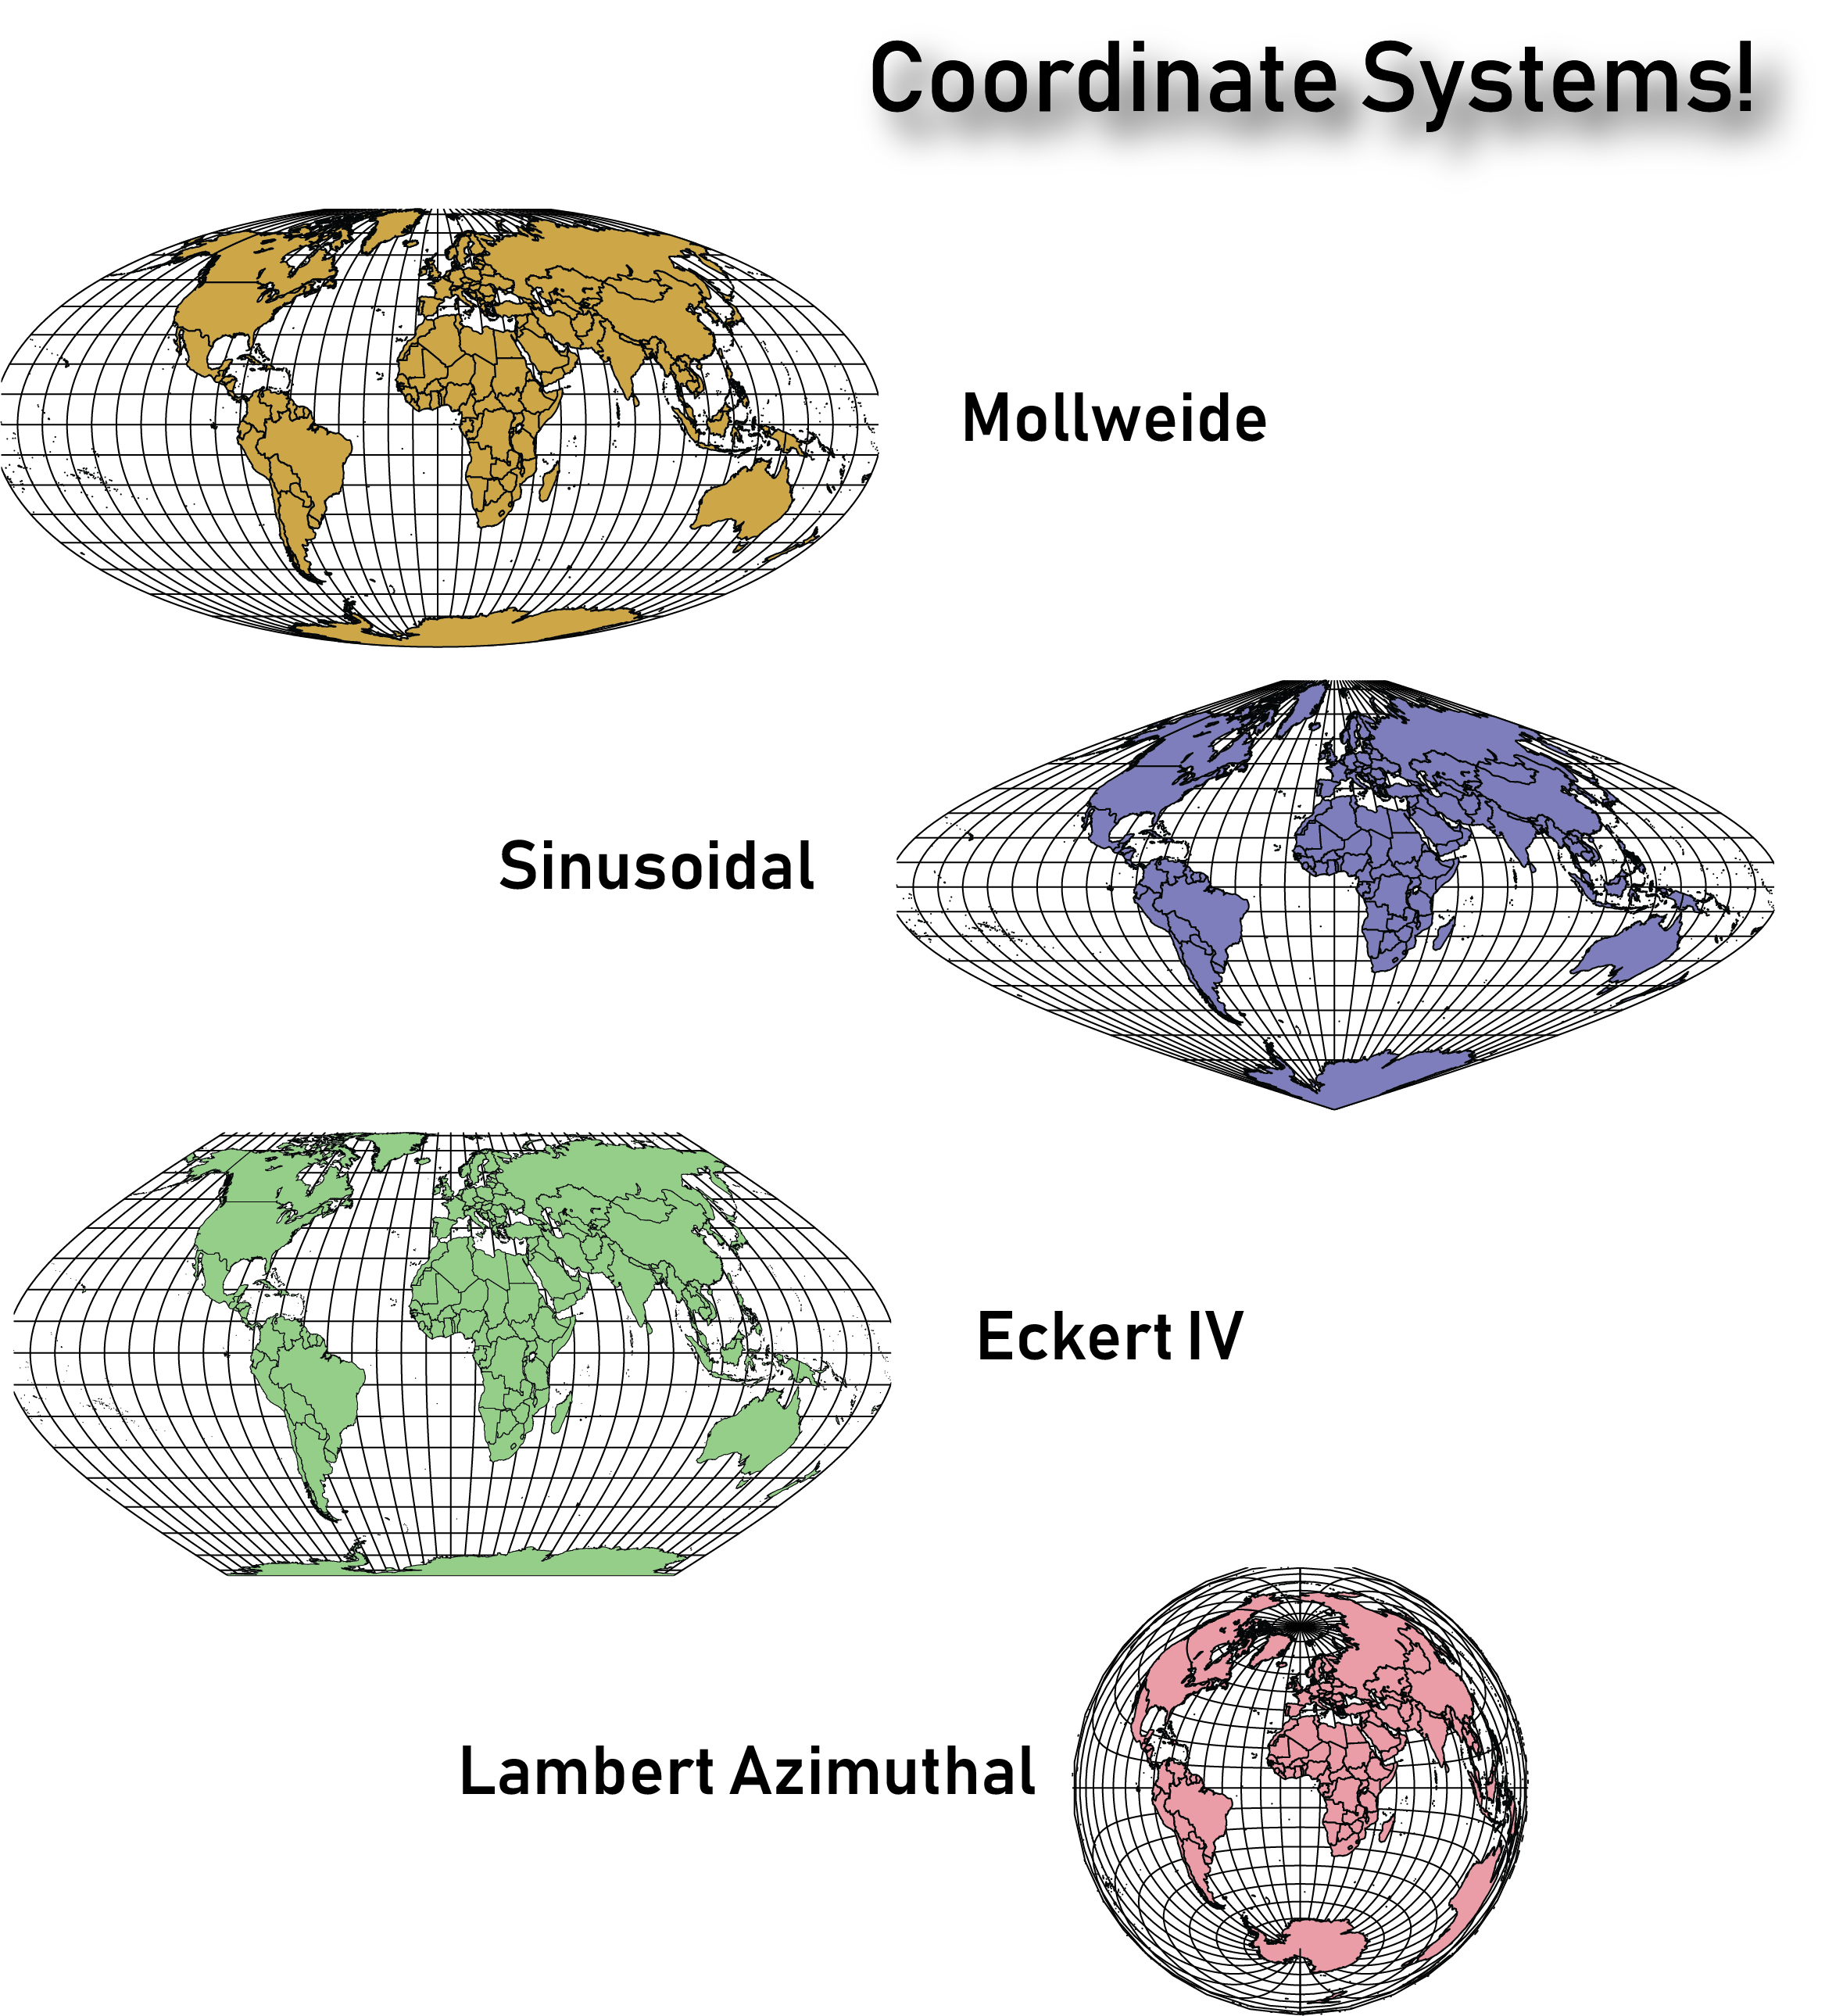
The planet is not flat, however, we routinely try to represent it in 2 dimensions on paper and screens. The Coordinate systems act as a reference framework that helps position features in order to make a map more useful for the purpose desired.

Coordinate Systems

It is important to note that there are thousands of coordinate systems, so it’s important to take the time to figure out which would work best for the type of map you intend on creating. Sometimes you’ll need to change the coordinate system from the one defined in the underlying map data, to help the map make more sense to the end-user. 

They say an artist is one who gives people something they didn’t know they were missing. If you happen to be an artist or know an artist (graphic designer) who seeks to give people direction – literally ‘direction’ – you’ve landed in the right place. Go ahead and share this article with like-minded map enthusiasts to begin learning and delivering high-quality maps the easy way. 

Sources:

https://researchguides.dartmouth.edu/gis/spatialanalysis

https://en.wikipedia.org/wiki/Buffer_(GIS)

What’s New? MAPublisher 10.5

MAPublisher 10.5 was released today and it has lots of new and improved features to make it even easier to make beautiful maps in Adobe Illustrator. If you’re new to MAPublisher, you can get a rundown of the full feature set here, and even try it free for 14 days. If you already use MAPublisher, we would love for you to tell us, on our Facebook page about your favourite feature or even share a map you’ve made!

Adobe 2020 Compatibility

This version of MAPublisher is fully compatible with Adobe Illustrator 2020 so go ahead and upgrade! Are you excited? We are too, but mostly about the other new stuff that is also included in this version of MAPublisher.

Interval Markers

Want to add mileage markers or mark intervals along roads, trails or other paths? Do it automatically using this new feature! Options for interval markers are found in the Path Utilities tool.

  • Define the distance of the interval and the units
  • Select and style the shape of the interval marker
  • Choose the font type, size, and spacing within the marker shape
  • Choose where to start and how to increment the markers


Map without interval markers - MAPublisher

Interval Marker Dialog Box

Map with interval markers - MAPublisher

Favourite Fonts

Tired of scrolling through hundreds of irrelevant fonts to find the ones you like? Now you can select your favourite fonts to appear at the top of the font selection list in Illustrator, saving you time and the reactivation of your repetitive stress injury. Recently used fonts will also appear at the top of the list.

NOTE: Screenshot is for illustrative purposes only. We do not advocate for the use of the Comic Sans font by anyone, at any time, for any reason. Ever.)

Customizable MAPublisher Toolbar

MAPublisher has a lot of tools. That’s a good thing, right? But let’s say you’re in a minimalist mood, or just want to simplify your life by tidying up the clutter. Customize the MAPublisher toolbar by selecting which tool categories to display on the toolbar, and hiding the ones you don’t use often. Ahh, now that’s better.

Customize the MAPublisher toolbar

Display Coordinate System Information on Scale Bar

Often, maps include the name of the coordinate systems in which the map is displayed, for reference purposes. It’s easy enough to create a text box and add this information manually, but we’re all about avoiding manual work.

Click the Display coordinate system checkbox in the Scale Bar to include the MAP View coordinate system as part of the scale bar.

  • Customize the label so that it reads the way you want it to
  • Decide on the positioning of the text above, below or beside the scale bar
  • Choose to center or align the label as you see fit

Add coordinate systems automatically

Other Useful Enhancements

MAP Attributes

You can now copy ‘read-only’ attribute values from MAP Attributes. Presumably, if you need or want to use this capability, the description of it probably makes sense to you.   

Copy MAP Objects

In the past, you could not automatically link copied objects to layers in the destination document if it contained layers with the same name as the layer in which the copied object originated. Still with us? 

Now you can automatically link objects (MAP Themes and Selections) to layers even if the destination document contains layers with the same name as the source document layer which is tied to the copied object. Now, grab a cup of peppermint tea and look at that neat and tidy toolbar for a few minutes to refocus. 

MAP Symbols 

New Oil & Gas symbols have been added to the MAP Symbols Library, as requested by users in this industry. 

MAPublisher makes it easy to make maps in Adobe Illustrator without the manual work, and with the flexibility to style and design maps while retaining the geospatial integrity of the map data. It’s the bridge between the art and science of cartography.

GIS Vector Formats in Adobe Photoshop. They Are Finally Here!

It’s an exciting day for anyone who works with geospatial imagery, especially if your workflow involves editing images in Adobe Photoshop. We released a brand new version of Geographic Imager® – the plug-in for Photoshop that provides tools to make tasks like reprojecting, georeferencing, and terrain shading possible.

In addition to the new features like vector data import and Equal Earth projection support, we also improved many of the existing features that were already there (after all, Geographic Imager has improved the lives of cartographers for many years) and updated the interface so that it looks and feels just like the rest of the Adobe environment. Geographic Imager 6.0 is fully compatible with Adobe Photoshop 2019, and you can find the rest of the system requirements and compatibility requirements here.

Here’s a rundown of the new features you’ll find in Geographic Imager 6.0:

Vector Data Import

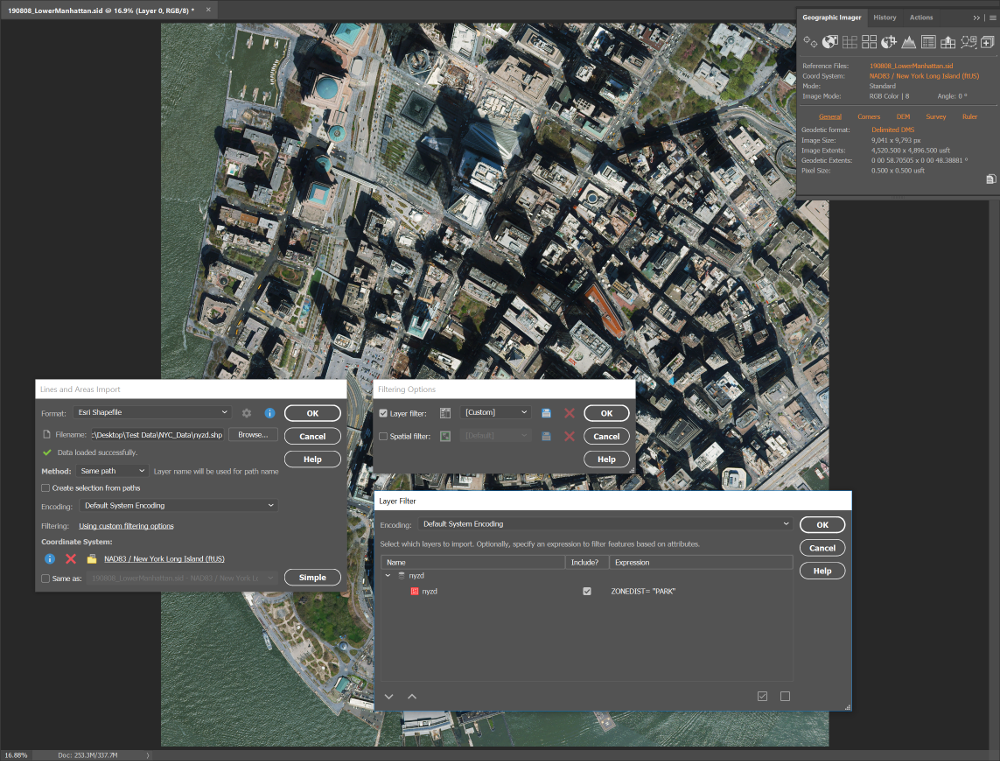
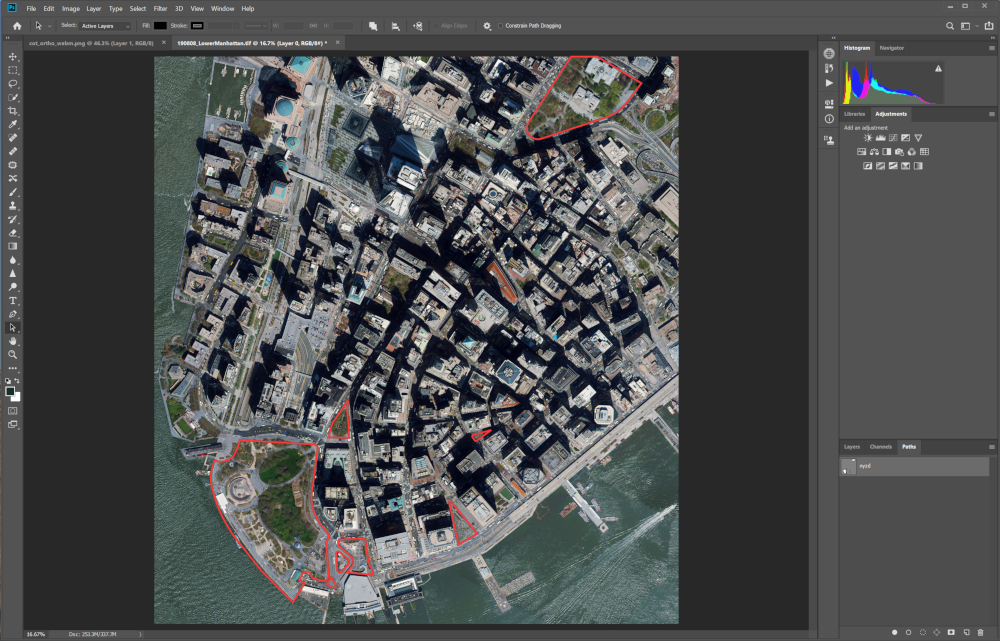
This long-awaited feature allows you to import a number of GIS vector formats directly on to your images. Whether performing a check to ensure accurate georeferencing, QA/QC or simply including supplemental data, these tools will improve the efficiency of your workflows. E.g. you can import your polygons from a shape file and convert them to pixel selections in one simple step!

Points and Text Import

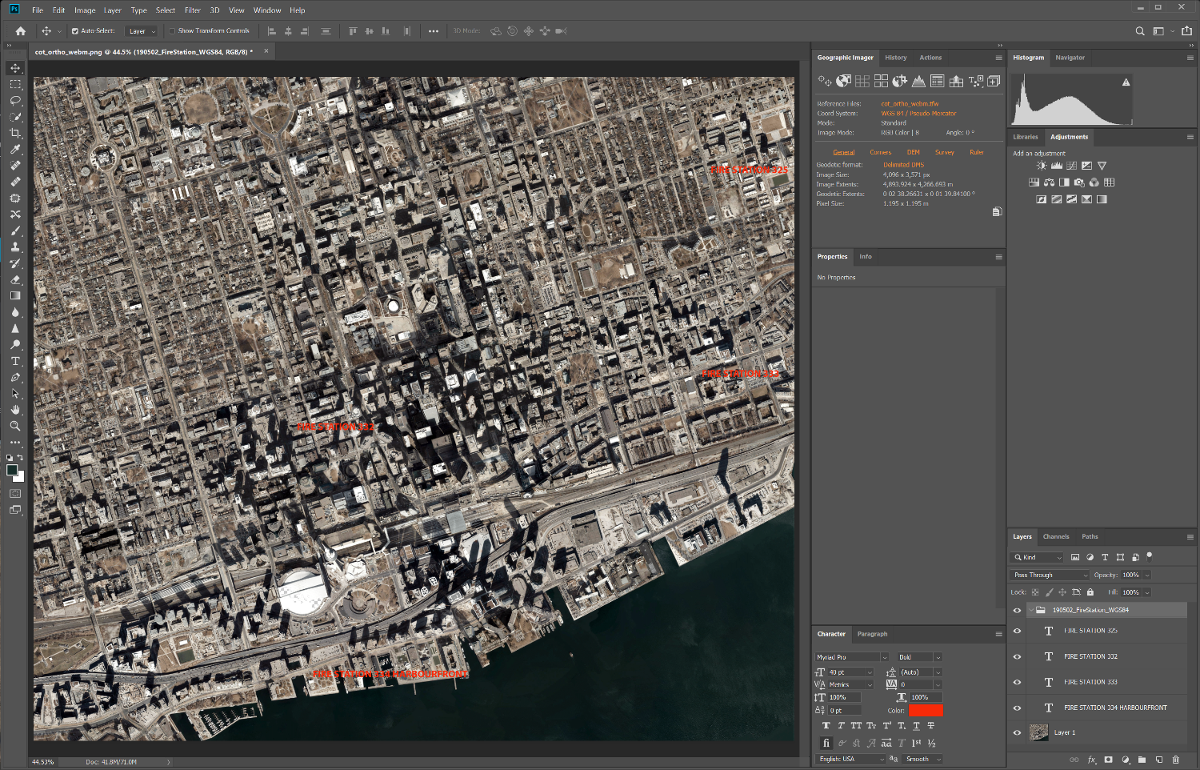
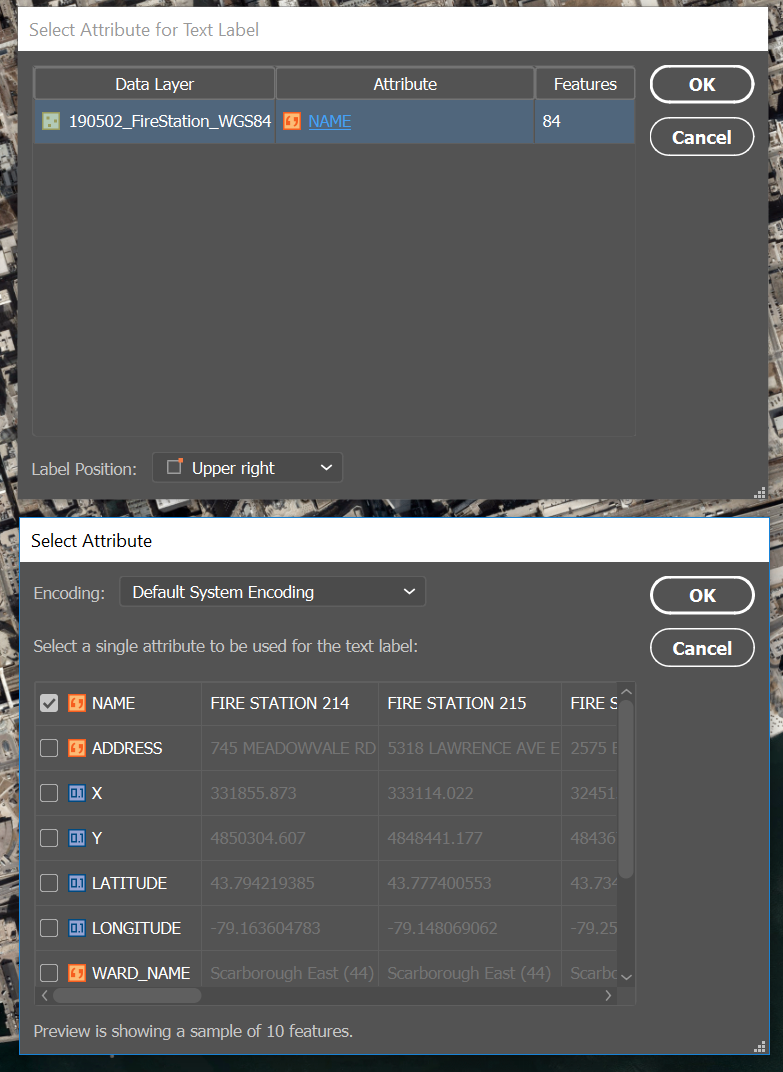
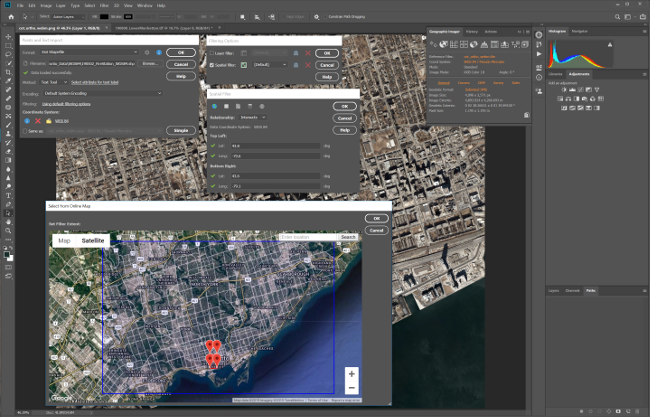
Now you can provide geographic context to your images by importing geospatial text data and converting it to cartographic labels, or simply importing points of interest and overlaying them on top of your image in a few clicks. Datasets consisting of point or text features can be imported as Text Layers or by using the Count or Note tools in Photoshop. When using the Text tool, an attribute may be selected to generate the text and the imported text features are grouped together by layer.


Geographic Imager - Import Point and Text Data

When importing with the Note tool, you can control which attributes to include (or exclude) in the note itself. The name of the layer and the feature it belongs to are automatically added to the note.

When importing with the Note tool, you can control which attributes to include (or exclude) in the note itself. The name of the layer and the feature it belongs to are automatically added to the note.

When importing using the Count tool, no attributes are imported; however, the points are grouped together by layer for easy identification and management.

Similar to the import feature in MAPublisher (for Adobe Illustrator), the spatial and layer filters ensure that you only import what you need.

Geographic Imager Point and Text Spatial Filter

Line and Area Import

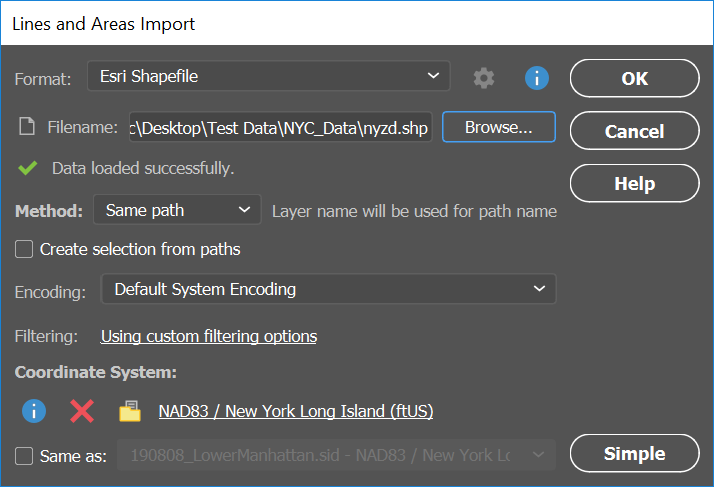
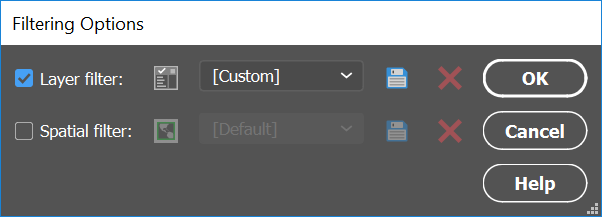
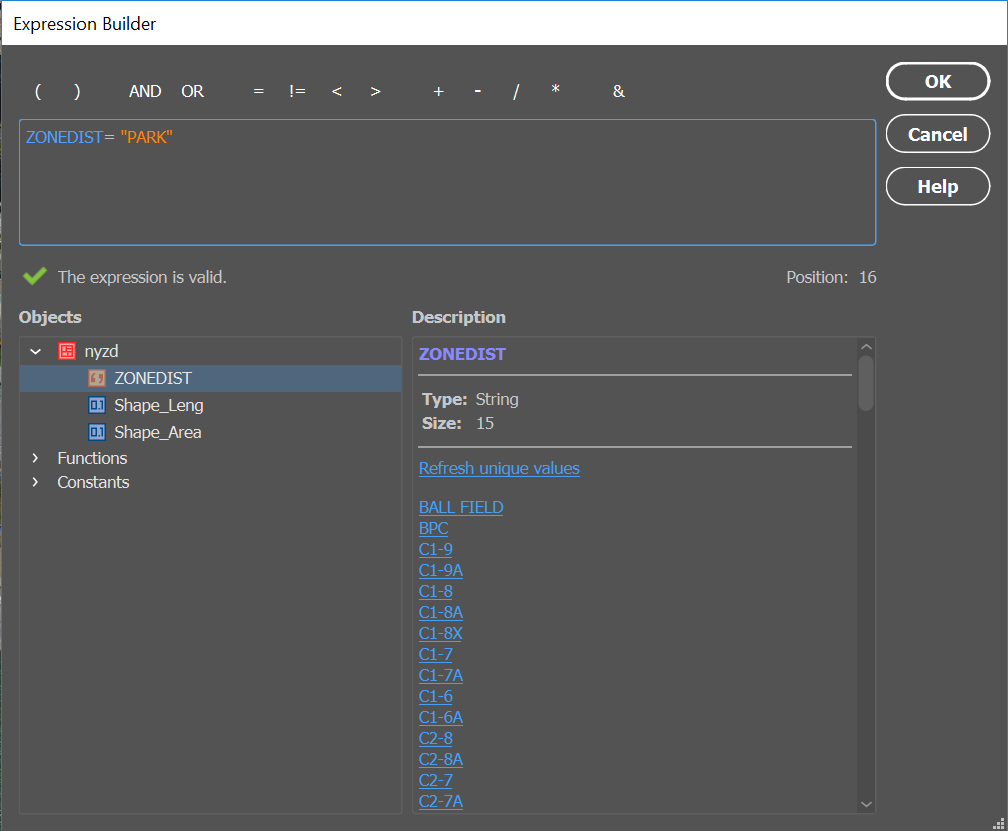
Polyline and polygon data can be imported as a single Photoshop path or each feature can be placed on its own path. The ‘Same path’ method is more beneficial when accessing individual features while the ‘Separate path’ method allows for more control over each feature. Here too, you can filter the data on import using spatial and layer filters, and you can choose attributes to use as path names.

Geographic Imager Lines and Areas Import

Geographic Imager Filtering Options

Geographic Imager Expression Builder

Set your preference before importing for how to handle lines and areas that extend beyond the extents of the canvas; either import only data that intersects the canvas, crop to the canvas, or import everything and allow the data to extend outside of the map area.

Geographic Imager Lines and Area Import

Venctor Area and Lines Import Geographic Imager


Support for the Equal Earth Projection

The Equal Earth projection is gaining popularity as it is intended to provide a visually pleasing alternative to the Gall-Peters projection, which shows landmasses at their true size relative to each other but drastically distorts their shape. With Geographic Imager 6.0 you can reproject virtually any map using Equal Earth (or hundreds of other supported coordinate systems). All of the geospatial information will be recalculated and preserved in the new projection. It’s that easy!

Equal Earth map

Look and Feel

We’ve updated the Geographic Imager tools and dialog boxes to more closely match the look of the Photoshop interface. When you change the appearance settings in Photoshop, the appearance of the Geographic Imager toolbars and dialog boxes will change to match. Nice, right?

Simplified Chinese Interface

Working with tools in multiple languages can be confusing. So, when the installed version of Photoshop is configured to use the Simplified Chinese language option, you will be prompted to install Geographic Imager in the Chinese language to maintain the continuity of the Geographic Imager experience. For now, Geographic Imager in Simplified Chinese is available for Windows only.

Try Geographic Imager 6.0 today and see how easy it can be – when you have the right tools – to work with spatial imagery in Photoshop!

Choosing the Right Colours for Your Next Map with ColorBrewer 2.0

One of the most difficult steps in map design is choosing an appropriate colour scheme that helps the viewer to visualize data. The colour scheme should also contribute to the esthetic of the map. It can be a delicate balance.  However, if you’ve worked in the realm of data visualization at any time during the past 20 years, whether it’s creating graphs, infographics or maps, there’s a good chance that you’ve used the ColorBrewer Color Advice tool to make colour selection easier.

ColorBrewer Preview

The ColorBrewer Color Advice tool was created in 2001 by Cynthia Brewer, an American professor of Geography. The tool was updated in 2013 by Brewer and contributors from Penn State University and Axis Maps. It’s an online tool for cartographers that suggests various colour schemes and previews what a map using those colours might look like. Change up the colour schemes to see how easy it is to distinguish the colours from one another on a map. The tool also makes it easier to see how outlier colours stand out against the rest of the colour scheme.

Since the ColorBrewer Color Advice tool is so useful for cartographers, we made it easily accessible in MAPublisher so that you can experiment with colour schemes while styling your maps in Adobe Illustrator. All the color ramps are available directly from the Illustrator Swatch Library. To access the colour ramps, go to the Swatches panel, then Swatch Library > MAP Swatches > ColorBrewer RBG or ColorBrewer CMYK.

Illustrator Swatches Panel       MAPublisher Color tool in Illustrator

Check out the ColorBrewer colour ramps next time you’re styling a map in Adobe Illustrator, using the MAPublisher plug-in, and see what a difference the right colour scheme can make to the readability and esthetic of your map!

How It’s Done in MAPublisher – Batch Generate Rules

MAP Themes are a great tool for stylizing your data quickly and easily. Since we all love to make our workload easier, did you know that you can batch generate rules for your MAP Theme Stylesheets instead of creating them all individually? Batch generate rules allows you to easily categorize your data and stylize it as you see fit.

Check out this short video that demonstrates how to use the batch generate rules tool in MAP Theme Stylesheets in MAPublisher!

For more How It’s Done in MAPublisher videos, check out our YouTube channel!

How It’s Done in MAPublisher – Adding North Arrows

Adding a north arrow to your map allows your map reader to better understand the direction of the map, and is a key tool for navigation. North arrows can be configured to a custom coordinate, such as magnetic north as well as true north.

Check out this short video that demonstrates how to create and configure north arrows in MAPublisher!

For more How It’s Done in MAPublisher videos, check out our YouTube channel!

Updating and Enhancing Maps with Landsat 8

This guest blog post was written by Tom Patterson — one of the creators of the Equal Earth Projection, and Natural Earth Data, (you can read more about Tom here). Learn how he used Geographic Imager for Adobe Photoshop to create two maps from Landsat 8 imagery.

I am a big fan of Landsat 8 satellite images as a resource when making maps. Typically, I use these free images taken every 16 days for verifying and updating other geospatial datasets. I also transfer Landsat textures to shaded relief art in order to better evoke a sense of the physical environment.

The examples that follow demonstrate how I have used Landsat imagery to enhance two maps. The first example is Prince William Sound, Alaska, a map that I am presently working on. The second example is a Landsat mosaic of the Big Island of Hawaii. Both of my examples will give you a general idea on how to integrate Landsat images into your cartographic workflow—using Avenza’s GIS plugins for Adobe Photoshop and Illustrator—with a few technical tips thrown in for good measure. For in-depth information about using Landsat in Photoshop, refer to this tutorial.

Prince William Sound, Alaska

Prince William Sound, in south-central Alaska, is a spectacular place to map. Its sheltered waters are bounded by the lofty Chugach Mountains, indented by deep fjords with tidewater glaciers, and dotted by forest-cloaked islands. The problem I am facing is out-of-date geospatial data because of the rapidly melting of glaciers. For example, the positions of glaciers, lakes, rivers, and coastlines available in the National Hydro Dataset (NHD) have changed considerably since these data were collected between 2008 and 2012. In order to make an accurate map—if only for this year—I have had to re-digitize these vector elements using Landsat images as a reference.

For this task, I used “LandsatLook Images with Geographic Reference” downloaded from the Earth Explorer website. These quasi-natural color images, which come pre-made from bands 7, 5, and 3, clearly depict water bodies, vegetation, bare earth, and glaciers. They were perfect for mapping the changing landscape of Prince William Sound.

Tom Patterson Geographic ImagerNational Hydro Dataset lines overlaid on a LandsatLook image in Adobe Illustrator.
The lines do not match physical features on the more recent satellite image.

For reference, I used images taken on September 29, 2018, about the time when glacier melting ceases before the onset of winter. Images taken later in the fall are hampered by fresh snow cover and deep mountain shadows due to lower sun angles.

Because the LandsatLook images were in the same projection as my map, I could directly place and then register the images in the Adobe Illustrator file with MAPublisher. Had the projections been different, I first would have had to transform the LandsatLook images using the Geographic Imager plugin in Adobe Photoshop. Finally, I moved the LandsatLook images to a bottom layer and dimmed them for editing the lines with Illustrator’s Pencil tool. Using a Wacom tablet and stylus for editing lines greatly improved my drawing speed and accuracy.

If a 30-meter LandsatLook image lacks enough detail, you can increase the apparent resolution to 15 meters by applying panchromatic sharpening. Doing this will involve downloading all data bands that comprise the Landsat scene (a Zipped archive about 1 GB in size). Within this archive is Band 8, a grayscale image showing the same area as the LandsatLook image, but with double the resolution.

Tom Patterson Geographic ImagerComing into focus. A LandsatLook image before (left) and after (right) panchromatic sharpening.
Besides increasing detail, panchromatic sharpening also shifts colors.

Once Band 8 is downloaded, the first step is to enlarge the size of the LandsatLook image by 200 percent in Photoshop (Image/Image Size). Resample it using the Preserve Details (enlargement) option. Next, copy and paste Band 8 on top of the LandsatLook image. Then, in the Layers window, change the blending mode of the Band 8 layer from Normal to Luminosity. Finally, apply Curves adjustments to both layers until the tonal range of the combined image is to your liking. The pan-sharpened LandsatLook image will keep its georeferencing thanks to the Geographic Imager plugin.

Tom Patterson Geographic Imager Landsat8Use the Layers window in Photoshop to apply panchromatic sharpening. 
Selecting Luminosity blending mode for the Band 8 layer is key.

The Big Island, Hawaii

In 2017, I created a Landsat mosaic of the Big Island as a starting point for making two National Park Service maps: Ala Kahakai National Historic Trail and Hawaii Volcanoes National Park. I used the Landsat mosaic as a source for land cover textures—forest cover and historic lava flows (those that formed since 1800)—depicted on these maps. Compared to the Landsat mosaic, the map textures print very lightly in the interest of visual cleanliness.

Tom Patterson Geographic ImagerBig Island Landsat mosaic (left) and the maps of Ala Kahakai National Historic Trail (middle) and Hawaii Volcanoes National Park (right) derived from it. Click here to see a larger version of the Ala Kahakai map (5 MB) and here for the Hawaii Volcanoes map (6.4 MB).

The first step in creating a Landsat mosaic was downloading the appropriate image data. In a perfect world, a mosaic of the Big Island would only require four 185-kilometer-wide Landsat images. However, because of persistent cloudiness on the windward side of the island, ten images were needed to complete a nearly cloud-free mosaic. Using images taken in previous years was a necessity. When selecting older images with fewer clouds, I looked for those taken at about the same time of year to keep the lighting consistent. I then used the Clone Stamp and Spot Healing Brush tools in Photoshop to carefully delete any unavoidable clouds and their shadows from the mosaic. Fortunately, the few clouds that remained were in remote areas far from the main focus of the final maps.
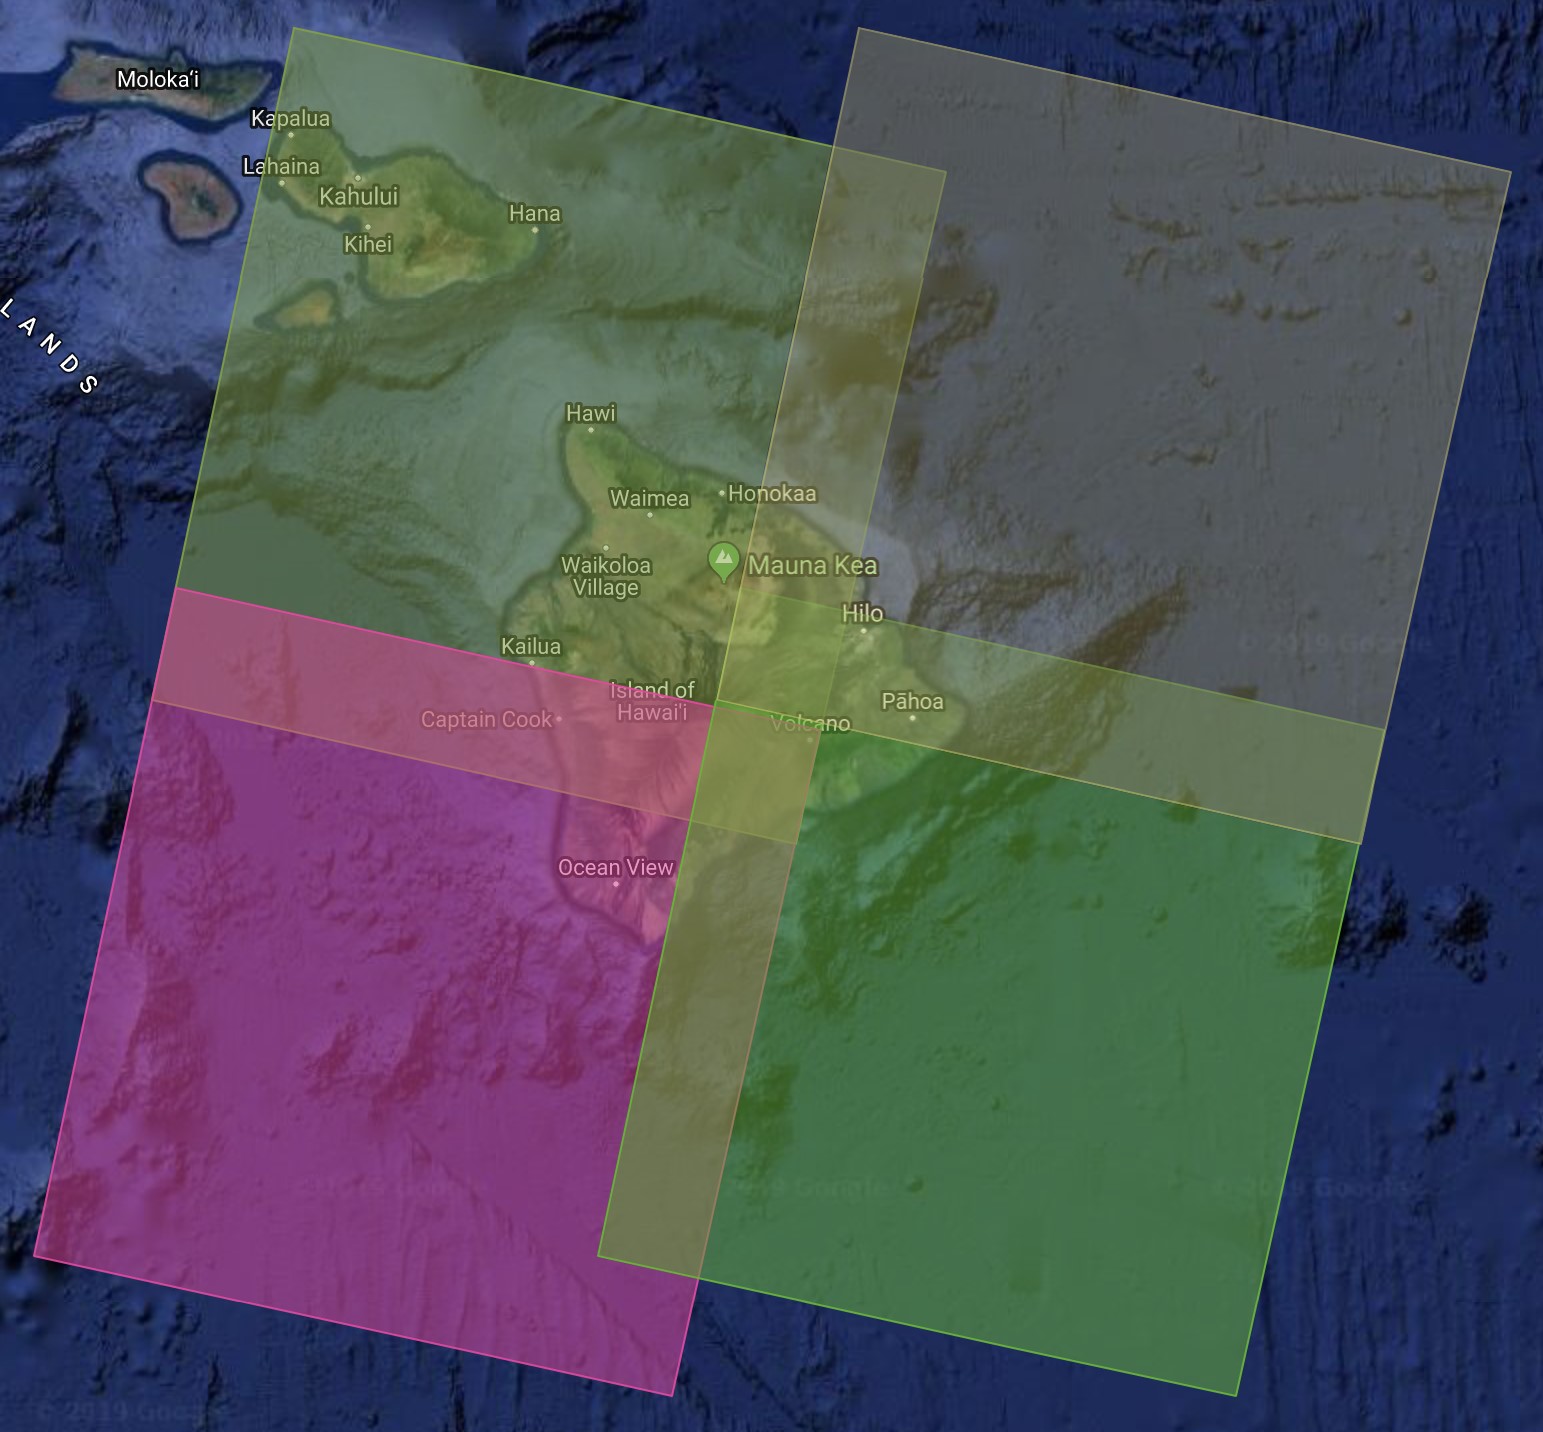
Tom Patterson Geographic ImagerThe Big Island is covered by four overlapping Landsat images.

Tom Patterson Geographic Imager Landsat 8Clouds be gone. The Landsat mosaic before (left) and after (right) editing.

The Landsat mosaic was assembled in Photoshop using Geographic Imager (File/Automate/GI: Mosaic). In the Mosaic window, I selected the Maintain Layers option to ensure that each Landsat image was placed on a separate layer. I then added layer masks to each image layer to piece together the ten images with the goal of avoiding clouds. Although the masks themselves with feathered edges looked like a messy jig-saw puzzle, they combined to produce a seamless Landsat satellite image mosaic.

Tom Patterson Geographic Imager MosaicGeographic Imager’s Mosaic window.

I created the Big Island mosaic in natural color by compositing Bands 4, 3, and 2 as red, green, and blue channels, respectively, in Photoshop. I also brightened the forested areas with LandsatLook mosaic placed on the topmost Photoshop layer and with the layer opacity reduced (in normal blending mode). The natural color procedure is explained in detail here.

With a Landsat mosaic of the Big Island completed, my next task was extracting the forest and lava textures and applying them to the Ala Kahakai and Hawaii Volcanoes maps. But that was an involved procedure that will have to wait for another blog.

One more thing …

Since making the Big Island mosaic in 2017, the Puna district experienced volcanic activity in 2018 that covered a large area in lava and reconfigured the shoreline. Although Puna is the cloudiest area on the Big Island, I was lucky to find a recent cloud-free Landsat image that I then used to update the mosaic. You can download a GeoTIFF of the updated mosaic here (120 MB). It is in the public domain.
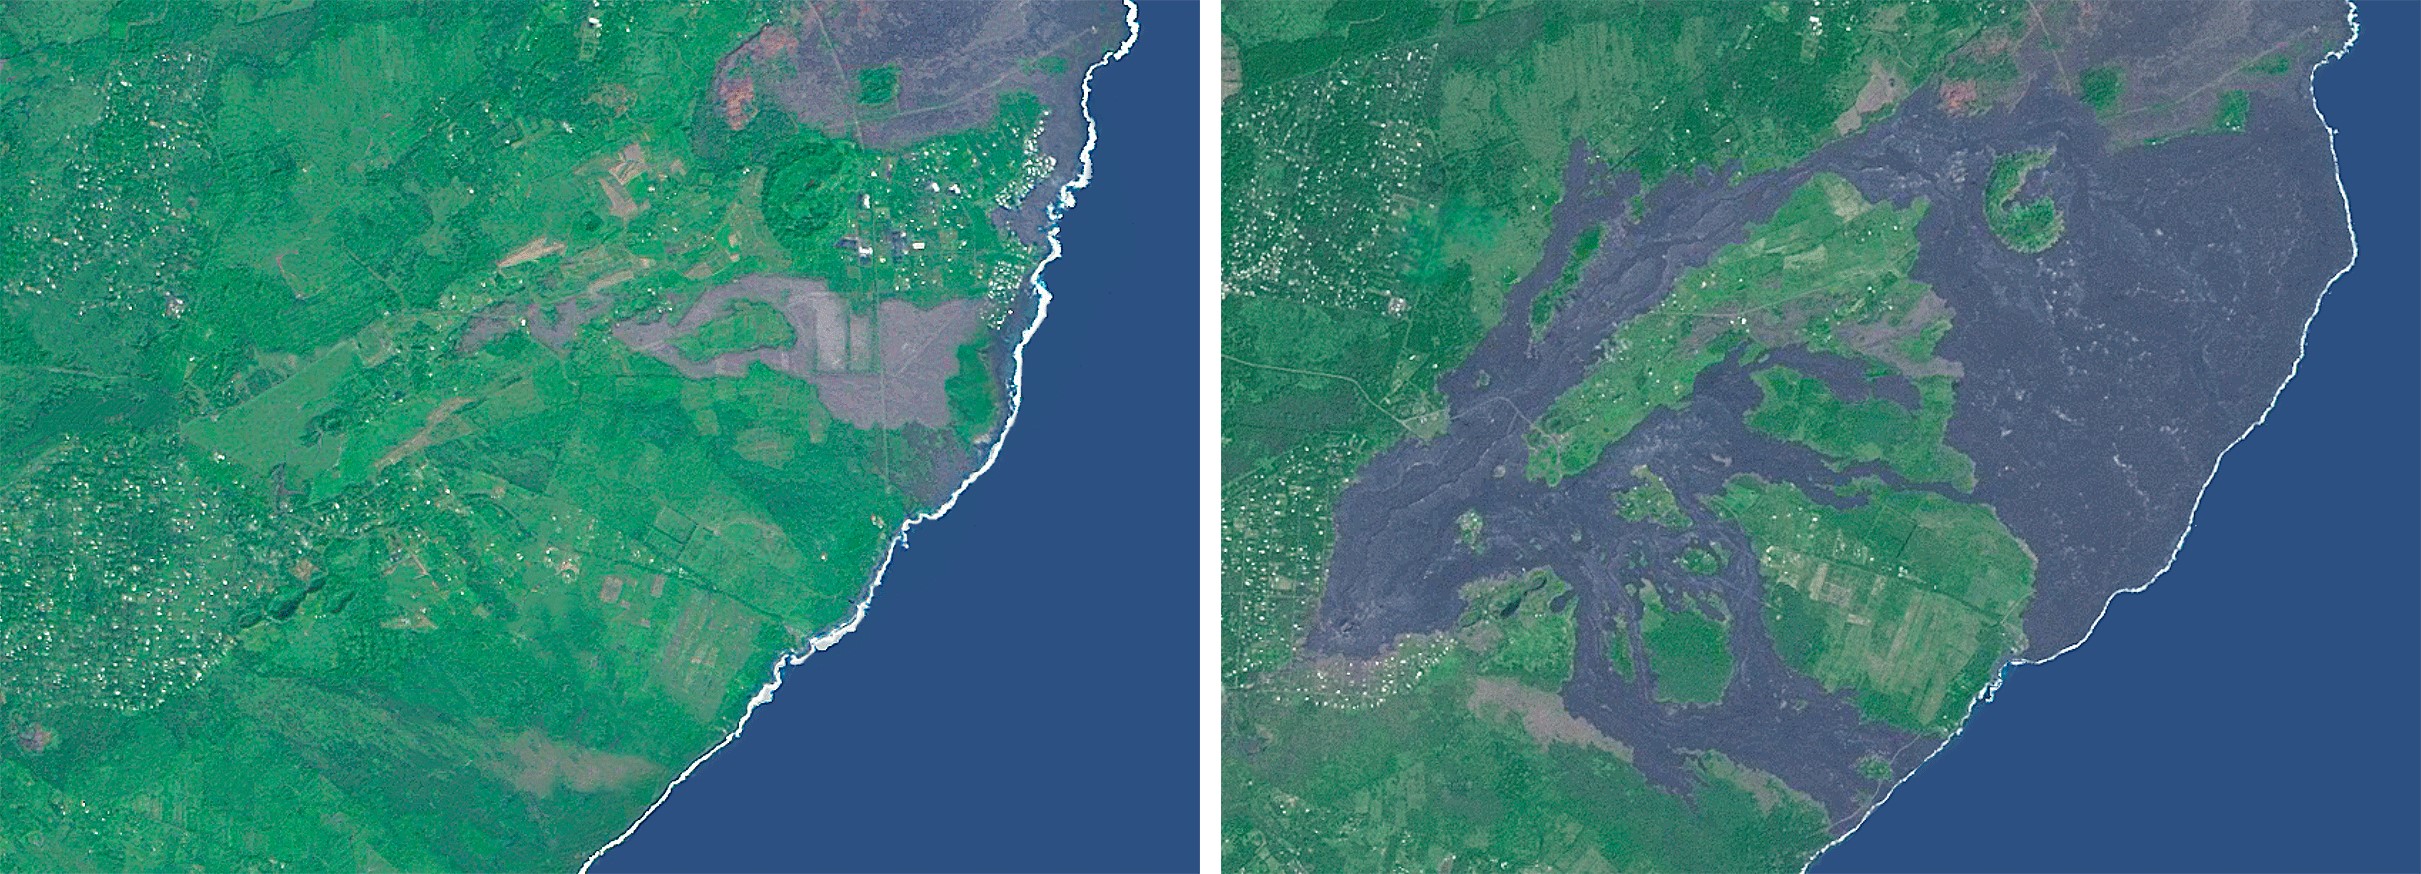
Tom Patterson Geographic ImagerPuna District, Hawaii, before (left) and after (right) the volcanic eruptions of 2018.
New Release – Avenza Maps 3.7

Avenza Maps version 3.7 is now available for users on iOS and Android devices! We have added features for both our recreational and Pro subscription users and made some improvements based on user feedback. The newest version of Avenza Maps includes features that will facilitate location monitoring, improve the precision of your data collection and enhance your Avenza Maps experience!

Geofences

New in Avenza Maps 3.7, is Geofencing. These are virtual perimeters or boundaries that are set up around a geographic location. When you approach or leave one of the boundaries, the app triggers a notification on your device. You have the option to create geofences around features in any map including placemarks, tracks, lines, areas, layers, and even the map itself.

Avenza Maps Geofence Options

Geofences act as a location monitoring tool in order to keep track of your location without needing your phone in your hand at all times! With global geofence notification capability (a Pro feature), you can ensure that you never miss an alert because regardless of the map you have open, your global geofence will always be active.

Avenza Maps Geofences

Avenza Maps Geofence Notification

Plot GPS Average

Pro users can increase the integrity and precision of location data by using the new Plot GPS Average tool to plot placemarks. The tool works by sampling your location over a period of time then deriving the average of the location samples and plotting a placemark on the map.

Avenza Maps Pro - GPS Averaging

Avenza Maps Pro - GPS Averaging

Map Versions

Avenza Map Store Publishers can now release updates directly to their existing products! Now when an update to one of your previously downloaded maps is released by the publisher, you will be notified in the app and prompted to install the newest version. The notification will appear as a button under the current map that says Update Available. We recommend updating your maps but if you would prefer not to, you can decline the upgrade and the update option disappears.

Avenza Map Store - Map Versions

Avenza Map Store - Map Versions

Any map data linked to the previous version will transfer to the new version of the map. So, if for example, you have a trail map that you use to collect your tracks or plot placemarks, you won’t lose a thing!

There are some big changes and improvements in this version of the app and we’re very excited about it. Our goal is always to ensure that Avenza Maps users can navigate safely and efficiently and collect data even more precisely in the app!

Learn more about all of the new Avenza Maps features in the ‘On the Map’ blog on avenzamaps.com


News Archive