My Account     Contact Us     Cart

Cartographer Chronicles: Alison DeGraff Ollivierre

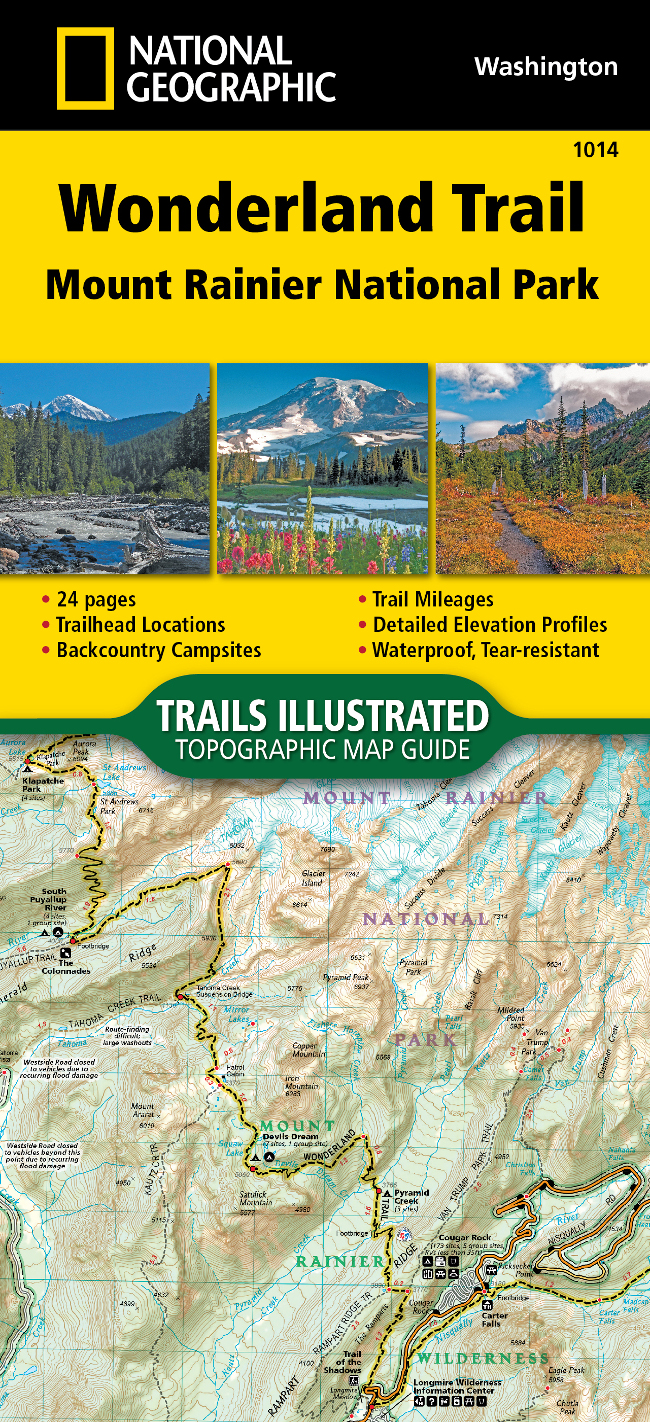
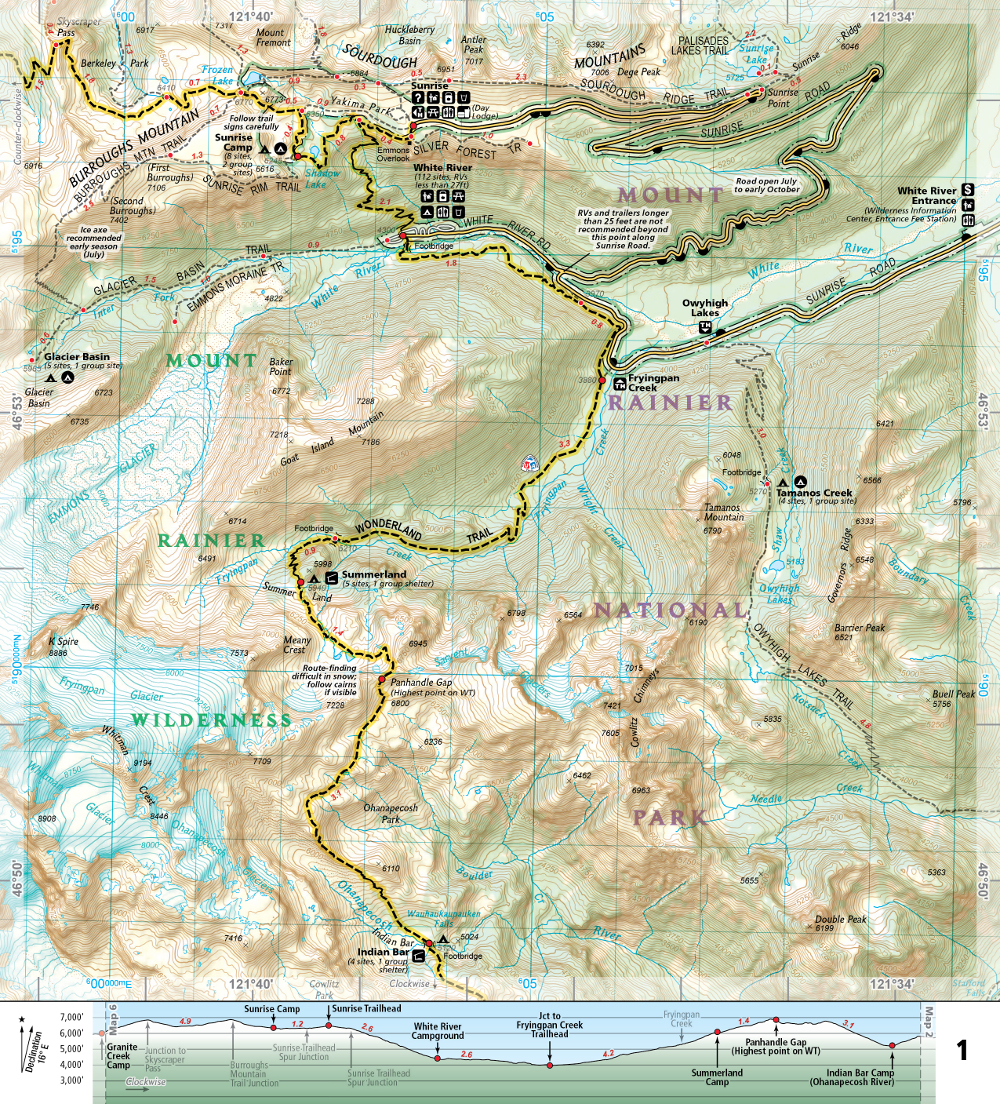
Alison DeGraff Ollivierre caught the geo/carto-bug from an introductory geography course in her first semester at Middlebury College, quickly realizing that the discipline was the perfect combination of her diverse interests in global affairs, conservation, history, and sociology. Now a cartographer at National Geographic Maps, Ollivierre works on the Trails Illustrated topographic outdoor recreation map products from an office in Colorado, making it easy for her to always be planning her next hike or trip to a National Park.

Ollivierre began her professional career as a Geography Intern at National Geographic in 2011, working with NatGeo Live and the Giant Traveling Maps. During her internship, she had the opportunity to make maps for a few NatGeo Explorer lectures and Giant Traveling Map fact cards, but what really stuck with her was how the incredible breadth of geography was used every day at NatGeo (and meeting Sylvia Earle—she thought that was pretty cool!). Since then she has gone on to win multiple awards for her cartography and was recently recognized by xyHt Magazine as a 40 Under 40 Remarkable Geospatial Professional for 2018.


As a certified GIS Professional, with a master’s degree in Geoinformatics from the University of the West Indies, Ollivierre knows geospatial data and how to handle it but also understands that—while the data is important—there is more that goes into making a good map than just the data. ‘I believe strongly in the importance of great design.’ explains Ollivierre. ‘It has the power to make geospatial data more engaging, interesting, and accessible to its audience.’

Ollivierre started using MAPublisher—a cartography plug-in for Adobe Illustrator—in 2016 when she returned to work at NatGeo after facilitating a participatory mapping project in the Eastern Caribbean, working as a cartographer and GIS specialist in Maine, and conducting freelance cartographic work for organizations across the globe. ‘I had played briefly around with a trial version of MAPublisher before that and heard a lot of great things about the software, so I was excited to learn how to use it at NatGeo Maps.’ says Ollivierre. ‘We complete 99% of our daily tasks in Illustrator + MAPublisher so its power is clearly evident in our workflow.’

Making quality maps that bring to life complex geospatial data requires a mix of science, art, and specialized tools to get it right. ‘I love the process of turning raw data into a map that clearly (and attractively!) gets its point across.’ says Ollivierre. ‘For me, MAPublisher is the obvious choice to bridge that gap between GIS and cartography.’

Find Alison on LinkedIn

Using MAPublisher and Adobe Illustrator to Make Infographics Easy

Infographics are a great way to transform less than exciting data into a visualization that is both digestible and fun to look at. Adobe Illustrator and MAPublisher work perfectly together to make infographics simple like the one I made for National Spumoni Day.

You might have noticed, we like to celebrate national food days here at Avenza Systems. Instead of making just a map to celebrate this layered frozen delight, I made an infographic, containing not just one but two maps! Using a combination of Adobe Illustrator and MAPublisher tools, this infographic has graphs and two maps teaching you fun facts all about spumoni, gelato, and ice cream. Curious about how I made it? Keep reading!

What is spumoni you may ask? Spumoni is a molded gelato with different layers and, usually containing nuts and fruit! Spumoni is usually 3-4 flavours. Cherry, pistachio, and chocolate or vanilla are the most common.
Make Easy Infographics

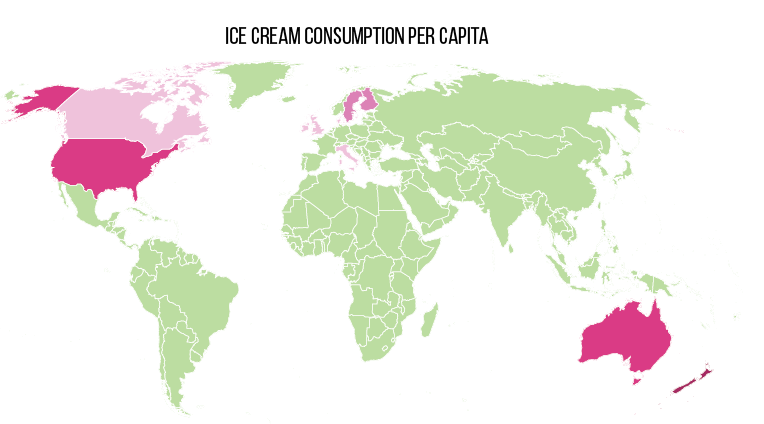
The infographic consists of two different maps; one showing the amount of ice cream eaten per capita around the world, and another showing the amount of milk produced per year by country.


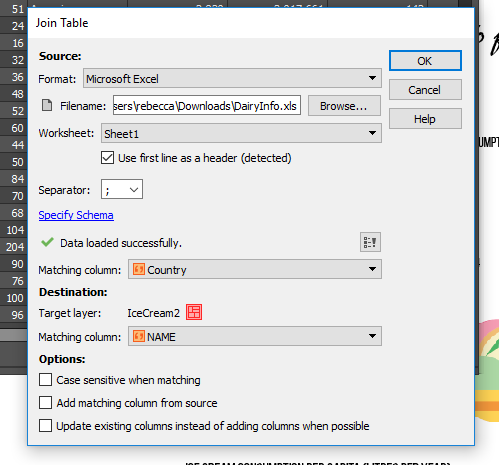
To create each map, an Excel spreadsheet was created with information about the countries milk production, as well as the average amount of ice cream eaten. Once the spreadsheet was created, I joined the tables in the MAP Attributes.

Join Table in MAPublisher

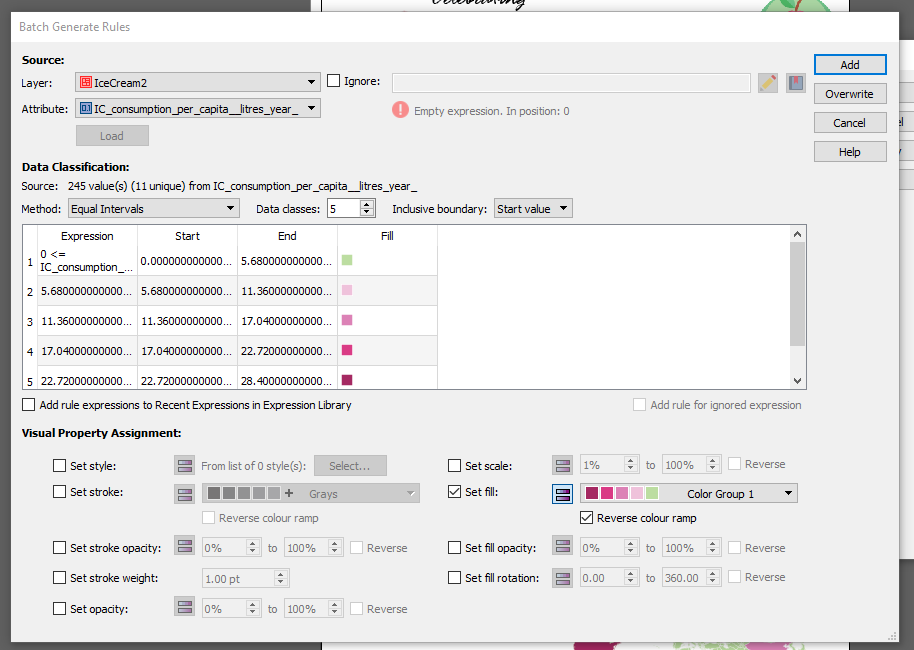
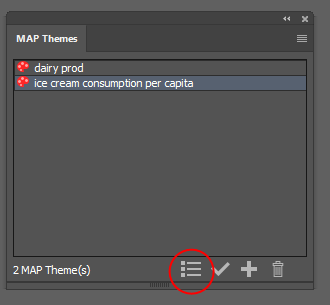
Once the tables were joined, I used MAP Themes to stylize the maps. MAP Themes are an easy way to stylize areas, lines, and points. I created a MAP Theme for each map, based on the attributes I created. One MAP Theme for the dairy production, and one for ice cream consumption. I used the ‘Batch Generate Rules’ option and chose 5 classes. I then chose the fill colour to be a custom colour group I created with spumoni-inspired colours.

Creating MAP Themes in MAPublisher

Once I’d generated my rules, I applied my MAP Theme. I then followed the same steps for the dairy production map.

Ice Cream Consumption Maps

My favourite part of MAP Themes is that it’s super easy to create a MAP Theme legend after. To create a MAP Theme legend, select your MAP Theme Stylesheet and click the Legend button at the bottom of the window.

Create a legend in MAPublisher

There are lots of options for customization when creating the legend. You can change the legend entries size, and the legend key font, size, colour, as well as details about the title, and the border.

Creating legends

Once the legend was created, I created the graphs using Adobe Illustrator’s Graph Tool. The graphs use the same colours as the maps, and for finishing touches I added the ice cream symbols and fun facts. Click below to see the finished infographic. Have fun celebrating National Spumoni Day, and have fun making your own infographics!

See the Infographic


About the Author

Rebecca Bennett is a member of the Support team at Avenza Systems and loves ice cream almost as much as she loves making creative and visually appealing maps.


How It’s Done in MAPublisher – Copy MAP Objects From Other Projects

The Copy MAP Objects From tool is used to copy MAP objects such as MAP Views, MAP Layers, MAP Themes, MAP Locations, and MAP Selections from one open document to another in Adobe Illustrator.

It’s super quick and easy to copy elements from one map project to another, as illustrated in this one-minute video.

For more How It’s Done videos subscribe to our YouTube Channel

How It’s Done in MAPublisher – Create Layer Filters to Import Map Data

Importing map data into MAPublisher can be a time-consuming process if the data set is very large. You can reduce the time it takes to import by filtering the data first, isolating only the layers that you need.

This quick video shows you how to create layer filters by selecting attributes, and also using expressions.

For more How It’s Done videos subscribe to our YouTube Channel

NACIS 38th Annual Meeting

North American Cartographic Information Society (NACIS) 38th Annual Meeting
Norfolk, VA
October 17 – 20, 2018

Love maps, data, visual storytelling, and cartographic design?

Join us at NACIS 2018 where professionals and enthusiasts from government, commercial, and not-for-profit groups along with academics, scholars, map/GIS librarians, artists, technologists, and students will meet.

Presentation: Thursday, October 18
Session: Web and Mobile Mapping I
Time: 2:00pm – 3:40pm

There and Back Again: Cartographic Journeys with Adobe CC, Mobile Mapping, and Navigation
In this presentation, Avenza’s Nick Burchell will provide a series of case studies on how maps created with the Avenza suite of tools are being used to solve tangible needs in the industries where we serve. Learn how our customers are creating high-quality, spatially aware cartographic products through MAPublisher and Geographic Imager in Adobe CC, and how they are using them for critical work in conjunction with the Avenza Maps app. We will also review some of the exciting new features in our products this year and highlight how our users have helped us make them a reality.

News Archive