My Account     Contact Us     Cart

Avenza releases PDF Maps beta for Android

– Beta version of Avenza’s geospatial PDF reader now available for Android devices-

Toronto, ON, February 12, 2013 – Avenza Systems Inc., the leading developer of cartographic software –including MAPublisher® for Adobe® Illustrator® and Geographic Imager® geospatial tools for Adobe Photoshop®– is pleased to announce the beta release of PDF Maps for Android, the popular map and navigation app, which was previously only available on the Apple iOS platform. The PDF Maps app allows users to explore and navigate maps offline without having to worry about cellular data connectivity or incur data roaming charges compared to other streaming map apps.

The PDF Maps beta for Android app has the following features comprising those which we expect to include in the final release of version 1.0 for Android.

  • Load Geospatial PDF, GeoPDF® and GeoTIFF maps
  • Add maps from the file system, Dropbox, a URL, or email
  • Show GPS position on custom maps
  • Add Placemarks
  • Find Coordinates
  • Measure Distance or Area
  • Open current view in Google Maps


Please note that access to the in-app Map Store, as found in the iOS version, will not be included in the beta release of PDF Maps for Android. As a result, maps must be loaded from the file system, Dropbox, email or a URL. The Map Store is at the top of the feature list for Android development and will be available as soon as possible.

The beta is available to all for a limited time and is compatible with most Android devices with Android 4.0 or higher. To register for the PDF Maps beta for Android, visit www.pdf-maps.com/android/beta.

For further information contact:
Tel: 416-487-5116
Email: info@avenza.com
Web: www.avenza.com

National Geographic Maps Now Available on Avenza’s PDF Maps App

Alliance provides new platform to access more than 500 National Geographic maps via Avenza’s database

TORONTO (January 28, 2013)National Geographic Maps, one of the most trusted names in cartography for nearly 100 years, has joined with Avenza Systems Inc. to offer a new channel to access its rich map content. The alliance enhances Avenza’s digital map database by adding more than 500 maps from National Geographic, a world-renowned source, and furthers National Geographic Maps’ established reach with mobile consumers.

The Avenza PDF Maps app takes advantage of geospatial technology and allows travelers, recreationists and map lovers to view, acquire and interact with maps on their mobile devices, including iPhone and iPad, without worrying about data accessibility and international roaming charges. In addition, PDF Maps offers an in-app store to facilitate the transaction and delivery of those maps, consolidating, in a digital format, consumers’ access to hundreds of maps from multiple publishers.

“In the last decade, advances in technology have shifted how consumers receive and use information, and we have responded by making our rich map content available on a variety of platforms,” said Charles Regan, senior vice president and general manager, National Geographic Maps. “Avenza’s PDF Maps app provides a unique way for consumers to access our content with an easy-to-use in-app map store and a set of robust features that will enhance the map user’s experience.”

Hundreds of maps from National Geographic Maps’ extensive library are now available in Avenza’s PDF Maps system, including popular travel and destination titles covering five continents, historical and thematic maps, and educational and reference titles. The app provides constant access to geographic information and points of interest, with additional interactive tools such as measuring, place marking and location tagging. PDF Maps operates without the risk of lost reception, due to cell tower proximity – making it the ultimate traveling tool, as it does not rely on an Internet connection.

“Avenza PDF Maps provides the ability for anyone to share map-related information by documenting locations with customized notes, photos and descriptions,” said Ted Florence, president of Avenza Systems Inc. “This expands the utility of a map beyond location guidance, as it is also a tool to share experiences and locales with notes and photos. We continue to strengthen our community of map publishers and further advance the mapping tools consumers demand, and we look forward to seeing how the industry evolves in a digital age.”

PDF Maps is available now on the iTunes App Store free of charge for personal use. National Geographic maps can be accessed via the PDF Maps in-app store. For more information about the app, visit the Avenza PDF Maps website at www.pdf-maps.com or Avenza’s main website at www.avenza.com. Pricing of each map is set by the publisher, and free maps remain free to users through the PDF Maps in-app map store.

About National Geographic Maps

National Geographic Maps was established as a division of the National Geographic Society in 1915 and has been producing maps for National Geographic magazine and other Society media for nearly 100 years. National Geographic Maps publishes wall maps, outdoor recreation maps, travel maps, interactive maps, atlases and globes that inspire people to care about and explore their world. For more information visit www.natgeomaps.com.

About Avenza Systems Inc.

Avenza Systems Inc. is an award-winning, privately held corporation that provides cartographers and GIS professionals with powerful software tools for making better maps as well as the PDF Maps mobile mapping system. In addition to software offerings for Mac and Windows users, Avenza offers value-added data sets, product training and consulting services. For more information visit the Avenza website at www.avenza.com.

Contacts:
Christine Simmons / Shana Starr
LFPR Public Relations – www.lfpr.com (for Avenza)
949-502-6200 ext. 320/209
Christines@lfpr.com.com / Shanas@lfpr.com

Kelsey Flora
National Geographic
202-828-8023
kflora@ngs.org

Creating Grids in MAPublisher with an Alternative Coordinate System

In a previous blog about Grids and Graticules, we quickly introduced one of the major features of the new Grid and Graticule tool. We’d like to share another major feature when creating grids: creating grids with an alternative coordinate system.

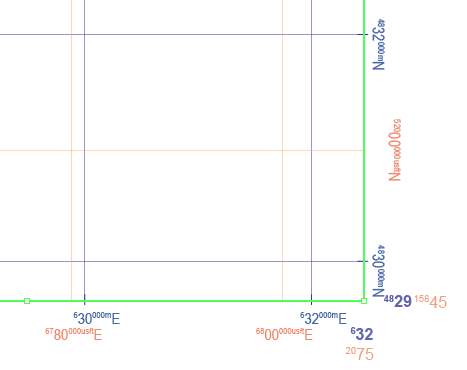
For example, the MAP View has a coordinate system “NAD 83 / UTM zone 17N” (in metres). You might want to make grid lines with the same coordinate system but in different units. You can do so by creating a custom coordinate system and then specifying the desired unit (US Foot, for this example), then creating a grid based on custom coordinate system. In this example, a grid with NAD83/UTM zone 17N (metres) coordinate system is created in the blue colour. Another grid with a NAD83/UTM zone 17N (USFoot) custom coordinate system is created with the orange colour.

Specifying alternative coordinate system for grids

Example of grid lines with UTM in metres and US foot

Likewise, you can create multiple sets of measured grids with different coordinate systems in one MAP View (e.g. one set with NAD83 UTM, another with NAD27 UTM, another with some other local coordinate system) without the need to transform the MAP View.

MAP Attribute Panel: Attribute Tear-Off Panel (CS6 or higher versions only)

MAPublisher Attribute Panel

A little known (but very useful) feature is the Attribute Tear-Off Panel which is located in the upper-right corner of the MAP Attribute panel (available in MAPublisher that’s compatible with Adobe Illustrator CS6 or higher). Use it to help you edit and view attributes even when they are deselected. It is very handy when used to compare attributes of different datasets.

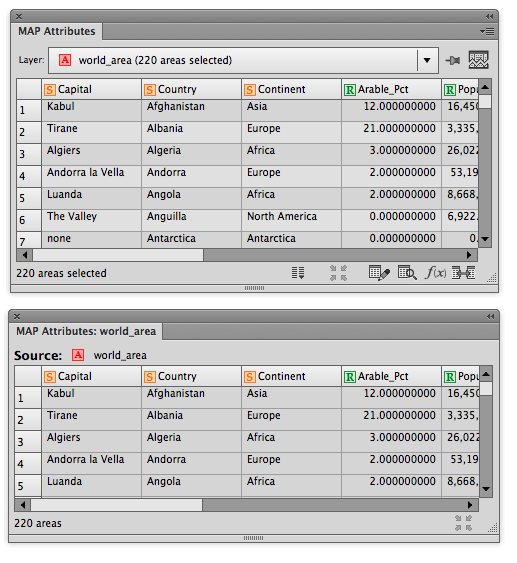
Simply click the MAPublisher Attribute Panel: Tear-off icon Attribute Tear-Off Panel icon to open another MAP Attribute panel. There are a few key difference between MAP Attribute panel and Tear-off panel:

1) The tear-off panel does not have any MAP Attribute functions (e.g. Join Tables, Find and Replace, Edit Schema, etc).

MAPublisher Attribute Panel and Tear-off Panel:


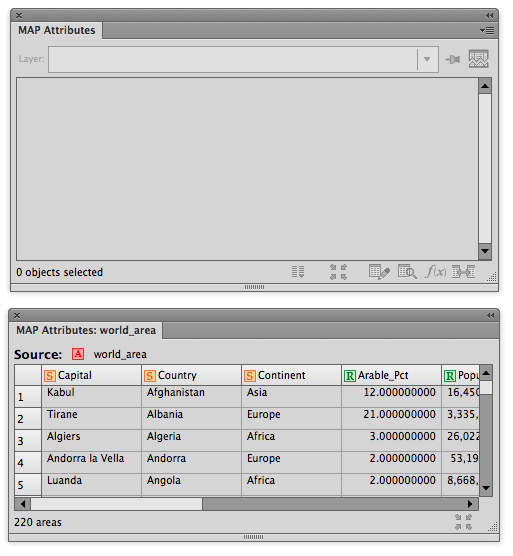
2) The tear-off panel view remains active and shows attributes even after features are deselected.

MAPublisher Attribute Panel and Tear-off panel when objects are deselected.

If your data values are updated within MAP Attribute panel, click the Attribute Tear-Off Panel again MAPublisher Attribute Panel: Tear-off icon to update the values in the tear-off panel.

Labeling Trick for MAPublisher

This blog post was written by Avenza reseller in The Netherlands, Hans van der Maarel of Red Geographics.

When you’re labeling point features (let’s say cities) in MAPublisher, using either Label Pro or Label Features, and you’re not placing a label for every single point, you’re left with the task of removing the points you haven’t labeled. This trick will have the text inherit the attribute structure of the points including a lat/long and guarantee that there are no orphan points.

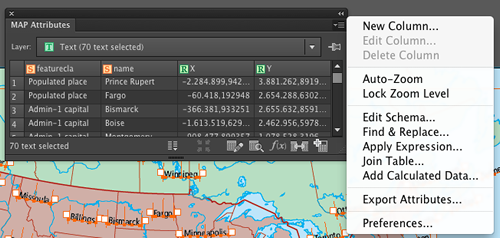
Take for example the above map. I want to label the cities, but not all of them. I’ll decide as I go along which city will get labeled, and which will get dropped. In order to more easily remove the unlabeled cities I need to do some preparation. I’ll create two columns in the cities layer, X and Y, and assign the expression #MapX and #MapY to them, respectively. It’s important that you do this through the Apply Expression option in the Map Attribute panel.

This gives two attributes with the original coordinates of the city points.

Next, I’ll create a layer for the labels and put it into the MAP View as a text layer, indicating that I want to copy the attribute structure of the cities layer.

Now that all the preparatory work is done, I’ll start the labeling. I’m going to be using the Label Features option, but this will work with MAP LabelPro as well.

If I select one of the texts and look at its attributes, I’ll see that the attributes from the city point have been transferred to the text, including the X and Y attributes which hold the position of the original city point.

Next, I’ll remove the city points layer, select all city labels and use the Export Attributes option in the MAP Attributes panel:

This will export a comma-delimited text file (CSV). Make sure to check the “Field names on first line” option. It’s not exactly necessary, but it will make things a lot easier.

Import the CSV file back into MAPublisher. Make sure to specify that the projection of the data is the same as the existing MAP View. Once the data is imported, you can apply any existing Stylesheets that you had in place to style the cities, or create a new one. This way, you end up with just the symbols for the cities you’ve actually labeled.

Creating a Super Overlay in Google Earth Pro

Our friends in the map library at Brock University in St. Catherines, Ontario have put together a very nice how-to on creating super overlays for Google Earth using Geographic Imager and Adobe Photoshop.

These instructions describe the process of georeferencing a high-resolution image, creating a geotiff file, using Google Earth Pro to make a super overlay and how to provide access to others. The full process is outlined here https://www.brocku.ca/maplibrary/Instruction/Creating_a_super_overlay.pdf

The Brock University Map Library can be contacted at maplib@brocku.ca

Create HTML5 Maps with MAP Web Author in Adobe Illustrator and How to Embed Them on your Website


What is HTML5?

HTML5 is the current major revision of HTML (Hypertext Markup Language), the core markup language of the Internet. One of its major development goals was to reduce the need for proprietary, plug-ins such as Adobe Flash and to provide new graphics drawing abilities to the canvas element of HTML5. Scripting (e.g. JavaScript) is used to draw graphics, animations, and display other types of content. The potential of applications in online mapping with HTML5 technology varies widely including uses in fields such as cartography, GIS, demographics, and statistics.

Introduction to HTML5 Map Web Author

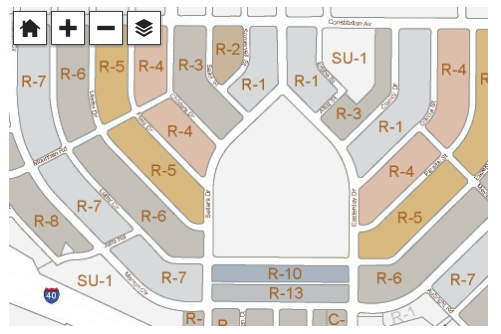
As maps become more detailed and data sources becoming richer, the way we present multiple data layers and map projections in dynamic map zoom levels and extents, traditional web mapping techniques start to become too limited. While many current web maps are rendered and served through a server, this could limit the amount of data provided and be slow to transfer as more and more tiles are served. MAP Web Author uses a technique to make maps from Adobe Illustrator compatible with browsers that support HTML5, specifically the canvas element. The maps exported using MAP Web Author are not server-side rendered, instead, they are rendered on-the-fly and content dynamically changes when the map is panned or the map zoom level is changed. This ultimately produces a more flexible, interactive and dynamic map. An HTML5 map also has more efficient storage and requires less space than other web map technologies. Stored vector map data (points, lines, and areas) is more efficient than raster tiles and can be displayed at any scale and even styled using CSS. Since HTML5 technology replaces browser plug-ins like Flash or Java, web maps generated by MAPublisher are accessible on Android, iOS, and Windows mobile devices (smartphones and tablets).

Files created from export

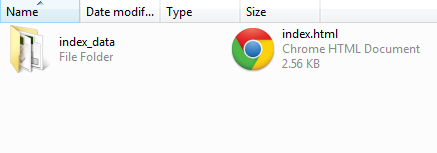
After exporting your map using MAP Web Author to HTML5 format, several files will be created. A ready to use index.html file and an index_data folder. The index.html file contains pre-formatted code necessary to view your map. In most instances, you can simply open the file in a browser to view the web map.

The index_data folder contains all of the necessary map layer data, JavaScript files, and CSS files to display your map.


How to embed an HTML5 web map into your site

The viewer will be embedded inside of a div element in your page (the “container div”). The map view will fill the container div.

For mobile specific sites we recommend setting the width and height of the container div to 100%, then using max-width and max-height to limit the width to the size of the map. The style should fit in the head, like this:

<style>
	#map_container {
		max-width: 479px; 
		width: 100%;
		max-height: 320px;
		height: 100%;
	}
</style>

For standard websites we recommend explicitly setting a width and height of the container div. The style should fit in the head, like this:

<style>
	#map_container {
		width: 479px; 
		height: 320px;
	}		
</style>

The following script tags must be included in the head tag as well. These scripts contain JavaScript functions that allow the map to function, like so:

<script src="index_data/jquery-1.7.1.min.js"></script>
<script src="index_data/openseadragon-min.js"></script>
<script src="index_data/avenza-viewer.js">lt;/script>

Keep note that the prefixUrl points to the directory where your map data is stored. It should be a relative path to avoid cross-site access errors. The id is used below in the body of your page.

<script>
	var avenzaViewer;
	$(function () {
		
		AVENZA.initialize();
		avenzaViewer = AVENZA.embedViewer({
			id: 'map_container',
			prefixUrl: 'index_data/'
		});
	});
</script>

Within the body tag, place the div element where appropriate. Specifying the div element id initiates the JavaScript to display the HTML5 web map. If a browser that is not compatible is used, then the message is displayed.

<div id="map_container">
	<div style="display:none">
		<!-- 
		The message below will appear instead of the map if 
		a user connects with a browser that does not support 
		enough HTML5 for the map viewer to function. You may 
		wish to customize the message for your site.
		-->
		A web browser that supports HTML5 is required in order 
		to view this content. If you are seeing this message 
		then your current web browser does not. 
 
		Please upgrade.
</div>


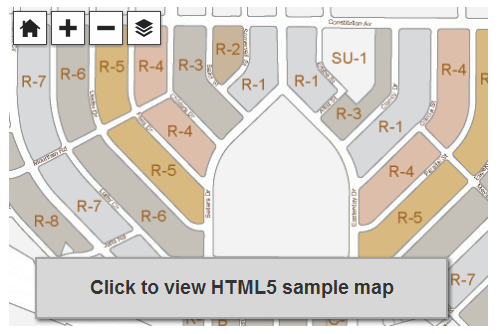
More information and sample HTML5 maps can be found in the MAP Web Author section.

News Archive